Indicators: Pivot_Fibs
Forum on trading, automated trading systems and testing trading strategies
Indicators: Pivot Lines TimeZone
newdigital, 2014.01.30 11:06
How to Use Forex Yearly Pivot Points to Forecast Euro Targets (based on dailyfx article)
- Pivot points is a popular and easy way that traders can identify potential support and resistance
- Pivot points are based on a mathematical calculation that uses the previous high, low and close of a specified period; weekly, daily, monthly, yearly
- Yearly pivots can forecast maximum and minimum price extremes for the coming year as well as areas where price can change direction.
While most traders are familiar with daily, weekly, and even monthly pivots which fit their type of trading, yearly pivots can also be used to forecast future potential support and resistance areas. Buying at or near a significant area of support and selling at a key area of resistance is the main focus of any trader no matter what the market or the duration traded. Yearly pivots can be monitored for those key trading opportunities.
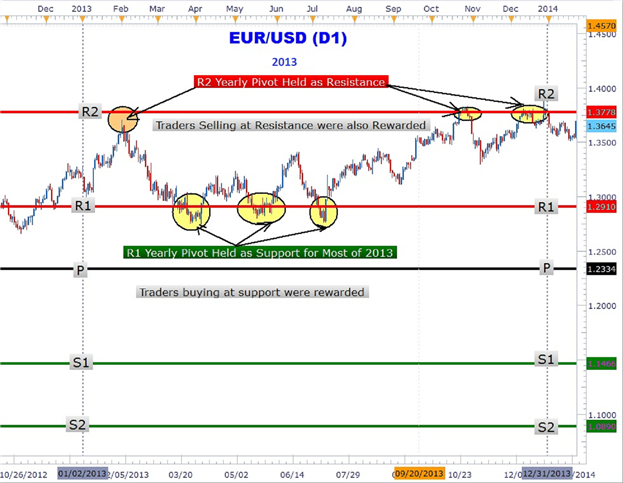
As you can clearly see in the Euro chart above, forex yearly pivots have been plotted. Notice how the Euro rallied up to the R2 pivot and turned around sharply falling over 600 pips in February. Another significant area that can be easily seen showing the power of
yearly pivots is the triple touch of the R1 yearly pivot at 1.2910. The
third and final touch led to over a 600-pip rally back to the R2 yearly
pivot to close out 2013 up over 4%.
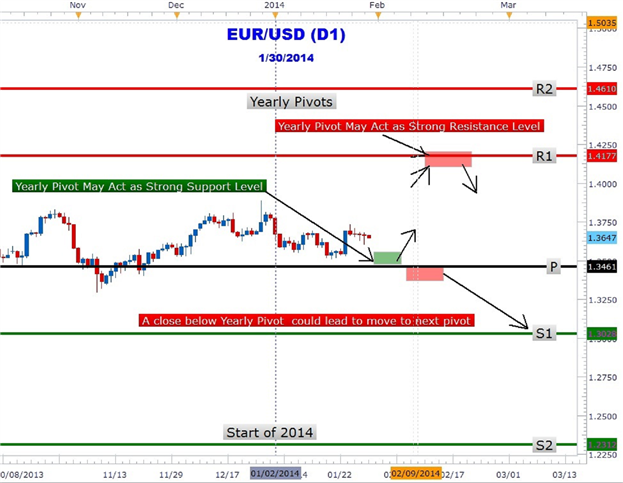
Could forex yearly pivots show traders the next move in the Euro? In the
chart above the 2014 yearly pivots are plotted on the EURUSD chart. The
year is just getting started and the great thing about yearly pivots is
only having to draw them once a year! EURUSD is trapped between the
central pivot at 1.3461 and R1 at 1.4177. As at the time of this
writing, the Euro has not tested either pivot. However, forex traders
may be waiting for a move down to the central pivot (1.3461) for a move
back toward the R1 (1.4177) yearly pivot resistance.
Alternative scenario is for the Euro to make an immediate run for it up
to the R1 level. At R1 pivot resistance, traders may look to take profit
on their longs and/or short the Euro at this level. However, a close
above R1 could lead to a move higher to the R2 pivot (1.4610). Traders
should also consider the possibility of a close below the central pivot
that could lead to a prolonged down push to the S1 (1.3028) level.
Forex traders who scalpers, position or swing traders can make use of
yearly pivots to locate key areas of support and resistance. Look for
future articles on other currency pairs that lay out the yearly pivot
‘landscape’ to help you navigate the forex market.
Forum on trading, automated trading systems and testing trading strategies
Indicators: Fibonacci retracement
newdigital, 2013.11.21 12:06
Fibonacci Retracements (based on stockcharts article)
Introduction
Fibonacci Retracements are ratios used to identify potential reversal levels. These ratios are found in the Fibonacci sequence. The most popular Fibonacci Retracements are 61.8% and 38.2%. Note that 38.2% is often rounded to 38% and 61.8 is rounded to 62%. After an advance, chartists apply Fibonacci ratios to define retracement levels and forecast the extent of a correction or pullback. Fibonacci Retracements can also be applied after a decline to forecast the length of a counter trend bounce. These retracements can be combined with other indicators and price patterns to create an overall strategy.
The Sequence and Ratios
This article is not designed to delve too deep into the mathematical
properties behind the Fibonacci sequence and Golden Ratio. There are
plenty of other sources for this detail. A few basics, however, will
provide the necessary background for the most popular numbers. Leonardo
Pisano Bogollo (1170-1250), an Italian mathematician from Pisa, is
credited with introducing the Fibonacci sequence to the West. It is as
follows:
0, 1, 1, 2, 3, 5, 8, 13, 21, 34, 55, 89, 144, 233, 377, 610……
The sequence extends to infinity and contains many unique mathematical properties.
- After 0 and 1, each number is the sum of the two prior numbers (1+2=3, 2+3=5, 5+8=13 8+13=21 etc…).
- A number divided by the previous number approximates 1.618 (21/13=1.6153, 34/21=1.6190, 55/34=1.6176, 89/55=1.6181). The approximation nears 1.6180 as the numbers increase.
- A number divided by the next highest number approximates .6180 (13/21=.6190, 21/34=.6176, 34/55=.6181, 55/89=.6179 etc….). The approximation nears .6180 as the numbers increase. This is the basis for the 61.8% retracement.
- A number divided by another two places higher approximates .3820 (13/34=.382, 21/55=.3818, 34/89=.3820, 55/=144=3819 etc….). The approximation nears .3820 as the numbers increase. This is the basis for the 38.2% retracement. Also, note that 1 - .618 = .382
- A number divided by another three places higher approximates .2360 (13/55=.2363, 21/89=.2359, 34/144=.2361, 55/233=.2361 etc….). The approximation nears .2360 as the numbers increase. This is the basis for the 23.6% retracement.
1.618 refers to the Golden Ratio or Golden Mean, also called Phi. The inverse of 1.618 is .618. These ratios can be found throughout nature, architecture, art and biology. In his book, Elliott Wave Principle, Robert Prechter quotes William Hoffer from the December 1975 issue of Smithsonian Magazine:
….the proportion of .618034 to 1 is the mathematical basis for the shape of playing cards and the Parthenon, sunflowers and snail shells, Greek vases and the spiral galaxies of outer space. The Greeks based much of their art and architecture upon this proportion. They called it the golden mean.
Alert Zones
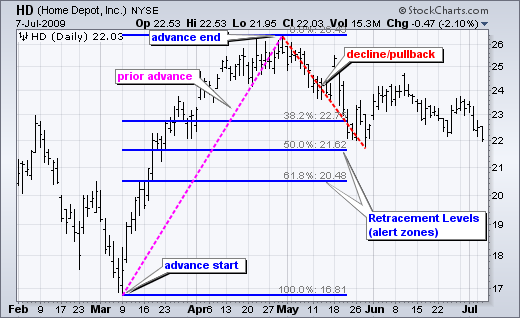
Retracement levels alert traders or investors of a potential trend
reversal, resistance area or support area. Retracements are based on the
prior move. A bounce is expected to retrace a portion of the prior
decline, while a correction is expected to retrace a portion of the
prior advance. Once a pullback starts, chartists can identify specific
Fibonacci retracement levels for monitoring. As the correction
approaches these retracements, chartists should become more alert for a
potential bullish reversal. Chart 1 shows Home Depot retracing around
50% of its prior advance.
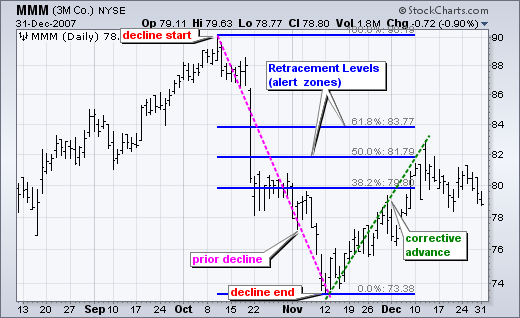
The inverse applies to a bounce or corrective advance after a decline.
Once a bounce begins, chartists can identify specific Fibonacci
retracement levels for monitoring. As the correction approaches these
retracements, chartists should become more alert for a potential bearish
reversal. Chart 2 shows 3M (MMM) retracing around 50% of its prior
decline.
Keep in mind that these retracement levels are not hard reversal points. Instead, they serve as alert zones for a potential reversal. It is at this point that traders should employ other aspects of technical analysis to identify or confirm a reversal. These may include candlesticks, price patterns, momentum oscillators or moving averages.
Common RetracementsThe Fibonacci Retracements Tool at StockCharts shows four common retracements: 23.6%, 38.2%, 50% and 61.8%. From the Fibonacci section above, it is clear that 23.6%, 38.2% and 61.8% stem from ratios found within the Fibonacci sequence. The 50% retracement is not based on a Fibonacci number. Instead, this number stems from Dow Theory's assertion that the Averages often retrace half their prior move.
Based on depth, we can consider a 23.6% retracement to be relatively shallow. Such retracements would be appropriate for flags or short pullbacks. Retracements in the 38.2%-50% range would be considered moderate. Even though deeper, the 61.8% retracement can be referred to as the golden retracement. It is, after all, based on the Golden Ratio.
Shallow retracements occur, but catching these requires a closer watch and quicker trigger finger. The examples below use daily charts covering 3-9 months. Focus will be on moderate retracements (38.2-50%) and golden retracements (61.8%). In addition, these examples will show how to combine retracements with other indicators to confirm a reversal.
Moderate Retracements
Chart 3 shows Target (TGT) with a correction that retraced 38% of the
prior advance. This decline also formed a falling wedge, which is
typical for corrective moves. The combination raised the reversal alert.
Chaikin Money Flow turned positive as the stock surged in late June,
but this first reversal attempt failed. Yes, there will be failures. The
second reversal in mid July was successful. Notice that TGT gapped up,
broke the wedge trend line and Chaikin Money Flow turned positive (green
line).
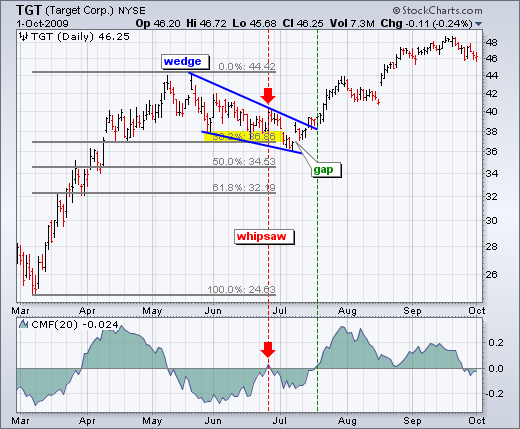
Chart 4 shows Petsmart (PETM) with a moderate 38% retracement and other
signals coming together. After declining in September-October, the stock
bounced back to around 28 in November. In addition to the 38%
retracement, notice that broken support turned into resistance in this
area. The combination served as an alert for a potential reversal.
William %R was trading above -20% and overbought as well. Subsequent
signals affirmed the reversal. First, Williams %R moved back below -20%.
Second, PETM formed a rising flag and broke flag support with a sharp
decline the second week of December.
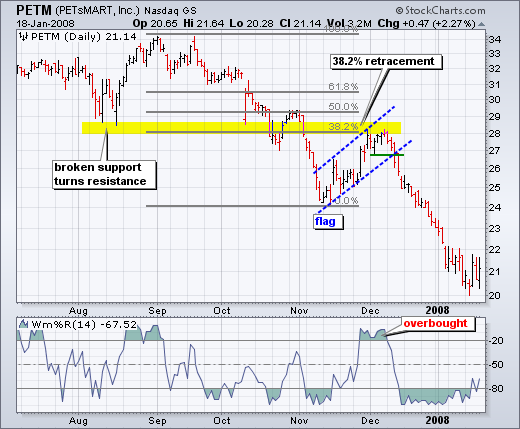
Chart 4 shows Pfizer (PFE) bottoming near the 62% retracement level.
Prior to this successful bounce, there was a failed bounce near the 50%
retracement. The successful reversal occurred with a hammer on high
volume and follow through with a breakout a few days later.
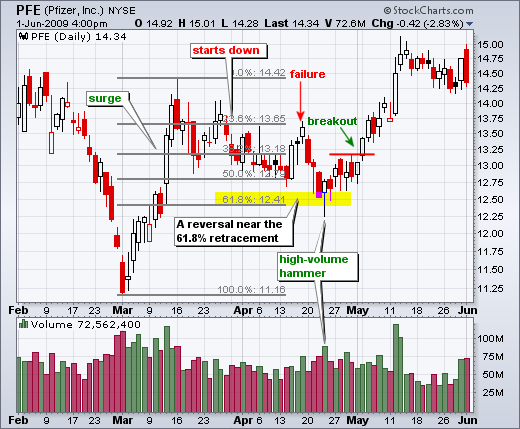
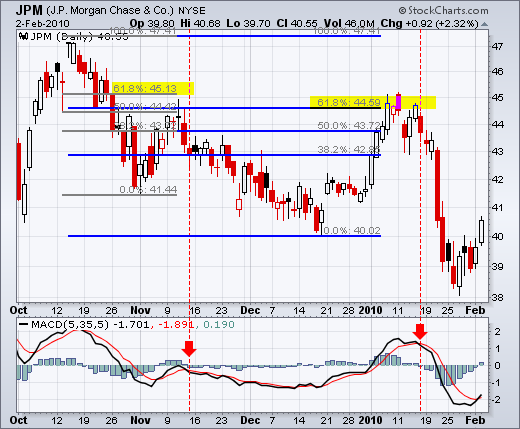
Chart 5 shows JP Morgan (JPM) topping near the 62% retracement level.
The surge to the 62% retracement was quite strong, but resistance
suddenly appeared with a reversal confirmation coming from MACD
(5,35,5). The red candlestick and gap down affirmed resistance near the
62% retracement. There was a two day bounce back above 44.5, but this
bounce quickly failed as MACD moved below its signal line (red dotted
line).
Fibonacci retracements are often used to identify the end of a correction or a counter-trend bounce. Corrections and counter-trend bounces often retrace a portion of the prior move. While short 23.6% retracements do occur, the 38.2-61.8% covers the more possibilities (with 50% in the middle). This zone may seem big, but it is just a reversal alert zone. Other technical signals are needed to confirm a reversal. Reversals can be confirmed with candlesticks, momentum indicators, volume or chart patterns. In fact, the more confirming factors the more robust the signal.
Forum on trading, automated trading systems and testing trading strategies
newdigital, 2014.06.13 07:43
The Rabbit Hole of Fibonacci (adapted from this article)- We look at the history and background of the mathematical concept known as ‘The Fibonacci Sequence’
- We show you how traders can apply these mathematical studies to their trading.
Fibonacci
This is one of the more in-depth support and resistance methods out there, and there are a lot of different ways that traders look to integrate Fibonacci in their trading.
Taking a step back, Fibonacci is named after the 12th century mathematician, Leonardo of Pisa. In 1202 AD, Leonardo published a composition with the name of Liber Abaci that consisted of a numerical sequence that eventually became named after him. Leonardo of Pisa didn’t discover the sequence; he merely used it as an example in his composition.
The sequence is thought to have been originally used by Indian mathematicians as early as the 6th century; and in Liber Abaci, this numerical sequence was introduced the western world. The sequence introduced by Leonardo of Pisa was a system that found the next value in the sequence by adding the two previous numbers. The sequence shared in Liber Abaci was as follows:
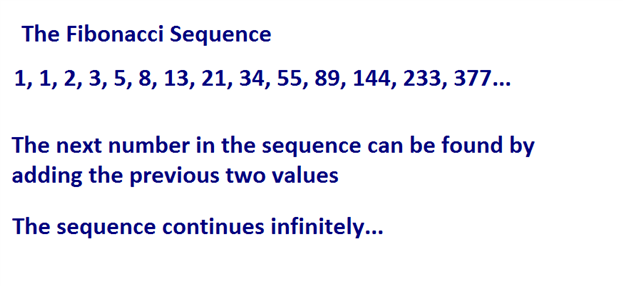
Today these values are called ‘Fibonacci numbers’ and are used by many traders as input values for indicators along with a slew of other purposes.
But input values on trading indicators aren’t the only place that we’ll see this system at work. The Fibonacci sequence has excited mathematicians and scientists for thousands of years because of its numerous applications in the world around us. One of the initial applications that Leonardo of Pisa investigated in his original manuscript was the population growth of rabbits. He found that as an isolated population of rabbits grew, the population would grow according the Fibonacci sequence. Starting with one pair of rabbits, the population would then grow to two; which would become three, and then five, eight, thirteen, etc. The sequence is also prominent in population growth within honeybees, the number of petals on a flower, and the formation of pine cones just to name a few.
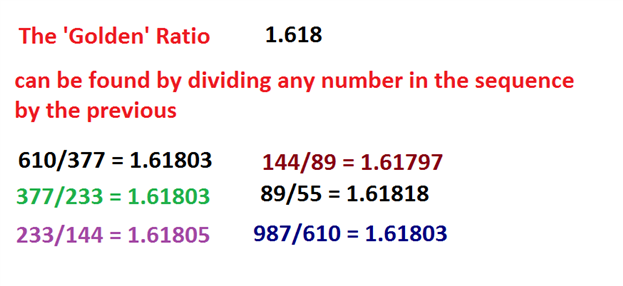
Many believe the Fibonacci sequence to be the language of nature itself. If you want to see more on this topic, Fibonacci was prominently featured as part of the movie Pi; the fictional movie released in 1998 that follows a mathematician’s quest in predicting the future based on mathematics. But even outside of fictional movies, the numerous manners with which the sequence appears in the world around us is fascinating and definitely worthy of a google-search.
But that’s not the only exciting aspect of the Fibonacci sequence. More fascinating is what we can see if we look just a little bit below the surface. If you take the ratio of any two successive numbers, such as 144 and 233 and divide the second number (233) by the first (144), you’ll eventually move towards a very special number of 1.618 (61.8%). In this specific example, the exact value would be ‘1.6180555…’ The deeper we get in the sequence, the closer this ratio moves towards 1.618 until eventually the ratio stands at exactly 1.618. This number is the prize behind Fibonacci, and it has fascinated mathematicians and scientists for thousands of years.
The number of 1.618 is called ‘The Golden Ratio,’ and can be found in numerous applications within nature ranging from the spirals of a sea shell to leaf arrangements of a houseplant.
Trading with Fibonacci (and the Golden Ratio)
Traders will often employ Fibonacci when looking to trade retracements in a trend, centering support and resistance levels around intervals defined by the Golden Ratio of 1.618.
The center of Fibonacci analysis is at the .618 interval of the trend, taken directly from the golden ratio. But we can take this a step further by dividing a number in the sequence by the number located two figures to further. If we take 34 and divide that number by 89; or if we take 133 and divide that by 377, we consistently receive values of ~.382 (38.2%). This is the next value that traders will plot via Fibonacci analysis.
We can then do the same thing with by dividing any number in the sequence with the digit located two places further. So, for example, if we divide 34 by 144; or if we divide 55 by 233, we consistently receive values of ~.236 (23.6%). Traders have taken this a step further to examine the mid-line of the move (.50, or 50%), and .786 (78.6% - or the reciprocal of .236). The finished result is what we have below using the weekly GBPUSD chart:
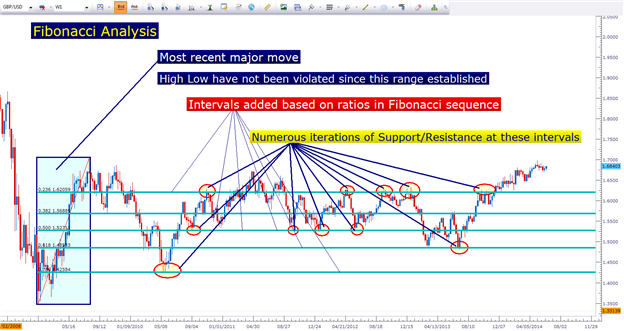
As you can see in the above chart, these price levels on a chart can exhibit phenomenal examples of support and/or resistance coming in the market place. And luckily for us, using Fibonacci as a trader is significantly easier than proving any ‘magical’ components behind it as mathematicians have attempted to do for the past couple thousand years.
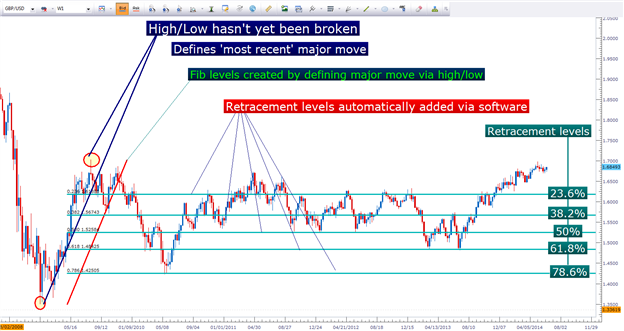
To use Fibonacci, a trader needs to merely identify a most recent ‘major move.’ This is where subjectivity comes in to play. This major move can be on the 5-minute chart, the hourly chart, or the weekly chart (as we had done with GBPUSD above). But like we saw with Pivot Points, longer-terms and more data generally brings more value to the analysis simply because more traders may be seeing it. If we draw a Fibonacci retracement on a 5-minute chart; it might be seen by a few other traders whereas a retracement taken from the weekly chart will likely generate more interest from traders simply because it encapsulates significantly more data.
Traders can use the Fibonacci tool available in most trading platforms to define the move, and then levels at the proper intervals of .236, .382, .500, .618, and .786 can be drawn in. So, when prices move down to the .236 line, we can say that 23.6% of that trend has been retraced. Or if prices move down the .618 level, 61.8% of the trend has been re-traced.
- Free trading apps
- Over 8,000 signals for copying
- Economic news for exploring financial markets
You agree to website policy and terms of use
Pivot_Fibs:
Author: Nikolay Kositsin