Indicators: Renko Level
that last image you show looks like support/resistance, settings pls. this is for mt5?
thx
Tom
that last image you show looks like support/resistance, settings pls. this is for mt5?
thx
Tom
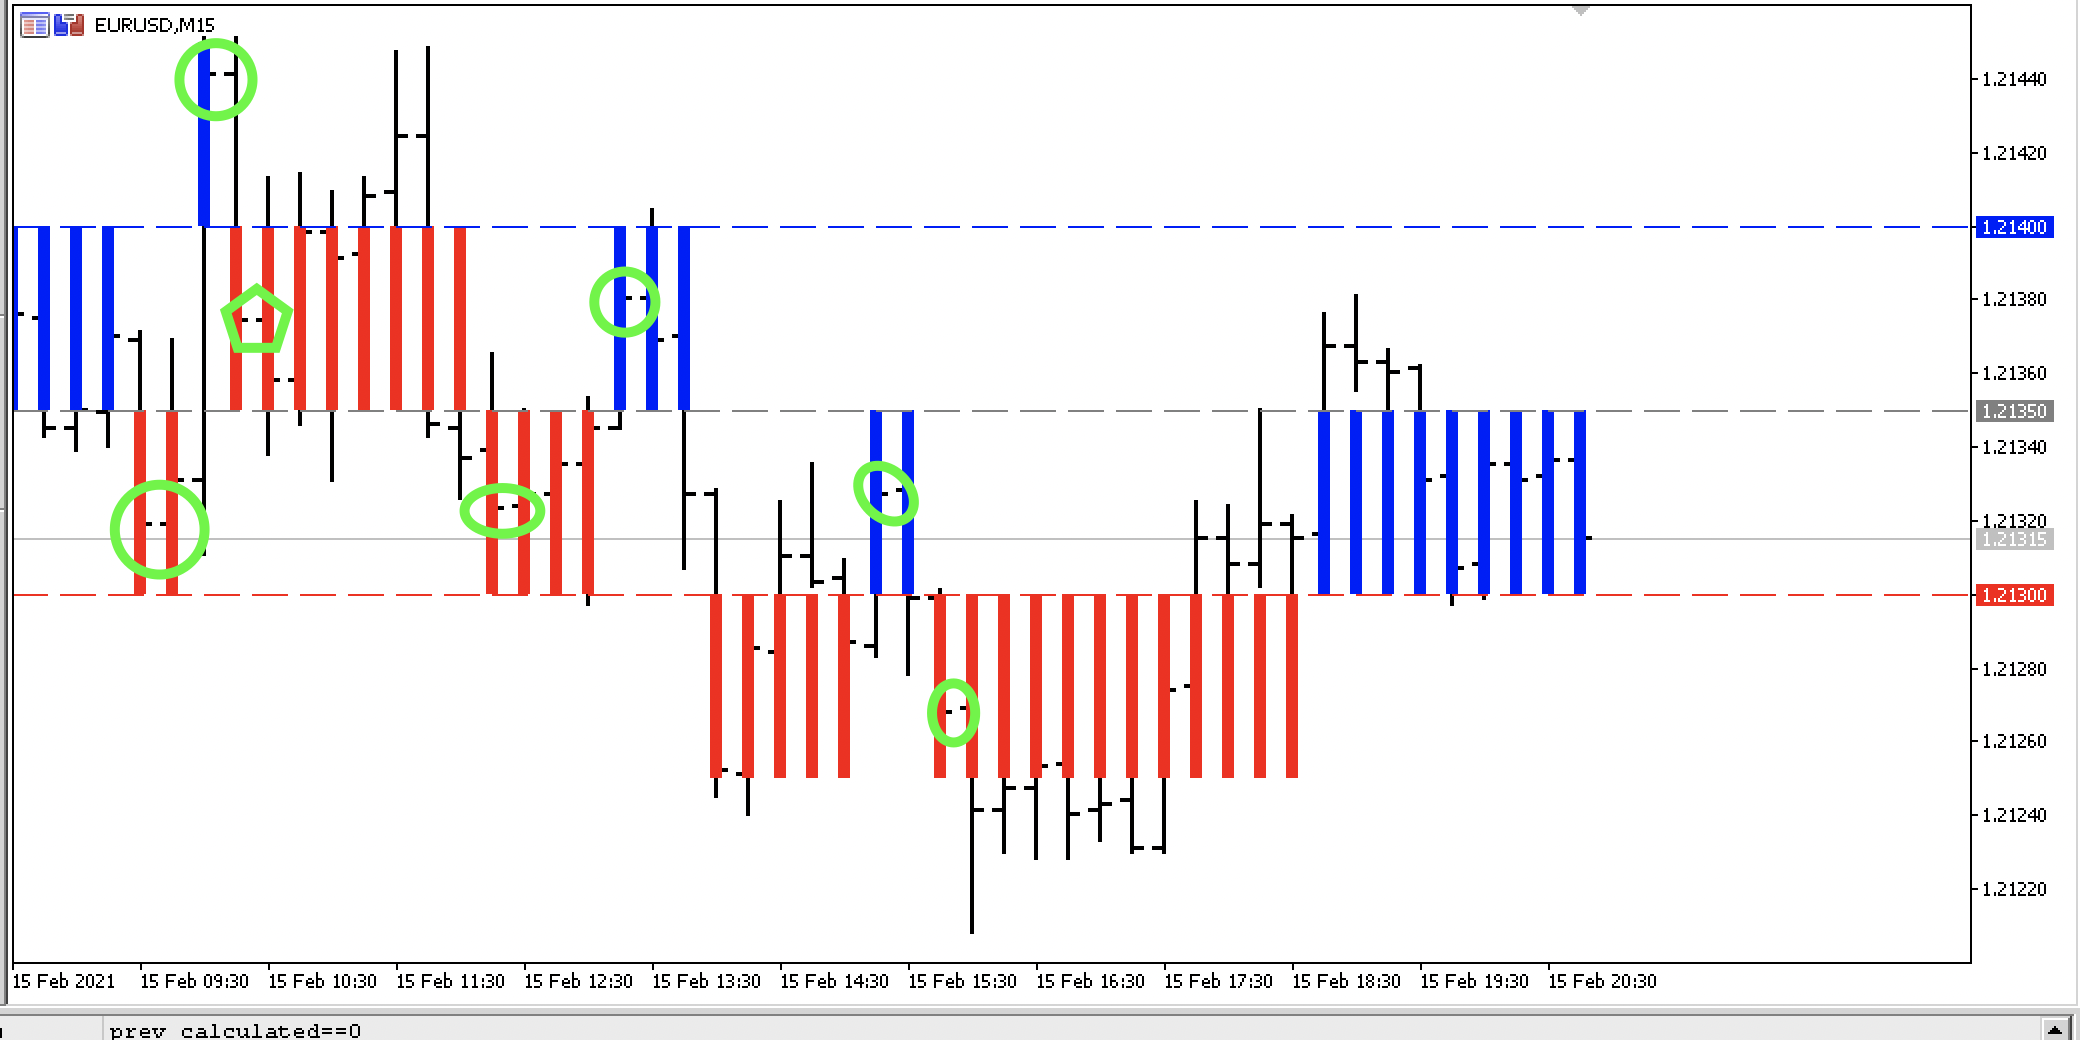
On the image:

Lines correspond to the levels:
- price_ceil
- price_round
- price_floor
HI,
do you have the mql4 version of this indicator? appreciate greatly.
HI,
do you have the mql4 version of this indicator? appreciate greatly.
No. mql4 is the old terminal. Five years ago I stopped supporting the old terminal.
Hello, Is there a way to modify the code simply so that for a bullish Renko candle the Current price is the same as the price_ceil? In this case the price_ceil - price_floor would be the length of the Renko candle.
I do not understand what exactly is needed. The code does just that.
Hello Vladimir,
Can you update the Renko Level Indicator to use DRAW_FILLING instead of DRAW_COLOR_HISTOGRAM2 as it would look much better, histogram makes it hard to see.
https://www.mql5.com/en/docs/customind/indicators_examples/draw_filling

- www.mql5.com
Hello Vladimir,
Can you update the Renko Level Indicator to use DRAW_FILLING instead of DRAW_COLOR_HISTOGRAM2 as it would look much better, histogram makes it hard to see.
https://www.mql5.com/en/docs/customind/indicators_examples/draw_filling
Here is the new version ( DRAW_FILLING drawing style applied ) - Renko Level Fills
Hi your Renko chart is supposed to plot based on the close price, But it doesn't seem to behave like that. You have done something similar to trading view charts but the charts aren't plotting the same data. The Renko candles should only be printed if the close of the candle is confirmed below the Renko close level.
- Free trading apps
- Over 8,000 signals for copying
- Economic news for exploring financial markets
You agree to website policy and terms of use
Renko Level:
The indicator displays the Renko bars on the MetaTrader 5 chart.
Author: Vladimir Karputov