Forecast and levels for Oil
Forum on trading, automated trading systems and testing trading strategies
Sergey Golubev, 2017.04.01 10:07
Weekly Fundamental Forecast for Crude Oil (based on the article)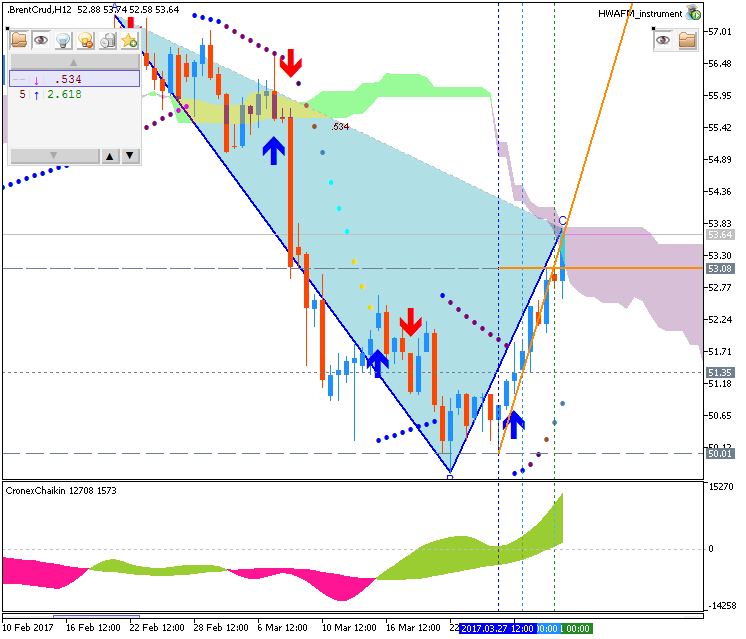
Crude Oil - "The beginning of Q2 is setting up to be important for Oil traders to watch given what’s happening behind the price, which could determine if Crude Oil turns lower or much higher over Q2. One thing that is helpful to note is that counter to the equity market rallies across the world; Oil had a bad quarter. In looking at Energy stocks, the Oil & Gas sector was the worst performing sector for Q1 being down nearly 3%. In looking at the options markets; options traders are betting on theupside or a large reversion to the mean on the back of reports that OPEC is building consensus to extend the production cuts and encouraging US refinery demand data. The $64,000 question is whether or not Oil price and the Oil sector is leading or set to revert higher to stocks. The options market is betting on the latter as hope emerges that OPEC will extend the cut and give time for market demand to pull down the global stockpiles, which reached record levels in the US in Q1 due to US supplies."
Forum on trading, automated trading systems and testing trading strategies
Sergey Golubev, 2017.04.05 17:15
U.S. Commercial Crude Oil Inventories news event: daily rally; the key levels are 57 and 50
2017-04-05 15:30 GMT | [USD - Crude Oil Inventories]
- past data is 0.9M
- forecast data is -0.1M
- actual data is 1.6M according to the latest press release
[USD - Crude Oil Inventories] = Change in the number of barrels of crude oil held in inventory by commercial firms during the past week.
==========
"U.S. commercial crude oil inventories (excluding those in the Strategic Petroleum Reserve) increased by 1.6 million barrels from the previous week."
==========
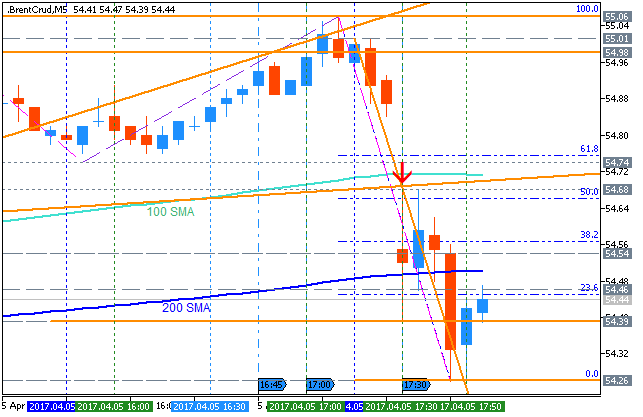
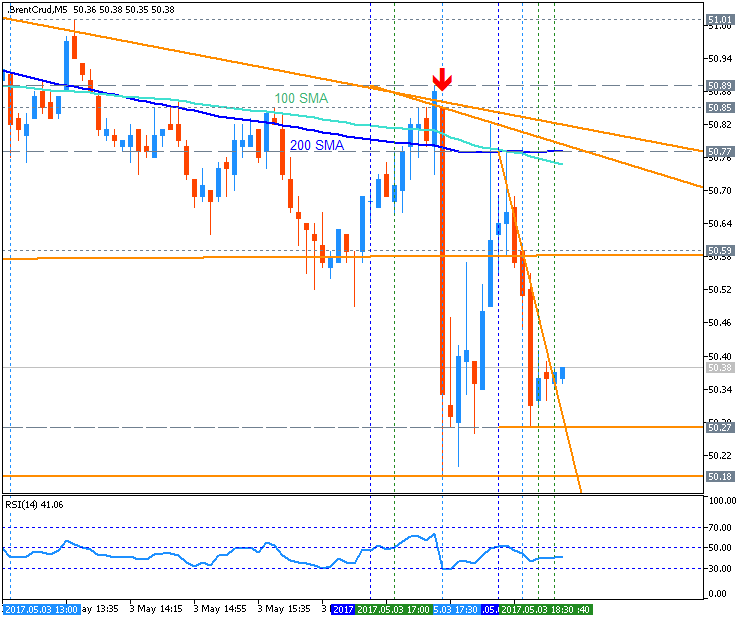
Crude Oil M5: bearish ranging reversal. The price broke 100 SMA/200 SMA ranging area to be reversed to the primary bearish market condition. For now, the price is on bearish ranging within 54.54 resistance level and 54.26 support level waiting for the direction of the strong trend to be started.
If the price breaks 54.54 resistance level to above on M5 close bar so the bullish reversal will be started.
If the price breaks 54.26 support so the bearish trend will be resumed.
If not so the price will be on bearish ranging within the levels.
==========
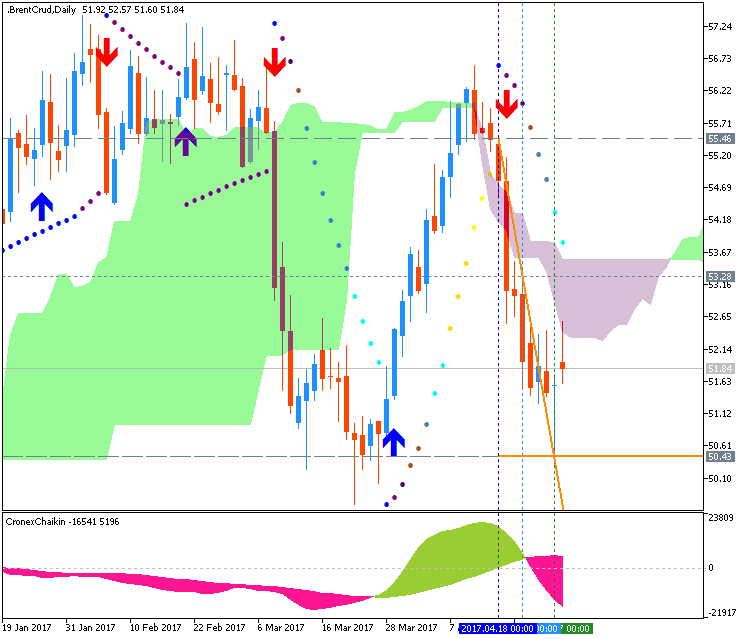
Crude Oil Daily: rally. The price is breaking 54.35 resistance level to above for the secondary rally to be continuing within the primary bearish market condition.

If daily price breaks 54.35 resistance on close daily bar so the secondary rally within the primary bearish market condition will be continuing.
If the price breaks 57.02 resistance on close bar so the daily price will be reversed to the bullish trend.
If the price breaks 50.01 support level to below so the bearish trend will be resumed.
If not so the price will be on bearish ranging within the levels.

Forum on trading, automated trading systems and testing trading strategies
Sergey Golubev, 2017.04.08 12:48
Weekly Fundamental Forecast for Crude Oil (based on the article)
Crude Oil - "The oil market also faces a couple of important data releases next week which could push the market if tensions in Syria ease. The monthly OPEC report is released on Wednesday April 12, providing traders with a detailed analysis of key developments in world oil demand, supply and the closely watched oil market balance. The US EIA crude oil inventories are also released on Wednesday, ahead of the IEA oil market report on Thursday and the Baker Hughes oil rig count on Friday April 14."
Forum on trading, automated trading systems and testing trading strategies
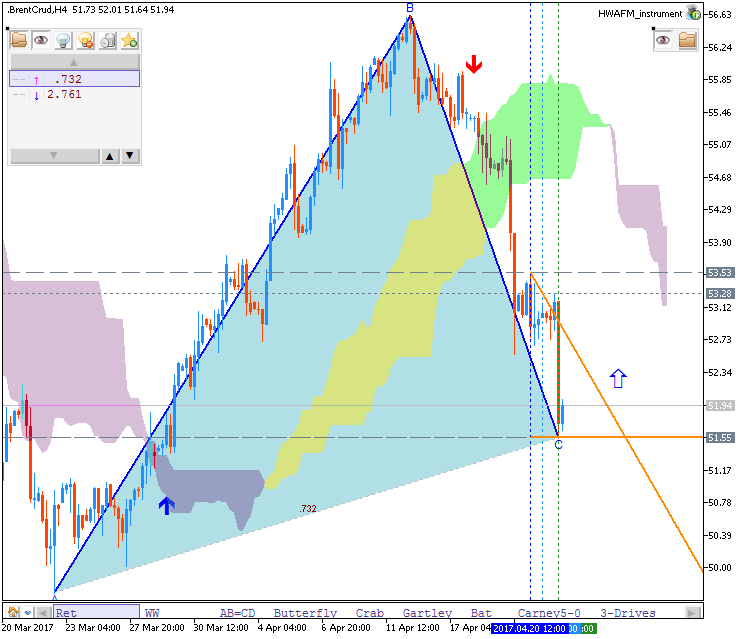
Sergey Golubev, 2017.04.21 07:33
Crude Oil Price Forecast: daily bearish reversal; 52.55 level is the key (based on the article)
Daily price broke Ichimoku cloud to below for the bearish reversal: the price is testing descending triangle pattern together with 52.55 support level to below for the bearish tred to be continuing.
"While OPEC may be winning in their battle to balance the global Oil market, it is not necessarily happening on the timeframe they would prefer. Naturally, it is not helpful that Shale production is at its highest levels since 2015. The U.S. Shale resurgence coupled with OPEC’s supply management continues to provide hope for Oil bulls. While Crude dropped ~3% on Wednesday, there is also likely to be volatility on expiration-position squaring is occurring as May WTI contract expires Thursday."
Forum on trading, automated trading systems and testing trading strategies
Sergey Golubev, 2017.04.22 11:10
Weekly Fundamental Forecast for Crude Oil (based on the article)
Next Week’s Data Points That May Affect Energy Markets:
- Monday 2:30 am ET: China final March energy and commodity trade data, including crude.
- Tuesday 4:30 PM ET: API weekly U.S. oil inventory report
- Wednesday 10:30 AM ET: EIA Petroleum Supply Report
- Thursday (All Day): International Oil Summit in Paris
- Fridays 1:00 PM ET: Baker-Hughes Rig Count at
- Friday 3:30 PM ET: Release of the CFTC weekly commitments of traders report on U.S. futures, options contracts
Crude Oil - "After the first round of French Presidential Election, Monday will provide important demand data from China. At 2:30 pm PM Beijing time, we will get an understanding of March energy and commodity trade data.Thursday will also be the start of the International Oil Summit in Paris with the participationofoil officials from Libya, Iran, oil ministers from Iraq, Nigeria, Angola, Algeria, the OPEC Secretary-General Barkindo, as well as the CEOs of Total and Saudi Aramco."
Forum on trading, automated trading systems and testing trading strategies
Sergey Golubev, 2017.04.29 09:46
Weekly Outlook: 2017, April 30 - May 07 (based on the article)
US Manufacturing data, Crude Oil Inventories, Employment figures from New Zealand, Canada as well as the important US NFP report, Rate decision in Australia, New Zealand, and the US, Speeches from Janet Yellen, Mario Draghi and Stephen Poloz. These are the highlights on forex calendar.
- US ISM Manufacturing PMI: Monday, 15:00. The manufacturing index is expected to register 56.6 in April.
- Australian rate decision: Tuesday, 5:30. Policymakers believe the cash rate will remained unchanged for the rest of this year.
- New Zealand employment data: Tuesday, 23:45. NZ job growth is expected to reach 0.8% and the unemployment rate is expected to decline to 5.1%.
- US ADP Non-Farm Employment Change: Wednesday, 13:15. The ADP reading is estimated to show a jobs gain of 178,000 during April.
- US ISM Non-Manufacturing PMI: Wednesday, 15:00. US service sector is expected to improve to 56.1 this time.
- US Crude Oil Inventories: Wednesday, 15:30.
- US Federal Funds Rate: Wednesday, 19:00. The Fed is not expected to change rates this time.
- US Unemployment Claims: Thursday, 13:30. The number of new jobless claims is expected to register 246,000 this week.
- Mario Draghi speaks: Thursday, 17:30. ECB President Mario Draghi will speak in Switzerland.
- Canadian employment data: Friday, 13:30. Canadian employment market is expected to show a job creation of 20,000 with 6.7% unemployment rate.
- US Non-Farm Payrolls and Unemployment rate: Friday, 13:30. The NFP for April is expected to register 194,000 new jobs in April.
- Janet Yellen speaks: Friday 18:30. Federal Reserve Chair Janet Yellen will speak in Providence about Women’s Participation in the Economy.
Forum on trading, automated trading systems and testing trading strategies
Sergey Golubev, 2017.05.03 17:56
U.S. Commercial Crude Oil Inventories news event: breakdown with the bearish reversal
2017-05-03 15:30 GMT | [USD - Crude Oil Inventories]
- past data is -3.6M
- forecast data is -3.3M
- actual data is -0.9M according to the latest press release
[USD - Crude Oil Inventories] = Change in the number of barrels of crude oil held in inventory by commercial firms during the past week.
==========
"U.S. commercial crude oil inventories (excluding those in the Strategic Petroleum Reserve) decreased by 0.9 million barrels from the previous week."
==========
Crude Oil M5: breakdown with the bearish reversal. The price broke 100 SMA/200 SMA by bouncing from 50.89 to below to be testing 50.18 support level for the M5 bearish trend to be continuing.
If the price breaks 50.89 resistance level to above on M5 close bar so the bullish reversal will be started.
If the price breaks 50.18 support so the bearish trend will be continuing.
If not so the price will be on bearish ranging within the levels.
==========
Crude Oil Daily: breakdown with the bearish reversal. The price was bounced from Senkou Span line of Ichimoku to below to be reversed to the primary bearish market condition. For now, the price is on testing the support level at 50.13 to below for the primary bearish trend to be continuing.

If the price breaks 53.28 resistance on close bar to above so the reversal of daily reversal to the bullish market condition will be started.
If the price breaks 50.13 support level to below so the bearish trend will be continuing.
If not so the price will be on bearish ranging within the levels.
Forum on trading, automated trading systems and testing trading strategies
Sergey Golubev, 2017.05.06 13:33
Weekly Fundamental Forecast for Crude Oil (based on the article)
Crude Oil - "Fast forward to the first week of May and little appears to be going right for the energy commodity. As of Friday morning, Crude Oil has traded 21.3% lower in 2017 from the opening range high of 2017. Some would call this a bear market as evidenced by a 20% drop. However, when you look at the industry alone, there doesn’t seem to be the panic that the price would indicate. We continue to see bullish call spreads being purchased in the options market in anticipation of eventual price recovery despite short-term downside still favored. Also, CEO of Marathon Oil, Lee Tillman recently noted that from a supply and demand point of view, little has changed as the price has plunged."
Forum on trading, automated trading systems and testing trading strategies
Goldman says oil prices on the brink of ‘capitulation’
Achirawit Anantachayakul, 2017.05.06 17:35
After crude-oil prices took a beating over the past week, falling to their lowest level since before OPEC-led a deal to curb output in November, analysts at Goldman Sachs say crude may reaching a “capitulation” point.
In a research note dated Friday, Goldman commodity strategists, headed by Damien Courvalin and Jeff Currie, said their 2017 forecast for Brent crude oil trading on London’s ICE exchange LCON7, +2.25% to hit $50 a barrel could be in jeopardy, if the prices continue to come under pressure:
Net, the faster decline in long-term oil prices than we expected this year is a clear downside risk to our spot price level forecast, even if it helps slow US production growth and achieve the inventory draws and the rotation of the forward curve into backwardation that we forecast. |
Goldman is referencing the current and future relationship between near-term and the long-term price of oil. A faster decline in contracts in the future may result in more oil being pushed out into the market. Higher prices for oil for future delivery than spot prices—a situation known as contango—tends to encourage crude participants to store oil with the expectation of selling the commodity in the future.
On Friday, West Texas Intermediate crude oil trading on the New York Mercantile Exchange CLM7, +2.09% the U.S. benchmark, logged a weekly decline of 6%. Prices on Thursday marked the lowest settlement since Nov. 29—the day before the Organization of the Petroleum Exporting Countries announced an agreement to limit production by 1.2 million barrels a day.
However, an unrelenting ramp up by U.S. shale-oil producers is being widely credited with the recent downturn in price action for oil, which peaked in late February.
Goldman’s analysts also see U.S. output pressuring oil (see Goldman’s chart below):
Goldman cites two other key reasons for the recent tumble in the commodity complex, including high-grade copper HGN7, +1.09% and iron ore: A China-fueled sell-off in base commodities, that was easing on Friday, and technical trading that has exacerbated the sharp selloff in U.S. benchmark oil and its European counterpart:
| Given the lack of any significant oil data releases on the day, we see two forces at play in this sell-off: (1) a follow through on the sharp declines in copper and iron ore the day before on concerns over growth in China, and (2) once again, the influence of technicals and positioning. |
Brent crude on London’s ICE Futures exchange LCON7, +2.25% is down nearly 6% for the week.
Goldman writes that although overall stocks have retreated, they may not be declining as fast as the analysts had forecast, which could weigh on prices.
| Despite this sharp move lower in prices and timespreads, our tracking of the oil market rebalancing suggests that the month of April featured further progress in reducing the inventory overhang, although at a pace short of prior consensus expectations. |
Adding to those concerns, a reading of rig counts by Baker Hughes Inc. BHI, +3.34% showed a 16th straight weekly increase in rigs drilling for oil, suggesting that shale producers in the U.S. may continue to ramp up production, fueling concerns of a renewed glut in crude.
Crude’s decline on Thursday helped to keep the S&P 500 index SPX, +0.41% and the Dow Jones Industrial Average DJIA, +0.26% near break-even levels, with the benchmarks tilting higher in Friday trade.
- Free trading apps
- Over 8,000 signals for copying
- Economic news for exploring financial markets
You agree to website policy and terms of use
Brent Crude Oil April-June 2017 Forecast: weekly correction with possible breakdown; 49.69 support is the key
W1 price located above Ichimoku cloud in the bullish area of the chart. The price is on the secondary correction which was started in the beginning of January located within the following support/resistance levels:
- 58.35 resistance level located far above Ichimoku cloud in the bullish trend to be resumed, and
- 49.69 support level located in the correctional thread to be continuing.
Chinkou Span line is near and above the price indicating the possible bearish breakdown by direction, Trend Strength indicator and Absolute Strength indicator are estimating the correction to be continuing in the near future. By the way, non-lagging (and very fast) Tenkan-sen/Kijun-sen signal is evaluating the bullish trend with the ranging situation for example.Trend:
W1 - correction