Press review - page 183
You are missing trading opportunities:
- Free trading apps
- Over 8,000 signals for copying
- Economic news for exploring financial markets
Registration
Log in
You agree to website policy and terms of use
If you do not have an account, please register
EUR/USD – Price Bottom vs. Rising Wedge (based on forexminute article)
This week, traders are putting in a price bottom for EUR/USD and trying to build momentum from it.
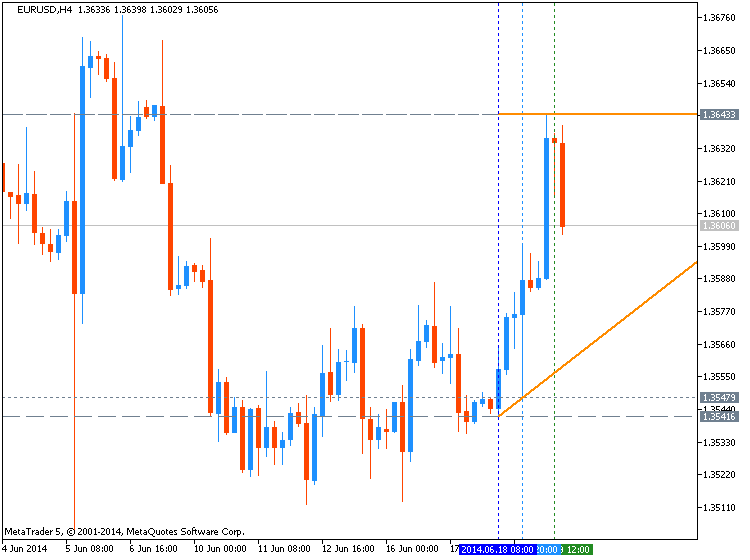
The 1H chart shows that last week, the market found support at 1.3512. This week, the market held above this low, and have been putting in higher highs and higher lows. Traders faded USD after the FOMC event risk and EUR/USD pushed to 1.36, before stalling. Price action has cleared above the moving averages, signaling a bullish reversal. The 1H RSI has been holding above 40, but the inability to push above 70 shows that the new bullish momentum is still weak.
Rising wedge scenario: If price fails to push above 1.36 and falls below 1.3560, and below the rising trendline seen in the 1H chart, there would be a break down of a rising wedge. This would signal a bearish continuation towards at least the 1.35 handle and 1.3476 low on the year.
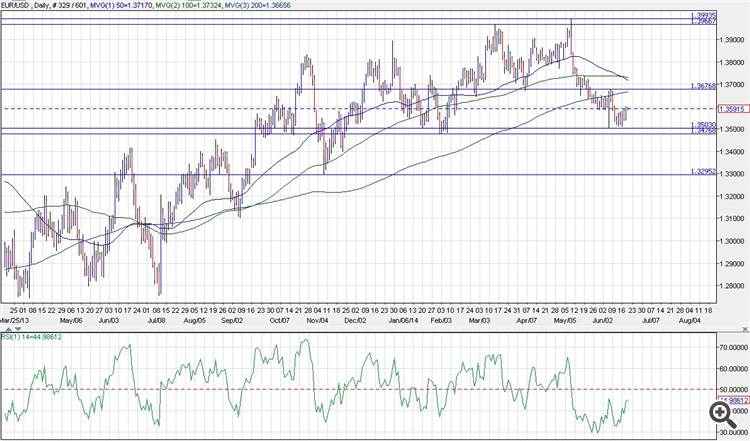
Note that a bullish divergence with the RSI has formed in the daily chart. With momentum building in the 1H chart, we can anticipate a bullish correction towards at least the 1.3676 pivot. A break above 1.37 at this point could revive the bullish outlook and open up the 2014 highs at 1.3966 and 1.3993.
However, if the rising wedge pattern scenario develops in the 1H chart, then we should look for 1.3476. Below 1.3476, look for Nov. 2013
AUD/USD edges higher after Fed statement (based on investing article)
The Australian dollar edged higher against its U.S. counterpart on Thursday, as demand for the greenback weakened after the Federal Reserve indicated that interest rates will remain low for a considerable time after the bank’s asset purchase program ends.
AUD/USD hit 0.9419 during late Asian trade, the pair's highest since June 13; the pair subsequently consolidated at 0.9423, adding 0.19%.
The pair was likely to find support at 0.9323, Wednesday's low and resistance at 0.9461, the high of April 10.
At the conclusion of its two-day meeting on Wednesday, the Fed cut its bond purchases by another $10 billion a month, to $35 billion, saying there was "sufficient underlying strength" in the U.S. economy to continue tapering.
Despite this, the Fed also lowered its forecast for growth this year to a range of 2.1% to 2.3% from 2.8 to 3.0% previously, due to "unexpected contractions" in the first quarter as a result of the unusually harsh winter. The central bank still acknowledged a broad improvement in the labor market.
The Fed said it expects the federal-funds rate, currently close to zero, to reach 1.2% by the end of next year and 2.5% by the end of 2016, a slightly faster rate of tightening than formerly expected.
The Aussie was higher against the New Zealand dollar, with AUD/NZD rising 0.26% to 1.0799.
Also Thursday, official data showed that New Zealand's gross domestic product rose by 1% in the first quarter, compared to expectations for an expansion of 1.2%. For the fourth quarter of 2013, New Zealand's GDP was revised up to an expansion of 1% from a previously estimated growth rate of 0.9%.
Later in the day, the U.S. was to publish the weekly report on initial jobless claims as well as a report on manufacturing activity in the Philadelphia region.
USD/CAD Awaiting Reversal Signal Near Range-Bottom (based on dailyfx article)
As noted in yesterday’s candlesticks report the June FOMC Meeting offered the potential for significant US Dollar volatility. The resulting price action has negated a Gravestone Doji on the daily for USD/CADwhich had suggested at a potential shift in sentiment for the pair. With bullish reversal signals now absent, doubt is cast over the possibility of a bounce. At the same time the range-bottom may offer some support to the Loonie and leave limited scope for further declines.
USD/CAD: Awaiting Bullish Signal Near Range-Bottom
An examination of the four hour chart similarly reveals a notable absence of bullish signals, despite the pair pushing on noteworthy support at 108.15.
US Dollar Bulls Gored by Dovish Yellen, EUR/USD Surges
There was sufficient evidence to believe that, even though US economic data has been slumping of recent, if the Federal Reserve came out with optimistic enough June economic projections, the US Dollar could rally. Instead of the running of the bulls starting a month early, Fed Chair Janet Yellen came out and gored US Dollar bulls.
While volatility came back to life momentarily - EURUSD traded in a 51-pip range in the 10-minutes following the release of the June projections and the policy statement - the tone for US Dollar weakness wasn't really set until Chair Yellen hammered home the idea that there was no technical mechanism in place to determine when interest rates would rise.
This is a significant dovish shift, irrespective of the slightly more optimistic Fed economic projections. Several months earlier, Chair Yellen suggested that the first rate hikes would come six months after QE3 ended; saying that there is no set timetable and that there is significant uncertainty around the path of economy walks back any clear horizon for a tighter Fed monetary policy.
The US Dollar has taken a significant beating in the hours since Chair Yellen's remarks, and has broken down through significant levels versus the British Pound and the Euro. Perhaps most interesting is USDJPY right now as it flirts with the 'BoJ trendline' from April 2013. See the video above for the technical outlooks, and click the link below for rationale on buying the British Pound.
USD/CAD: Is Bullish Bias Breaking Down?
While we remained above 1.08 my USD/CAD bias was for a resumption of the weekly bullish trend. However recent price action developments bring this into question and for a readjustment.
Stocks pushed to new highs in early trading Thursday as the so-called "Yellen bounce" continues after yesterday's Federal Reserve meeting.
The Dow Jones industrial average, the S&P 500 and the Nasdaq were all modestly higher in early trading, but they quickly returned to breakeven.The gains come after comments from Federal Reserve chair Janet Yellen gave stocks a boost Wednesday. The S&P 500 closed at a record high of 1,957 while the Dow Jones industrial average jumped almost 100 points to its fourth highest close in history. The Nasdaq finished at its highest level in 14 years.
Yellen bounce: Yellen said the Fed is optimistic about the future of the American economy, but it isn't planning to raise interest rates in 2014.
The outlook for continued easy monetary policy helped offset a number of simmering geopolitical concerns. Oil prices were down slightly even as Iraqi forces battle insurgents for control of the petrostate's main refinery.
But the gold market was sending a different signal. Gold futures gained $20.80, or 1.7%, to trade at $1,293 per ounce.
Stock movers -- American Apparel, Amazon, Blackberry: Meanwhile, shares in American Apparel (APP) rose after the company announced overnight that it fired its controversial CEO, though it didn't say why. Its shares, which topped $15 as recently as 2007, now trade for less than $1. Sources told the New York Post that the move could set the stage for American Apparel to be sold.
Amazon (AMZN, Tech30) shares edged higher after the online retailer unveiled the Fire Phone, a high-end, 3-D smartphone. It is the first smartphone Amazon has produced on its own.
Shares in Facebook (FB, Tech30) slipped 1% after an outage that prevented users posting to the social media site "for a brief period of time."
A number of companies are reporting results Thursday. BlackBerry (BBRY, Tech30) shares rallied 11% after the Canadian smartphone maker reported a smaller-than-expected loss.
Kroger (KR) shares jumped over 5% after the grocery store chain reported strong results and boosted its outlook. The stock hit an all-time high over $50.
Drug store chain Rite Aid (RAD) said net income fell in the latest quarter, sending its shares down slightly in early trading.
Markit IPO today: Markit, which provides information on bonds and derivatives for traders and is considered a rival of sorts to Bloomberg, said late Wednesday that it had raised $1.3 billion in an initial public offering. The stock, which was priced at $24 a share, will begin trading Thursday on the Nasdaq under the ticker MRKT.
Good day for Europe: European markets were all rising in midday trading, getting a boost from the Fed news. Spain's IBEX index gained more than 1%, making it one of the top performers in Europe. But that may be cold comfort for a nation in mourning. The Spanish national team was eliminated Wednesday from the World Cup after a surprisingly poor performance.
EUR/USD consolidates near a fresh high of 1.3643
EUR/USD consolidates near a fresh high of 1.3643, having stalled at the strong resistance level but maintaining the positive mood amid the general dollar weakness.
Key quotes
"Short term pullbacks found buyers in the 1.3610 level, now immediate short term support."
"The hourly chart shows indicators bouncing higher above their midlines, after correcting overbought readings, while 20 SMA extended its bullish slope and 100 one aims to cross 200 to the upside, all of which supports further gains."
"In the 4 hours chart technical readings present a mild bullish tone, with indicators advancing above their midlines albeit losing some of the upward strength."
"A price acceleration above mentioned high may lead to a test of 1.3680, Fibonacci resistance, while above it stops may get triggered and therefore result in a stronger upward move."
USD/CAD is trading at 1.0820, down -0.14% on the day, having posted a daily high at 1.0844 and low at 1.0806.
USD/CAD is pressing lower again through the consolidation and congestion in the 30 pip range from the handle. Looking ahead, Canada's CPI for May is released along with April retail sales. RBS strategists explained that after base effects helped boost headline inflation in April, they see the risks favouring a slightly weaker than consensus result in May. “Either way, the June statement indicated the Bank of Canada appears fully committed to looking through near-term inflation pressure amid a still tepid growth outlook. The sales impact of the late Easter may lead to a boost in April Canadian retail sales. While USD/CAD has tested the 2014 lows, short term interest rate support has moved in favour of the USD over the past few weeks. (see chart in attached pdf) The positive carry environment, and still negative CAD positioning, may keep the CAD supported but we are cautious on chasing CAD gains further from current levels, particularly as rate differentials have moved against it. We are neutral on at current levels, with a medium-term bias to sell CAD”.
USD/CAD Levels
With spot trading at 1.0820, we can see next resistance ahead at 1.0830 (Hourly 20 EMA), 1.0833 (Yesterday's Low), 1.0835 (Daily Open), (Monthly Low) and 1.0835 (Weekly Low). Support below can be found at 1.0814 (Weekly Classic S1), 1.0813 (Daily Classic S1), 1.0806 (Daily Low), 1.0790 (Daily Classic S2) and 1.0777 (Daily 200 SMA).
A parabolic move is a term that defines something that moves straight up. After the FOMC decision yesterday, XAUUSD has been on a bullish parabolic move.
XAUUSD, or Gold, has been on a steady downtrend since peaking out in late 2011. The corrections against the downtrend have been short-term in time and price relative to the downtrend. When looking at expiration of a correction or reversal of a trend, you often want to look for a break of a prior corrective high. XAUUSD has yet to do that, which brings up the potential for a resumption of a downtrend or another pattern worth discussing.
The near-term momentum currently favors Gold bulls. However, if a triangle is truly in play then there are three key levels you should be aware of to see if XAU is soon to turn around back down or break much higher. However, there are levels below that you should know as well.
Trading the News: Canada Consumer Price Index (based on dailyfx article)
Despite expectations of seeing a 0.6% rebound in Canada Retail Sales, the Consumer Price Index (CPI) may play a greater role in driving the USD/CAD as the Bank of Canada (BoC) retains a rather dovish tone for monetary policy.

What’s Expected:
Why Is This Event Important:
A further pickup in core price growth may encourage the BoC to adopt a more hawkish tone for monetary policy, and we may see Governor Stephen Poloz continue to talk down bets for a rate cut should the data print curb the threat for disinflation.
The pickup in wage growth paired with the ongoing recovery in private sector activity may limit the downside risk for inflation, and a strong CPI print may generate fresh monthly lows in the USD/CAD as market participants scale back bets of seeing lower borrowing costs in Canada.
However, firms may offer discounted prices amid the slowdown in economic activity along with the downturn in private sector spending, and a weaker-than-expected inflation print may spur a near-term correction in the USD/CAD as it raises the risk for a rate cut.
How To Trade This Event Risk
Bullish CAD Trade: Core Inflation Rises 1.5% or Greater
- Need red, five-minute candle following the CPI report to consider short USD/CAD entry
- If the market reaction favors a bullish Canadian dollar trade, establish short with two position
- Set stop at the near-by swing high/reasonable distance from cost; use at least 1:1 risk-to-reward
- Move stop to entry on remaining position once initial target is hit, set reasonable limit
Bearish CAD Trade: Canada Price Growth Disappoints- Need green, five-minute candle following the release to look at a long USD/CAD trade
- Carry out the same setup as the bullish loonie trade, just in the opposite direction
Potential Price Targets For The ReleaseUSD/CAD Daily
- Fails to Retain Series of Higher-Highs/Lows; Bearish RSI Break Favors Downside Target
- Interim Resistance: 1.1000 (1.618% expansion) to 1.1020 (23.6% retracement)
- Interim Support: 1.0710 (100.0% expansion) to 1.07309
Impact that the Canada CPI report has had on CAD during the last month(1 Hour post event )
(End of Day post event)
2014
April 2014 Canada Consumer Price Index (CPI)
USDCAD M5 : 24 pips price movement by CAD - CPI news event:
The headline reading for Canada inflation climbed an annualized 2.0% in April to mark the fastest pace of growth since April 2012, while the core Consumer Price Index (CPI) advanced 1.4% after expanding 1.3% the month prior. The uptick in price growth propped up the Canadian dollar, with the USD/CAD slipping back below the 1.0900 handle, and the dollar-loonie continued to trade lower throughout the day as the pair closed at 1.0864.