Continuous futures contracts in MetaTrader 5
Vladimir Karputov | 6 June, 2014
Introduction
Trader can't create his own charts in MetaTrader 5 as it can be constructed only with the broker's symbols. The trader requires a synthetic product – the continuous futures contract. The problem is that only a broker can make splicing of contracts and only the broker decides whether he will connect futures on the given symbol.
Fortunately, the history of the closed futures is always available in the terminal. Use this history to splice futures contracts in the terminal.
Conventions:
- All data, drawings and screenshots in the article are based on the real Ukrainian Stock index futures.
- Code sections replaced or added into the article will be marked with color. For example:
//+------------------------------------------------------------------+
//|                                               This is an example |
//|                                               of the edited code |
//+------------------------------------------------------------------+
The first problem: dates overlap
Nearby futures are traded with dates overlapping.
It means, that the futures is put on trading while another futures has still two months to be closed.

Fig. 1. Dates overlap in the futures contracts
The figure shows that 2013.09.16 is the start date of the UX-3.14 futures trading, although the UX-12.13 futures is still open.
The second problem: choosing the splicing way
There are two methods of splicing:
- The simple addition – when the date of circulation of the current instrument has expired and the next instrument is opened in another bar. During the simple addition the prices on the chart will match their history values, but at the same time there will always be price gaps in the spliced places, i.e. the chart will not be smooth.

Fig. 2. Splicing. Simple addition
- addition with shift: the current instrument has 5-10 days before it will be closed and we begin to replace these 5-10 bars with the next instrument bars. The 5-10 bars interval is called the transition period. During the addition with shift prices will show wrong values (they will not correspond to the current instrument) but in comparison to the simple addition method, the chart will be more smooth.

Fig. 3. Splicing. Addition with shift
Settings in the terminal
In the "Market watch" window futures should be placed in the descending order:

Fig. 4. Market watch
Writing an indicator
Default indicator should be placed in the terminal_data_folder\MQL5\Indicators folder. Create Synthetics folder in MyIndicators (which you open in the \Indicators). It allows you to save the space in the \Indicators folder in the Standard Library and facilitates MQL5 Storage launch synchronization of indicators. The final path of the folder looks like this: terminal_data_folder\MQL5\Indicators\MyIndicators\Synthetics.
In the Synthetics folder create a new file:

Fig. 5. The indicator new file creation
Set the new file type - "Custom indicator":

Fig. 6. The new file type - "Custom indicator"
Press "Next" and open the "General properties of the custom indicator" window. Enter the name of the indicator - "SYNT", add two options. The first option "Number of futures for splicing" determines the number of the instruments to be connected. Note, that 2 is the minimum possible value of the "Number of futures for splicing". The second option "Gluing type" determines the splicing type in the default indicator - "simple addition":

Fig. 7. The custom indicator parameters
Pay attention to the "Gluing type" option: the splicing can be "simple addition" or "addition with shift". At this stage you can't add the list of these two splicing types. That is why leave the default "simple addition". During the "SYNT" indicator code writing switch on the Later option to see the dropdown list with the splicing types.
In the next window select the indicator event handlers:

Fig. 8. The indicator event handlers
Note, that the OnTimer() function will be used in the "SYNT" indicator. The main functionality of the indicator is set in the OnTimer() . The indicator can be attached both to the symbol chart with the finished trade (this symbol will not include OnCalculate events), and to the symbol chart with an active trade.
Press "Next" and in the "General properties of the Custom indicator program" tick "Indicator in separate window":

Fig. 9. "Indicator in separate window" option
Press the "Done" button and you will see the "SYNT" indicator template.
Organizing the dropdown list
In order to see the splicing types list as the dropdown list you need to declare the ENUM_GLUING_TYPE enumeration in the indicator options.
Declare enumeration in the global area at the beginning of the input parameters block:
#property indicator_separate_window
//+------------------------------------------------------------------+
//|  Splicing types enumeration                                      |
//+------------------------------------------------------------------+
enum ENUM_GLUING_TYPE
  {
   simple_addition,        // simple addition||simple addition
   addition_with_shift     // addition with shift||addition with shift
  };
//--- input parameters || input parameters
input ENUM_GLUING_TYPE  gluing_type=simple_addition;
//+------------------------------------------------------------------+
//| Custom indicator initialization function                         |
//+------------------------------------------------------------------+
Now you can check how the dropdown list is displayed.
You should compile the indicator (F7) file. Now, after you have attached the indicator, you can see in the options that the dropdown list launches:

Fig. 10. Now you have the
dropdown list in the parameters
Add the description of the indicator which will be displayed in the "General" tab when it will be attached to the chart the first time or when its properties will be changed:
#property version   "1.00"
//+------------------------------------------------------------------+
//| version   "1.00": The timer history swapping                     |
//+------------------------------------------------------------------+
#property description "Indicator for several futures splicing."
#property description "Is drawn in the latest futures window"
#property description "Uses N first symbols for drawing"
#property description "which were taken from the \"Market review\"."

#property indicator_separate_window
The indicator construction method - DRAW_COLOR_CANDLES - colored candles.
You need 4 indicator buffers and 1 buffer for the color index store. The style of the line, indicator - STYLE_SOLID - continuous line. Display everything in the indicator code:
#property description "taken from the \"Market review\"."

//--- indicator settings || indicator settings
#property indicator_separate_window
#property indicator_buffers 5
#property indicator_plots   1
//--- plot Bars || bars plotting
#property indicator_label1    "SYNT"
#property indicator_type1     DRAW_COLOR_CANDLES
#property indicator_style1    STYLE_SOLID
#property indicator_width1    1
//+------------------------------------------------------------------+
//|  enumeration of splicing methods                                 |
//+------------------------------------------------------------------+
Enter the "number_futures_gluing" input parameter - number of instruments required for construction. The default "number_futures_gluing" value equals 2:
//--- input parameters || input parameters
input int               numder_futures_gluing=2;
input ENUM_GLUING_TYPE  gluing_type=simple_addition;
Declare 4 indicator buffers, 1 buffer for the color index storing and the LoadHistory[] auxiliary array:
#property indicator_style1    STYLE_SOLID
#property indicator_width1    1
//--- indicator buffers || indicator buffers
double            OpenBuffer[];
double            HighBuffer[];
double            LowBuffer[];
double            CloseBuffer[];
double            ColorCandlesColors[];
double            LoadHistory[];
//+------------------------------------------------------------------+
//|  enumeration of splicing methods                                 |
//+------------------------------------------------------------------+
Attach indicator buffers to the one-dimension dynamic arrays, set buffers indexing as in timeseries:
//--- indicator buffers mapping
//--- indicator buffers mapping
   SetIndexBuffer(0,OpenBuffer,INDICATOR_DATA);
   SetIndexBuffer(1,HighBuffer,INDICATOR_DATA);
   SetIndexBuffer(2,LowBuffer,INDICATOR_DATA);
   SetIndexBuffer(3,CloseBuffer,INDICATOR_DATA);
   SetIndexBuffer(4,ColorCandlesColors,INDICATOR_COLOR_INDEX);
   SetIndexBuffer(5,LoadHistory,INDICATOR_CALCULATIONS);
//--- set buffer indexing as timeseries
//--- set buffer indexing as in timeseries
   ArraySetAsSeries(OpenBuffer,true);
   ArraySetAsSeries(HighBuffer,true);
   ArraySetAsSeries(LowBuffer,true);
   ArraySetAsSeries(CloseBuffer,true);
   ArraySetAsSeries(ColorCandlesColors,true);
//---
   return(INIT_SUCCEEDED);
To display the name of the indicator series ("Open", "High", "Low" and "Close") in the "Data window" you need the s_symbol variable:
input int               numder_futures_gluing=2;
input ENUM_GLUING_TYPE  gluing_type=simple_addition;
//--- symbol name
string s_symbol;
//+------------------------------------------------------------------+
//| Custom indicator initialization function                         |
//+------------------------------------------------------------------+
To activate the indicator you need the shft_array variable and two good_history and indicator_rendered flags:
input ENUM_GLUING_TYPE  gluing_type=simple_addition;
//--- symbol name
string   s_symbol;
int      shift_array=0;
bool     good_history=false;        //history is not prepared||history not prepared
bool     indicator_rendered=false;  // indicator is not drawn
//+------------------------------------------------------------------+
//| Custom indicator initialization function                         |
//+------------------------------------------------------------------+
Then set up the indicator and connect the buffer color index to the chosen color:
   ArraySetAsSeries(CloseBuffer,true);
   ArraySetAsSeries(ColorCandlesColors,true);
//--- set accuracy || accuracy of the indicator values
   IndicatorSetInteger(INDICATOR_DIGITS,0);
//--- set drawing line empty value || empty value of the drawing line
   PlotIndexSetDouble(0,PLOT_EMPTY_VALUE,0.0);
//--- set labels for the line || displayed name in the DataWindow
   PlotIndexSetString(0,PLOT_LABEL,s_symbol+" Open;"+s_symbol+" High;"+s_symbol+" Low;"+s_symbol+" Close");
   IndicatorSetString(INDICATOR_SHORTNAME,"SYNT");
//--- set number of colors in color buffer || number of colors in the buffer
   PlotIndexSetInteger(0,PLOT_COLOR_INDEXES,9);
//--- set line color || set the line color
   PlotIndexSetInteger(0,PLOT_LINE_COLOR,0,clrBlue);
   PlotIndexSetInteger(0,PLOT_LINE_COLOR,1,clrOrange);
   PlotIndexSetInteger(0,PLOT_LINE_COLOR,2,clrRed);
   PlotIndexSetInteger(0,PLOT_LINE_COLOR,3,clrGreen);
   PlotIndexSetInteger(0,PLOT_LINE_COLOR,4,clrPink);
   PlotIndexSetInteger(0,PLOT_LINE_COLOR,5,clrIndigo);
   PlotIndexSetInteger(0,PLOT_LINE_COLOR,6,clrPaleVioletRed);
   PlotIndexSetInteger(0,PLOT_LINE_COLOR,7,clrDarkViolet);
   PlotIndexSetInteger(0,PLOT_LINE_COLOR,8,clrDimGray);
//---
   return(INIT_SUCCEEDED);
Add the initialization of the timer with 3 seconds interval and the random number generator into the OnInit() function:
   PlotIndexSetInteger(0,PLOT_LINE_COLOR,7,clrDarkViolet);
   PlotIndexSetInteger(0,PLOT_LINE_COLOR,8,clrDimGray);
//---
   EventSetTimer(3);
//--- random number generator initializor
   MathSrand(GetTickCount());
//---
   return(INIT_SUCCEEDED);
It is required at least two symbols to process the splicing.
Check the number of instruments for splicing in the OnCalculate() function:
                const long &tick_volume[],
                const long &volume[],
                const int &spread[])
  {
//--- checking the number of instruments || checking the number of instruments
   if(numder_futures_gluing<=1)
     {
      //--- create the message line
      string comm=StringFormat("For the indicator choose not less than %d symbols",numder_futures_gluing);
      //--- display the message in comment in the chart main window
      Comment(comm);
      return(0);
     }
//--- return value of prev_calculated for next call
   return(rates_total);
After you have checked the number of symbols for splicing you check whether the indicator has been already drawn. If the indicator is drawn, then you can quit the OnCalculate() :
      Comment(comm);
      return(0);
     }
   if(indicator_rendered==true) return(rates_total);
//--- return value of prev_calculated for next call
   return(rates_total);
As the "SYNT" indicator is mainly used to analyze the day bars development tendency, I consider, that there is no need to proceed recalculations in each tick. There will not be calculations of the "SYNT" indicator on each tick.
Moreover, you need to calculate the indicator only in the following cases:
- if the indicator was launched the first time;
- if the history was changed (for example, there were additions).
   if(indicator_rendered==true) return(rates_total);
//--- if calculations were started the first time
//--- or if we need to calculate the indicator for two or more bars (changes in history)
//--- remember, that the "0" bar - is the left-most
   if(prev_calculated==0 || rates_total>prev_calculated+1)
     {
     }
//--- return value of prev_calculated for next call
   return(rates_total);
Forced indicator buffers initialization
The indicator "SYNT" buffers are connected dynamic arrays.
When the indicator is launched the first time, buffers are initialized forcibly. Proceed with the initialization in the OnCalculate(). Why do you need to conduct it in the OnCalculate(), not in the OnInit? The explanation is in the figure below:
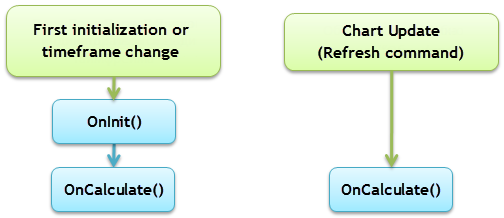
Fig. 11. The array initialization in the OnCalculate()
As you can see in the Fig.11, the OnCalculate() event will occur in any case, whereas the OnInit() is enabled when you launch the chart updating through the "Update" command. Therefore, the arrays initialization will be conducted in the OnCalculate():
//--- remember, that the "0" bar - is the left-most
   if(prev_calculated==0 || rates_total>prev_calculated+1)
     {
      //--- arrays initialization
      ArrayInitialize(OpenBuffer,0);
      ArrayInitialize(HighBuffer,0);
      ArrayInitialize(LowBuffer,0);
      ArrayInitialize(CloseBuffer,0);
     }
//--- return value of prev_calculated for next call
   return(rates_total);
The ArrayInitialize() function initializes the indicator buffer. In this case the initialization shows zeros.
If you try to initialize the buffer indicator by the EMPTY_VALUE , you will not be able to splice indicators on the "SYNT".
Algorithm of Simple addition

Fig. 12. Algorithm of Simple addition
Dates in the picture are the start and end dates of UX-9.13, UX-12.13 and UX-3.14 futures circulation. These data are presented in the table:
| Symbol | Circulation starts | Circulations finishes |
|---|---|---|
| UX-9.13 | 2013.03.15 | 2013.09.16 |
| UX-12.13 | 2013.06.17 | 2013.12.16 |
| UX-3.14 | 2013.09.16 | 2014.03.17 |
In the Fig. 10 2013.12.25 date - is a real calendar date. The UX-3.14 symbol is still valid.
"Simple addition" splicing method will be implemented in the SimpleAddition function:
//+------------------------------------------------------------------+
//| Timer function                                                   |
//+------------------------------------------------------------------+
void OnTimer()
  {
//---
  }
//+------------------------------------------------------------------+
//| Simple addition                                                  |
//| Simple addition. Add in the indicator array                      |
//| sibmUP symbol                                                    |
//+------------------------------------------------------------------+
bool SimpleAddition(string simbUP,string simbDOWN,ENUM_TIMEFRAMES period,int Color)
  {
  }
//+------------------------------------------------------------------+
simbUP is the up futures, simbDOWN is the down futures, both of them are located in the "Market review" window. Color - color used to draw futures.
The full code of the SimpleAddition() function is given below:
//+------------------------------------------------------------------+
//| Simple addition                                                  |
//| Simple addition. Add in the indicator array                      |
//| sibmUP symbol                                                    |
//+------------------------------------------------------------------+
bool SimpleAddition(string simbUP,string simbDOWN,ENUM_TIMEFRAMES period,int Color)//////
  {
   datetime expiration_time_UP;     // simbUP symbol expiration date
   datetime expiration_time_DOWN;   // simbDOWN expiration date

   expiration_time_UP=int(SymbolInfoInteger(simbUP,SYMBOL_EXPIRATION_TIME));
   if(expiration_time_UP>TimeLocal())
     {
      expiration_time_UP=TimeLocal();
     }
   if(simbDOWN!="")
     {
      expiration_time_DOWN=int(SymbolInfoInteger(simbDOWN,SYMBOL_EXPIRATION_TIME));
     }
   else
     {
      expiration_time_DOWN=int(SymbolInfoInteger(simbUP,SYMBOL_START_TIME));
     }
//--- Open, High, Low and Close prices will be copied in the rates[] array
   MqlRates rates[];
   ArraySetAsSeries(rates,true);
   int copied=0;           //--- copied number
   copied=CopyRates(simbUP,period,expiration_time_DOWN,expiration_time_UP,rates);
   if(copied>0)
     {
      for(int j=shift_array;j<shift_array+copied;j++)
        {
         //--- write prices in buffers
         OpenBuffer[j]=rates[j-shift_array].open;
         HighBuffer[j]=rates[j-shift_array].high;
         LowBuffer[j]=rates[j-shift_array].low;
         CloseBuffer[j]=rates[j-shift_array].close;
         ColorCandlesColors[j]=Color;
        }
      shift_array=shift_array+copied;
      indicator_rendered=true;
      ChartRedraw();
     }
   else
     {
      Print("Unable to get the symbol history data",simbUP);
      indicator_rendered=false;
      return(false);
     }
//---  Simple addition end
   return(true);
  }
//+------------------------------------------------------------------+
Addition with shift algorithm

Fig. 13. Addition with shift splicing algorithm
Splicing in this algorithm, compared to the simple addition, begins 10 days before the symbol is closed. The "Addition with shift" splicing method is processed in the AdditionWithShift() function:
//--- Simple addition end
   return(true);
  }
//+------------------------------------------------------------------+
//| Addition With Shift                                              |
//| Addition with Shift. Add in the indicator array only             |
//| sibmUP symbol                                                    |
//+------------------------------------------------------------------+
bool AdditionWithShift(string simbUP,string simbDOWN,ENUM_TIMEFRAMES period,int Color)
  {
//---
   return(true);
  }
//+------------------------------------------------------------------+
The difference between the AdditionWithShift() and the SimpleAddition() functions is in two lines - you subtract 10 days from dates:
   .
   .
   .
   expiration_time_UP=int(SymbolInfoInteger(simbUP,SYMBOL_EXPIRATION_TIME))-86400*10;
   .
   .
   .
   expiration_time_DOWN=int(SymbolInfoInteger(simbDOWN,SYMBOL_EXPIRATION_TIME))-86400*10;
   .
   .
   .
Due to small difference in codes, I will not show the complete code of the AdditionWithShift() function, you can find the code in the indicator file of the article.
Despite such small difference between the AdditionWithShift() and SimpleAddition() functions, it is better if you don't splice them to make one universal function (in case of further changes in the algorithm or, for example, launches of testings).
Symbols history preloading
The CheckLoadHistory() function copies all symbol history into the auxiliary buffer tmp_rates.
If the copying process is successful the true value is assigned to the good_history flag, which means you can start drawing the indicator:
//--- Addition With Shift end
   return(true);
  }
//+------------------------------------------------------------------+
//| Request to receive all history from a trade server               |
//| Request to recieve all history from a trade server               |
//+------------------------------------------------------------------+
bool CheckLoadHistory(string symbol,ENUM_TIMEFRAMES period)
  {
   MqlRates tmp_rates[];      // the Open, High, Low and Close prices will be copied in the rates[]array
   datetime start_time;       // start time of the instrument trades
   datetime expiration_time;  // expiration time of the instrument trade
   start_time=int(SymbolInfoInteger(symbol,SYMBOL_START_TIME));
   expiration_time=int(SymbolInfoInteger(symbol,SYMBOL_EXPIRATION_TIME));
   if(CopyRates(symbol,period,start_time,expiration_time,tmp_rates)>0)
     {
      good_history=true;
     }
   else
     {
      good_history=false;
     }
//---
   return(true);
  }
//+------------------------------------------------------------------+
You can copy all symbol history as futures life is very short and all history copying will not take much space.
OnTimer - the main function of the indicator
Now you have the code for two splicing methods and the code for the history load, so you can change the OnTimer() function:
//+------------------------------------------------------------------+
//| Timer function                                                   |
//+------------------------------------------------------------------+
void OnTimer()
  {
   if(indicator_rendered==true) return;
   if(good_history==true)
     {
      int t=0;       // color || color
      int number;
      switch(gluing_type)
        {
         case simple_addition:
            for(int n=0;n<numder_futures_gluing;n++)
              {
               //--- get the random number
               number=MathRand();
               //--- get the color index as the modulo
               t=number%(PlotIndexGetInteger(0,PLOT_COLOR_INDEXES)-1);
               SimpleAddition(SymbolName(n,true),SymbolName(n+1,true),PERIOD_D1,t);
              }
            break;
         case addition_with_shift:
            for(int n=0;n<numder_futures_gluing;n++)
              {
               //--- get random number
               number=MathRand();
               //--- get the color index as the modulo
               t=number%(PlotIndexGetInteger(0,PLOT_COLOR_INDEXES)-1);
               AdditionWithShift(SymbolName(n,true),SymbolName(n+1,true),PERIOD_D1,t);
              }
            break;
        }
     }
   else
     {
      for(int n=0;n<numder_futures_gluing;n++)
        {
         CheckLoadHistory(SymbolName(n,true),PERIOD_D1);
        }
     }
  }
//+------------------------------------------------------------------+
The indicator is constructed. You can compile it and attach to the chart. It is better to choose the closed trade symbol and set the H1 period.
Initial output of the "SYNT" indicator
After you have attached the two "SYNT" indicator templates of different splicing methods to the chart, you can compare these methods:
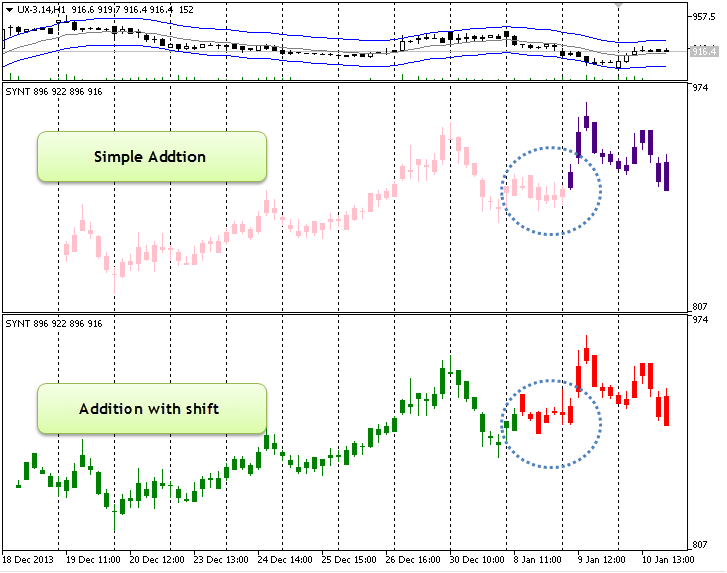
Fig. 14. Two methods of futures splicing comparison
The possibility to splice indicators (standard and custom)
Custom indicators can be spliced with the OnCalculate first call and the "SYNT" indicator:
int OnCalculate (const int rates_total,      // size of the array price[]
                 const int prev_calculated,  // calculated bars during the previous call
                 const int begin,            // tangible data starting point
                 const double& price[]       // calculation array
   );
In the "Navigator" window open the list "Custom's indicators". Then open the list "Examples", choose the indicator and place it into "SYNT". In the "Parameters" tab choose "Previous indicator data" in the dropdown list.
Here is the list with indicators which you can splice on the "SYNT" indicator, they launch on the "SYNT" without mistakes:
- AMA (Adaptive Moving Average);
- BB (Bollinger Bands);
- Custom Moving Average;
- DEMA (Double Exponential Moving Average);
- FrAMA (Fractal Adaptive Moving Average);
- TEMA (Triple Exponential Moving Average).
The indicator "SYNT" which spliced three futures with the attached Custom Moving Average indicator:

Fig. 15. An example of three spliced symbols
Conclusion
It is easier to analyze the behaviour of older chart symbols opened within day timeframes. Although the number of the technical indicators is restricted, this method helps to trace the price behaviour on continuous futures.