Developing a cross-platform grid EA: testing a multi-currency EA
Roman Klymenko | 28 July, 2020
Introduction
This article is a kind of postscript for a series of articles devoted to grid Expert Advisors:
- Developing a cross-platform grid EA
- Developing a cross-platform grid EA (part II): Range-based grid in trend direction
- Developing a cross-platform grid EA (part III): Correction-based grid with martingale
- Developing a cross-platform grid EA (Last part): Diversification as a way to increase profitability
We will not create or improve Expert Advisors in this article. Our multi-currency EA has already been created. Its new version will be attached below, along with testing reports and the SET file that was used for testing.
The main purpose of the article is to test the averaging and martingale-based EA in the market, for which it has not been initially intended. Can an Expert Advisor trading only long positions survive the S&P 500 drop from USD 3400 to USD 2200? Thus, the drop was more than 30 percent.
Basic rules of the trading system
The trading system implemented in the Expert Advisor consists of the following rules.
Market. The EA trades only the US exchange stocks. The broker provides access to a few dozens of the most popular stocks. Stocks to test the multi-currency EA will be selected from the available set.
Entry direction. All positions are only opened in the Long direction.
The selection of this direction is obvious if you look at long-term price charts of most of the stocks. Especially, if you analyze a period from 2010 to early 2020. For example, take a look at the weekly chart for Microsoft stock:
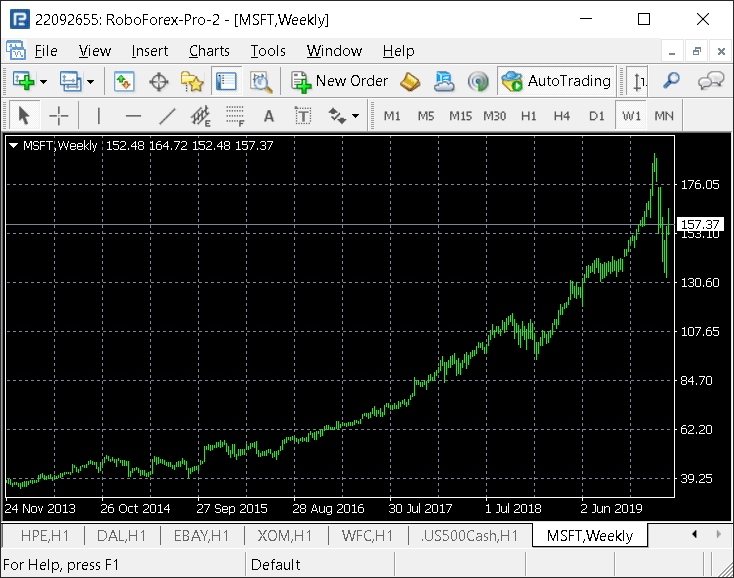
Stocks were steadily rising before the market drop.
Entry point. The position will be opened based on the value of the RSI indicator. Readings will be interpreted in different ways depending on the asset. On some of the assets, entry will be performed when RSI falls below 30. On other assets we will enter when RSI rises above 70. Thus, it depends purely on the asset.
The number of averaging steps. It is extremely dangerous to use averaging with an unlimited number of steps. If the asset price moves in one direction for a long time, your losses will increase with every new positions explosively.
Therefore, the grid length for each symbol will be limited to four open positions (steps).
I.e. if a grid for a certain symbols consists of a maximum of 3 steps and the symbol price reaches a level where step 4 should be opened, the system will close all existing positions at this level instead of opening the fourth one. This provides the use of stop losses in the averaging algorithm.
Averaging method. An existing position can be averaged (by opening an additional position at a lower price) using a fixed lot or increasing the lot for each newly opened position.
If lot is increased using a martingale method, then loss in case of Stop Loss would be much higher than the profit received from Take Profit. That is why using martingale can be psychologically difficult. When you see that with a Stop Loss you lost the entire profit that the Expert Advisor had earned for the last two weeks, this can be frustrating. So better not to have Stop Losses at all.
Let us start with the selection of instruments which show good results in fixed-lot averaging.
If we need to use martingale, lot will increase not exponentially, but it will increase by the initial lot value at each new step.
The below table shows calculations for different averaging types.
| Averaging Type | Number of Chain Steps | Losses at Stop Loss |
|---|---|---|
| Fixed | 2 | 3 |
| Fixed | 3 | 6 |
| Fixed | 4 | 10 |
| Increase by initial lot value | 2 | 4 |
| Increase by initial lot value | 3 | 10 |
| Increase by initial lot value | 4 | 20 |
Losses in case of Stop Loss at the appropriate step are specified in the number of steps. That is, if the step size is 7 points, then the losses with a fixed averaging at step 4 will equal to 10*7 = 70 points.
Thus, if the lot size is increased by the initial lot size, the chain cannot be longer than three steps. This is because losses at step 4 would be too large.
Grid size and Take Profit size. Both the grid size (distance in points between two open positions) and the Take Profit size will be selected based on optimization. To limit losses in case of Stop Loss, the parameters will be set so that the loss can be equal to 1-3 profits from Take Profit.
Trading and testing period. As can be seen from most stock charts, price is steadily growing over a long period of time. But the key word here is "long period". This trading system is designed for a period of no less than one year. The optimal period is 4 years. If you decide to use this trading system, I recommend considering the four-year period.
Testing and optimization were also performed on the 4-year period, From January 2016 to January 2020. The found set of trading instruments will be additionally tested in the period up to April 2020, which is the period when stock markets dropped.
Trading lot. Testing and optimization will be performed with a fixed lot. Individual lot size will be used for each of the symbols.
The resulting multi-currency EA will be additionally tested with a gradually increasing trading lot. In this case, if the balance doubles the lot will also double. This increment will be repeated until the working lot reaches the value equal to 25 initial lots.
Lot is increased via input parameters. These parameters are used for specifying the deposit size, upon reaching which the working lot should be increased (see the Figure below).
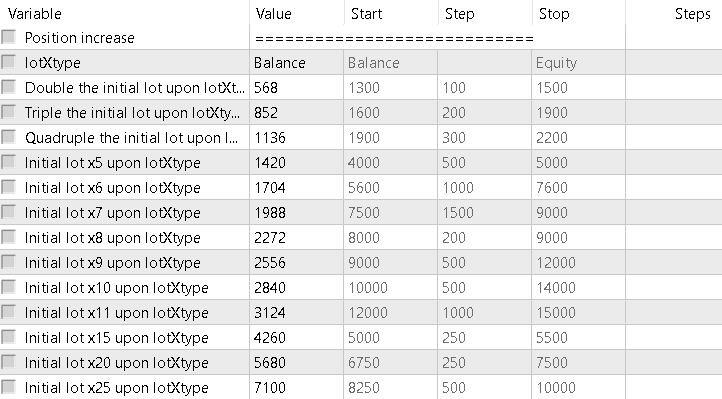
Conclusion. These are all the rules according to which our trading system operates. Let us test the system profitability on single instruments.
Optimization parameters on individual instruments
I will not provide the details of each individual optimization because the idea of the article is different.
Optimizations were performed in mode Every tick based on real ticks.
Optimization results were sorted by the Recovery Factor. If a test pass showed profit, the recovery factor value is returned. If a pass is losing, a percent by which the account balance has decreased (with a negative sign) is shown instead of the Recovery Factor. If the EA executed less than 30 trades during testing, 0 is returned because it is a very small number of trades which is insufficient for obtaining objective statistics.This sorting method is not available among standard options. It is implemented in the Expert Advisor. To use it, open the Settings tab in the Strategy Tester and selected Custom max (see the Figure below).

Also, forward tests were used during single symbol optimization and testing. The optimal forward period for our 4-year interval is 1/4. It means that the first three years are used for backtests, and the last year is used for a forward test.
Symbols selected for the multi-currency Expert Advisor
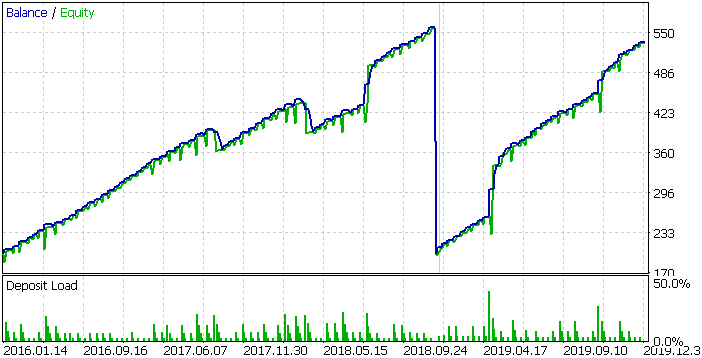
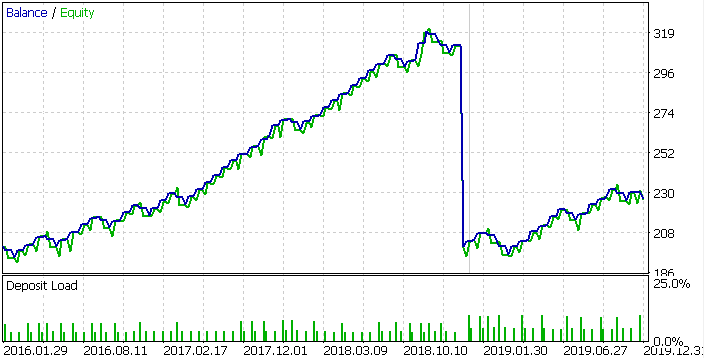
Now, let us consider testing results. Here are the balance charts of the instruments which have been eventually included in our multi-currency Expert Advisor. There will be 11 such instruments. Firstly, the EA is not designed for trading more instruments. Secondly, it is very difficult to pick up symbols positions for which would be uncorrelated.
AAPL:
BRK.B:
PEP:
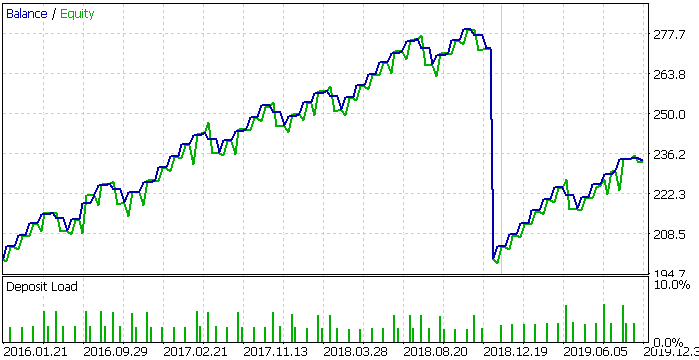
WMT:
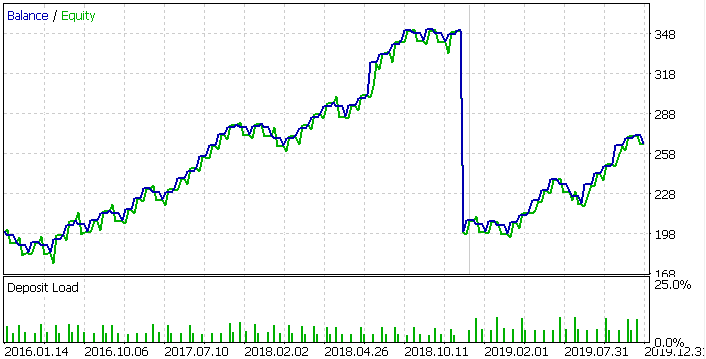
CVX:
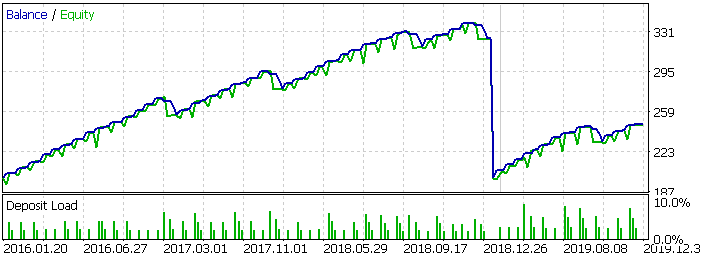
EBAY:
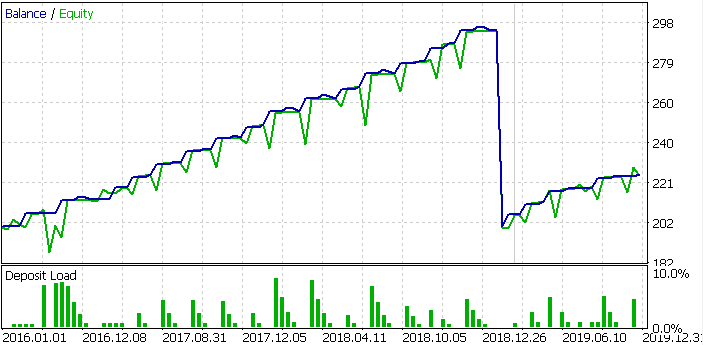
MSFT:
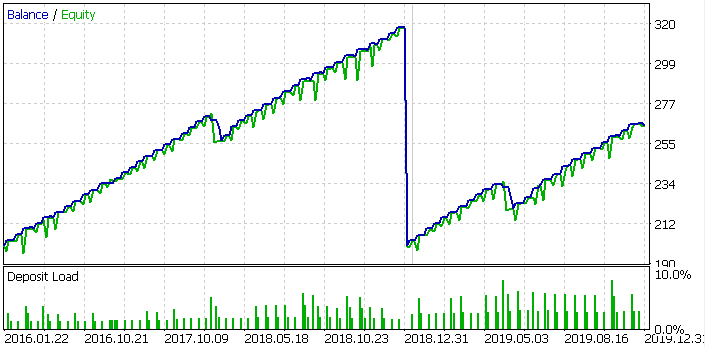
DIS:
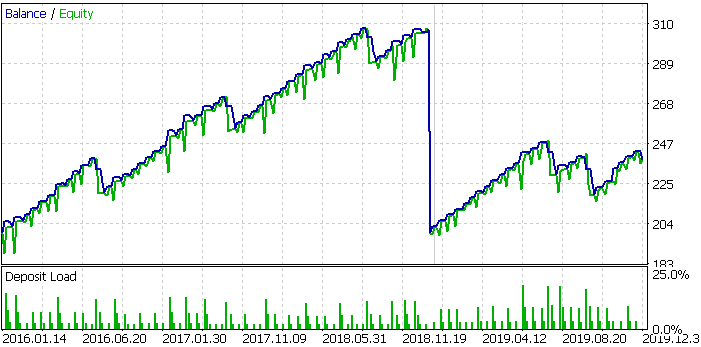
JPM:
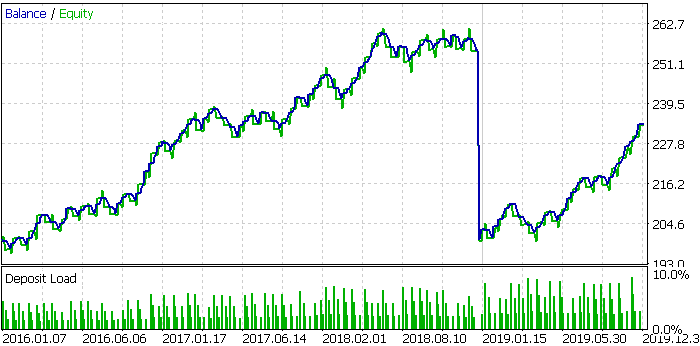
JNJ:
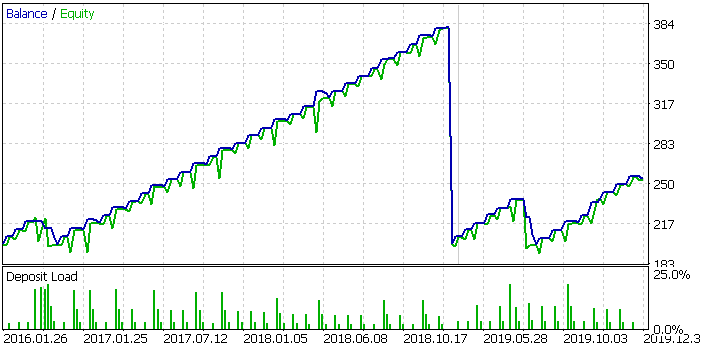
S&P500:
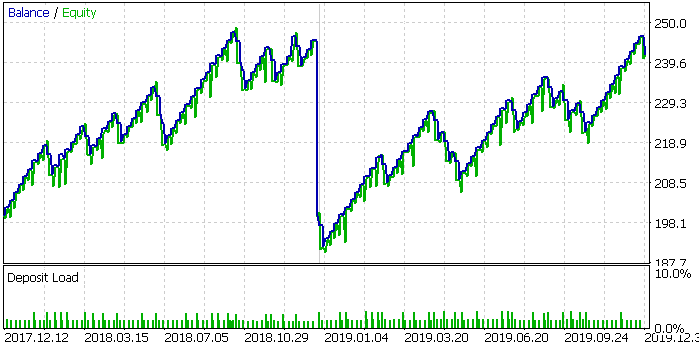
A big drop closer to chart end is not actually a drop. This place shows the end of backtesting and the beginning of a forward one. This is because a forward test start with the initial deposit amount, and not with the backtest balance.
Here is a table with the testing results of the selected trading instruments:
| Symbol | Recovery Factor (back/forward) | Profit Factor (back/forward) | Max drawdown (back/forward) | Trades (back/forward) |
|---|---|---|---|---|
| AAPL | 7.25 / 11.04 | 3.93 / 37.99 | 49.41 / 30.36 | 134 / 58 |
| BRK.B | 7.41 / 1.79 | 3.11 / 2.01 | 15.06 / 14.96 | 70 / 29 |
| PEP | 5.2 / 3.26 | 2.49 / 5.42 | 13.96 / 10.42 | 55 / 15 |
| WMT | 5.9 / 3.19 | 2.51 / 2.56 | 25.52 / 20.7 | 67 / 25 |
| CVX | 6.51 / 3.25 | 3.03 / 4.26 | 19.17 / 14.82 | 78 / 24 |
| EBAY | 4.57 / 1.95 | 8.87 / 8.85 | 20.7 / 12.96 | 43 / 12 |
| MSFT | 7.41 / 3.13 | 6.69 / 5.26 | 16 / 20.93 | 72 / 44 |
| DIS | 3.97 / 1.19 | 2.32 / 1.84 | 26.97 / 32.02 | 101 / 49 |
| JPM | 4.34 / 3.07 | 1.75 / 2.81 | 12.69 / 10.86 | 164 / 54 |
| JNJ | 6.24 / 1.23 | 5.66 / 2.31 | 28.94 / 44.36 | 68 / 29 |
| S&P500 | 2.55 / 1.98 | 1.65 / 1.57 | 17.81 / 21.18 | 85 / 91 |
All Strategy Tester reports are attached below, at the end of this article.
It is believed that forward testing allows obtaining more accurate results and also allows avoiding over-optimization. I do not agree with this point of view. Nevertheless, I also used this type of testing when optimizing.
In my opinion, there is one advantage of a forward test. It allows testing an EA using two different starting points. This allows you to save time.
As for the rest, interpreting of results can be more complicated with forward testing.
For example, you cannot receive the total recovery factor over the entire testing period by simply adding results from back and forward tests. This is because maximum drawdown is usually different in these periods. But we need this common maximum drawdown in order to determine the initial deal volume or the minimum deposit. Thus, we have to use the highest darwdown value as the maximum value for the entire period. In this case, the recovery factor calculated in the period with a lower drawdown will not be accurate.
Moreover, if you can view the balance chart, you will not over-optimize the Expert Advisor event without a forward test. If the balance chart is steadily growing throughout the entire testing period, it means that you have selected suitable parameters. If the main growth was registered at the beginning of the balance graph, while the funds level stands still or falls in the right part of the graph, the parameters are unsuitable.
Multi-currency EA testing before market drop
What will be the effect of combining the selected trading instruments into one Expert Advisor? Will the results be better than those when trading each symbol separately? Here is the balance graph and testing results when trading a fixed lot:
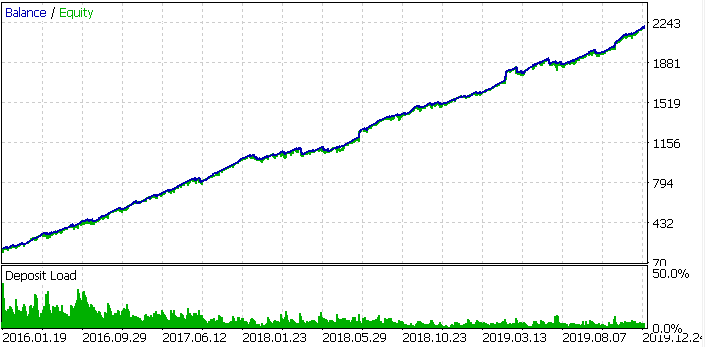
Even with the naked eye, you see how much the balance graph has smoothed out compared to single instrument trading. Let us additionally check the table with testing results.
| Recovery Factor | Profit factor | Net profit | Max drawdown | Trades |
|---|---|---|---|---|
| 20.56 | 2.94 | 1 992 | 96.91 | 1 308 |
The effect of the diversification is also demonstrated in this table.
The initial deposit was USD 200. After four years, we have USD 1,992. It means that the profit for four years is almost 900 percent when trading the fixed lot.
This seems to be a very good result. However, things are a little worse in reality. first, the initial deposit of USD 200 is too small.
The maximum drawdown was USD 97. But this does not mean that a deposit of USD 97 would be enough to trade this system. You also need to take into account the margin size reserved to maintain open positions.
After testing, the EA adds information about the maximum drawdown registered during testing, in the Journal tab. In our case, the maximum drawdown was USD 190. It means that comfortable trading requires having at least USD 97 + USD 190 = USD 280. Let's round up to USD 300. This means that the profit for 4 years is almost 600 percent.
This profit was achieved form fixed-lot trading. What if we increase lot each time the balance grows by the initial deposit value? The Expert Advisor allows increasing the initial lot by a maximum of 25 times. I think this limitation is pretty enough for our tests:
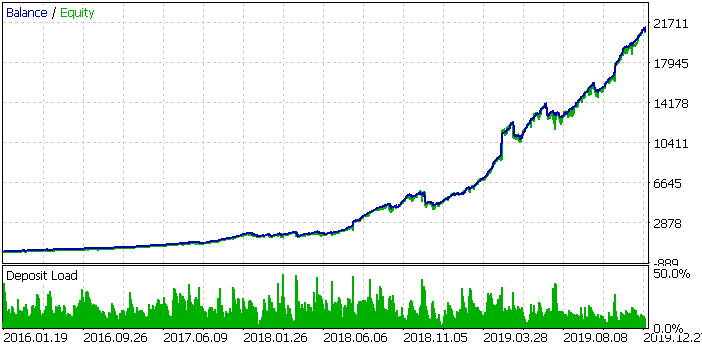
This time the graph is not so smooth. But the final profit is impressive! Deposit increased from USD 200 (or the required USD 300) to USD 20,701. This equals to almost 7,000 % for 4 years!
In this case, the EA started using the maximum lot with a deposit of USD 7,100. It means that the working lot could further be increased if we did not use the limitation.
Multi-currency EA testing including the market drop period
The results were very good. But how would the EA behave during the recent market drop?
This part concerns the main topic of our article. The next testing period is from 2016.01.01 to 2020.04.01.
Multi-currency EA testing results with the same settings, trading the fixed lot:
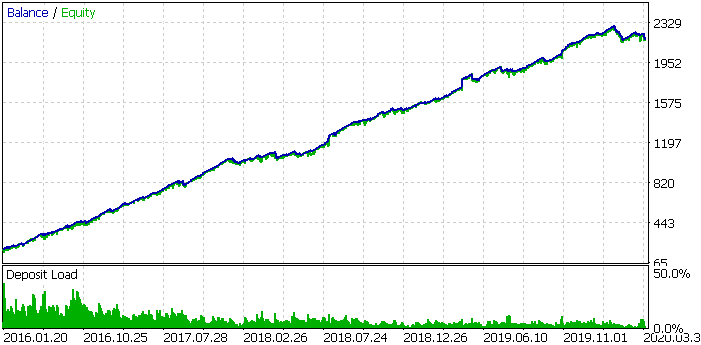
At first glance, the drop is almost imperceptible. Let us now take a look at testing results:
| Recovery Factor | Profit factor | Net profit | Max drawdown | Trades |
|---|---|---|---|---|
| 13.91 | 2.54 | 1 971 | 141.69 | 1 400 |
Now you see the difference. The recovery factor decreased by 7. The maximum drawdown increased by 1.5 times. Profit remained practically unchanged. We actually lost what we had earned from January till the end of February. This is more than a 30% drop.
Let us now take a look at testing results using the lot size that gradually increases up to 25 time:
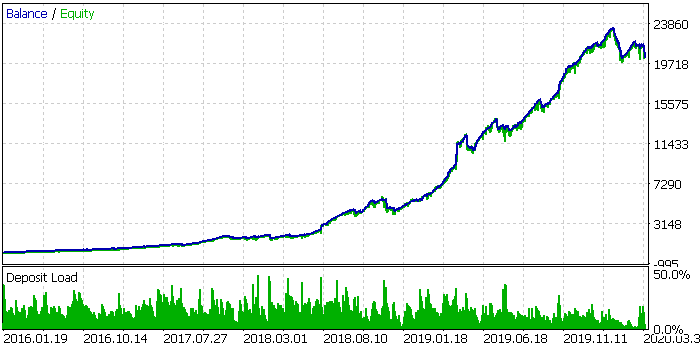
Even in this case the fall is not so significant. The profit is USD 20,180, which is only USD 600 less than it was at the beginning of 2020.
Let's sum up.
In general, I hope I have proven that even trading averaging and martingale utilizing systems are not that dangerous. Of course, you should set responsible limits for averaging. It means that Stop Loss should also be used with averaging and martingale.
Conclusion
More than 10 years have passed since the previous large market crash in 2008. Markets have been steadily growing since them. Who knows, probably a similar 10-year growth may start after the 2020 crash. This would be the perfect time for trading systems like the one described in this article.
As for me, I will definitely launch a robot that traded based on the described system on a real account. The Expert Advisor is attached below, so you may also use it.