MQL5 Cookbook: Developing a Multi-Symbol Volatility Indicator in MQL5
Anatoli Kazharski | 6 January, 2014
Introduction
In this article, we will consider the development of a multi-symbol volatility indicator. The development of multi-symbol indicators may present some difficulties for novice MQL5 developers which this article helps to clarify. The major issues arising in the course of development of a multi-symbol indicator have to do with the synchronization of other symbols' data with respect to the current symbol, the lack of some indicator data and the identification of the beginning of 'true' bars of a given time frame. All of these issues will be closely considered in the article.
We will get values of the Average True Range (ATR) indicator already calculated for each symbol based on the handle. For illustrative purposes, there will be six symbols whose names can be set in the external parameters of the indicator. The names entered will be checked for being correct. Should a certain symbol specified in the parameters not be available in the general list, no calculations will be made for it. All the available symbols will be added to the Market Watch window, unless they are already available there.
In the previous article entitled "MQL5 Cookbook: Indicator Subwindow Controls - Scrollbar" we already talked about the canvas on which you can print text and even draw. This time, we are not going to draw on the canvas but we will use it to display messages about the current program processes to let the user know what is happening at a given point of time.
Development of the Indicator
Let's begin the development of the program. Using the MQL5 Wizard, create a custom indicator template. After a few modifications, you should get the source code as shown below:
//+------------------------------------------------------------------+
//|                                               MultiSymbolATR.mq5 |
//|                        Copyright 2010, MetaQuotes Software Corp. |
//|                                              http://www.mql5.com |
//+------------------------------------------------------------------+
//--- Indicator properties
#property copyright "Copyright 2010, MetaQuotes Software Corp."
#property link      "http://www.mql5.com"
#property version   "1.00"
#property indicator_separate_window // Indicator is in a separate subwindow
#property indicator_minimum 0       // Minimum value of the indicator
#property indicator_buffers 6       // Number of buffers for indicator calculation
#property indicator_plots   6       // Number of plotting series
//+------------------------------------------------------------------+
//| Custom indicator initialization function                         |
//+------------------------------------------------------------------+
int OnInit()
  {
//--- Initialization completed successfully
   return(INIT_SUCCEEDED);
  }
//+------------------------------------------------------------------+
//| Deinitialization                                                 |
//+------------------------------------------------------------------+
void OnDeinit(const int reason)
  {
  }
//+------------------------------------------------------------------+
//| Custom indicator iteration function                              |
//+------------------------------------------------------------------+
int OnCalculate(const int      rates_total,     // Size of input time series
                const int      prev_calculated, // Bars processed at the previous call
                const datetime &time[],         // Opening time
                const double   &open[],         // Open prices
                const double   &high[],         // High prices
                const double   &low[],          // Low prices
                const double   &close[],        // Close prices
                const long     &tick_volume[],  // Tick volumes
                const long     &volume[],       // Real volumes
                const int      &spread[])       // Spread
  {
//--- Return the size of the data array of the current symbol
   return(rates_total);
  }
//+------------------------------------------------------------------+
//| Timer function                                                   |
//+------------------------------------------------------------------+
void OnTimer()
  {
  }
//+------------------------------------------------------------------+
To implement our idea, we will further fill this template with whatever is required. The need for a timer will be explained later on in the article. Let's add constants at the beginning, right after the specific indicator properties:
//--- Constants
#define RESET           0 // Returning the indicator recalculation command to the terminal
#define LEVELS_COUNT    6 // Number of levels
#define SYMBOLS_COUNT   6 // Number of symbols
The LEVELS_COUNT constant contains the value of the number of levels represented by graphical objects of "Horizontal Line" type (OBJ_HLINE). Values of these levels can be specified in the external parameters of the indicator.
Let's include in the project a file with the class for working with the custom graphics:
//--- Include the class for working with the canvas
#include <Canvas\Canvas.mqh>
In the external parameters, we will specify the iATR averaging period, names of symbols whose volatility should be displayed and horizontal level values. Symbols are numbered starting from 2 as the first symbol is considered to be the one to whose chart the indicator is attached.
//--- External parameters
input  int              IndicatorPeriod=14;       // Averaging period
sinput string dlm01=""; //- - - - - - - - - - - - - - - - - - - - - - - - - - -
input  string           Symbol02       ="GBPUSD"; // Symbol 2
input  string           Symbol03       ="AUDUSD"; // Symbol 3
input  string           Symbol04       ="NZDUSD"; // Symbol 4
input  string           Symbol05       ="USDCAD"; // Symbol 5
input  string           Symbol06       ="USDCHF"; // Symbol 6
sinput string dlm02=""; //- - - - - - - - - - - - - - - - - - - - - - - - - - -
input  int              Level01        =10;       // Level 1
input  int              Level02        =50;       // Level 2
input  int              Level03        =100;      // Level 3
input  int              Level04        =200;      // Level 4
input  int              Level05        =400;      // Level 5
input  int              Level06        =600;      // Level 6
Further in the code we should create all global variables and arrays to work with later. All of them are provided in the below code with detailed comments:
//--- Global variables and arrays
CCanvas           canvas;                 // Loading the class
//--- Variables/arrays for copying data from OnCalculate()
int               OC_rates_total     =0;  // Size of input time series
int               OC_prev_calculated =0;  // Bars processed at the previous call
datetime          OC_time[];              // Opening time
double            OC_open[];              // Open prices
double            OC_high[];              // High prices
double            OC_low[];               // Low prices
double            OC_close[];             // Close prices
long              OC_tick_volume[];       // Tick volumes
long              OC_volume[];            // Real volumes
int               OC_spread[];            // Spread
//--- Structure of buffers for drawing indicator values
struct buffers {double data[];};
buffers           atr_buffers[SYMBOLS_COUNT];
//--- Structure of time arrays for data preparation
struct temp_time {datetime time[];};
temp_time         tmp_symbol_time[SYMBOLS_COUNT];
//--- Structure of arrays of the ATR indicator values for data preparation
struct temp_atr {double value[];};
temp_atr          tmp_atr_values[SYMBOLS_COUNT];
//--- For the purpose of storing and checking the time of the first bar in the terminal
datetime          series_first_date[SYMBOLS_COUNT];
datetime          series_first_date_last[SYMBOLS_COUNT];
//--- Time of the bar from which we will start drawing
datetime          limit_time[SYMBOLS_COUNT];
//--- Indicator levels
int               indicator_levels[LEVELS_COUNT];
//--- Symbol names
string            symbol_names[SYMBOLS_COUNT];
//--- Symbol handles
int               symbol_handles[SYMBOLS_COUNT];
//--- Colors of indicator lines
color             line_colors[SYMBOLS_COUNT]={clrRed,clrDodgerBlue,clrLimeGreen,clrGold,clrAqua,clrMagenta};
//--- String representing the lack of the symbol
string            empty_symbol="EMPTY";
//--- Indicator subwindow properties
int               subwindow_number        =WRONG_VALUE;              // Subwindow number
int               chart_width             =0;                        // Chart width
int               subwindow_height        =0;                        // Subwindow height
int               last_chart_width        =0;                        // Last saved chart width
int               last_subwindow_height   =0;                        // Last saved subwindow height
int               subwindow_center_x      =0;                        // Horizontal center of the subwindow
int               subwindow_center_y      =0;                        // Vertical center of the subwindow
string            subwindow_shortname     ="MS_ATR";                 // Short name of the indicator
string            prefix                  =subwindow_shortname+"_";  // Prefix for objects
//--- Canvas properties
string            canvas_name             =prefix+"canvas";          // Canvas name
color             canvas_background       =clrBlack;                 // Canvas background color
uchar             canvas_opacity          =190;                      // Opacity
int               font_size               =16;                       // Font size
string            font_name               ="Calibri";                // Font
ENUM_COLOR_FORMAT clr_format              =COLOR_FORMAT_ARGB_RAW;    // Color components should be correctly set by the user
//--- Canvas messages
string            msg_invalid_handle      ="Invalid indicator handle! Please wait...";
string            msg_prepare_data        ="Preparing data! Please wait...";
string            msg_not_synchronized    ="Unsynchronized data! Please wait...";
string            msg_load_data           ="";
string            msg_sync_update         ="";
string            msg_last                ="";
//--- Maximum number of bars specified in the terminal settings
int               terminal_max_bars=0;
When loading the indicator to the chart, the OnInit() function will perform the following actions:
- setting indicator properties;
- determining arrays for drawing plotting series;
- initializing arrays;
- adding symbols specified in the external parameters to the Market Watch window;
- checking for correctness of parameters and making the first attempt to get indicator handles.
All these actions will be dealt with in a more convenient way if arranged in separate functions. As a result, the OnInit() function source code will become very easy to understand as shown below::
//+------------------------------------------------------------------+
//| Custom indicator initialization function                         |
//+------------------------------------------------------------------+
int OnInit()
  {
//--- Check input parameters for correctness
   if(!CheckInputParameters())
      return(INIT_PARAMETERS_INCORRECT);
//--- Set the timer at 1-second intervals
   EventSetTimer(1);
//--- Set the font to be displayed on the canvas
   canvas.FontSet(font_name,font_size,FW_NORMAL);
//--- Initialization of arrays
   InitArrays();
//--- Initialize the array of symbols
   InitSymbolNames();
//--- Initialize the array of levels
   InitLevels();
//--- Get indicator handles
   GetIndicatorHandles();
//--- Set indicator properties
   SetIndicatorProperties();
//--- Get the number of bars specified in the terminal settings
   terminal_max_bars=TerminalInfoInteger(TERMINAL_MAXBARS);
//--- Clear the comment
   Comment("");
//--- Refresh the chart
   ChartRedraw();
//--- Initialization completed successfully
   return(INIT_SUCCEEDED);
  }
Let's have a closer look at the custom functions used in the above code. In the CheckInputParameters() function, we check external parameters for correctness. In our case, we only check one parameter - ATR indicator period. I have set the restriction value of 500. That is, if you set the period value higher than the value specified, the indicator will cease its operation and print the message about the reason of the program termination to the log and the chart comment. The CheckInputParameters() function code is provided below.
//+------------------------------------------------------------------+
//| Checking input parameters for correctness                        |
//+------------------------------------------------------------------+
bool CheckInputParameters()
  {
   if(IndicatorPeriod>500)
     {
      Comment("Decrease the indicator period! Indicator Period: ",IndicatorPeriod,"; Limit: 500;");
      printf("Decrease the indicator period! Indicator Period: %d; Limit: %d;",IndicatorPeriod,500);
      return(false);
     }
//---
   return(true);
  }
Then we move to three array initialization functions: InitArrays(), InitSymbolNames() and InitLevels(). Their respective source codes are provided below:
//+------------------------------------------------------------------+
//| First initialization of arrays                                   |
//+------------------------------------------------------------------+
void InitArrays()
  {
   ArrayInitialize(limit_time,NULL);
   ArrayInitialize(series_first_date,NULL);
   ArrayInitialize(series_first_date_last,NULL);
   ArrayInitialize(symbol_handles,INVALID_HANDLE);
//---
   for(int s=0; s<SYMBOLS_COUNT; s++)
      ArrayInitialize(atr_buffers[s].data,EMPTY_VALUE);
  }
//+------------------------------------------------------------------+
//| Initializing array of symbols                                    |
//+------------------------------------------------------------------+
void InitSymbolNames()
  {
   symbol_names[0]=AddSymbolToMarketWatch(_Symbol);
   symbol_names[1]=AddSymbolToMarketWatch(Symbol02);
   symbol_names[2]=AddSymbolToMarketWatch(Symbol03);
   symbol_names[3]=AddSymbolToMarketWatch(Symbol04);
   symbol_names[4]=AddSymbolToMarketWatch(Symbol05);
   symbol_names[5]=AddSymbolToMarketWatch(Symbol06);
  }
//+------------------------------------------------------------------+
//| Initializing array of levels                                     |
//+------------------------------------------------------------------+
void InitLevels()
  {
   indicator_levels[0]=Level01;
   indicator_levels[1]=Level02;
   indicator_levels[2]=Level03;
   indicator_levels[3]=Level04;
   indicator_levels[4]=Level05;
   indicator_levels[5]=Level06;
  }
In the InitSymbolNames() function, we use another custom function - AddSymbolToMarketWatch(). It receives the symbol name and if this symbol is available in the general list, it will be added to the Market Watch window and the function will return the string with the symbol name. If that symbol is not available, the function will return the "EMPTY" string and no actions will further be performed for this element in the array of symbols when running checks in other functions.
//+------------------------------------------------------------------+
//| Adding the specified symbol to the Market Watch window           |
//+------------------------------------------------------------------+
string AddSymbolToMarketWatch(string symbol)
  {
   int      total=0; // Number of symbols
   string   name=""; // Symbol name
//--- If an empty string is passed, return the empty string
   if(symbol=="")
      return(empty_symbol);
//--- Total symbols on the server
   total=SymbolsTotal(false);
//--- Iterate over the entire list of symbols
   for(int i=0;i<total;i++)
     {
      //--- Symbol name on the server
      name=SymbolName(i,false);
      //--- If this symbol is available,
      if(name==symbol)
        {
         //--- add it to the Market Watch window and
         SymbolSelect(name,true);
         //--- return its name
         return(name);
        }
     }
//--- If this symbol is not available, return the string representing the lack of the symbol
   return(empty_symbol);
  }
GetIndicatorHandles() is another function called at the indicator initialization. It attempts to get the ATR indicator handles for each symbol specified. If the handle has not been obtained for some symbol, the function will return false but this will not be processed in any way in OnInit() as the handle availability will be checked in other parts of the program.
//+------------------------------------------------------------------+
//| Getting indicator handles                                        |
//+------------------------------------------------------------------+
bool GetIndicatorHandles()
  {
//--- An indication of all handles being valid
   bool valid_handles=true;
//--- Iterate over all symbols in a loop and ...
   for(int s=0; s<SYMBOLS_COUNT; s++)
     {
      //--- If the symbol is available
      if(symbol_names[s]!=empty_symbol)
        {
         // And if the handle of the current symbol is invalid
         if(symbol_handles[s]==INVALID_HANDLE)
           {
            //--- Get it
            symbol_handles[s]=iATR(symbol_names[s],Period(),IndicatorPeriod);
            //--- If the handle could not be obtained, try again next time
            if(symbol_handles[s]==INVALID_HANDLE)
               valid_handles=false;
           }
        }
     }
//--- Print the relevant message if the handle for one of the symbols could not be obtained
   if(!valid_handles)
     {
      msg_last=msg_invalid_handle;
      ShowCanvasMessage(msg_invalid_handle);
     }
//---
   return(valid_handles);
  }
The ShowCanvasMessage() function will be reviewed a bit later together with other functions for working with the canvas.
Indicator properties are set in the SetIndicatorProperties() function. Since the properties for each plotting series are similar, it is more convenient to set them using loops:
//+------------------------------------------------------------------+
//| Setting indicator properties                                     |
//+------------------------------------------------------------------+
void SetIndicatorProperties()
  {
//--- Set the short name
   IndicatorSetString(INDICATOR_SHORTNAME,subwindow_shortname);
//--- Set the number of decimal places
   IndicatorSetInteger(INDICATOR_DIGITS,_Digits);
//--- Define buffers for drawing
   for(int s=0; s<SYMBOLS_COUNT; s++)
      SetIndexBuffer(s,atr_buffers[s].data,INDICATOR_DATA);
//--- Set labels for the current symbol
   for(int s=0; s<SYMBOLS_COUNT; s++)
      PlotIndexSetString(s,PLOT_LABEL,"ATR ("+IntegerToString(s)+", "+symbol_names[s]+")");
//--- Set the plotting type: lines
   for(int s=0; s<SYMBOLS_COUNT; s++)
      PlotIndexSetInteger(s,PLOT_DRAW_TYPE,DRAW_LINE);
//--- Set the line width
   for(int s=0; s<SYMBOLS_COUNT; s++)
      PlotIndexSetInteger(s,PLOT_LINE_WIDTH,1);
//--- Set the line color
   for(int s=0; s<SYMBOLS_COUNT; s++)
      PlotIndexSetInteger(s,PLOT_LINE_COLOR,line_colors[s]);
//--- Empty value for plotting where nothing will be drawn
   for(int s=0; s<SYMBOLS_COUNT; s++)
      PlotIndexSetDouble(s,PLOT_EMPTY_VALUE,EMPTY_VALUE);
  }
After successful initialization of the program, we need to make the first call of the OnCalculate() function. The value of the prev_calculated variable is zero at the first function call. It is also zeroed out by the terminal when a deeper history is being loaded or gaps in the history are being filled. In such cases, indicator buffers are completely recalculated. If this parameter value is non-zero, i.e. the result previously returned by the same function, which is the size of input time series, it is sufficient to only update the last values of the buffers.
You might not always manage to make all calculations correctly at the first attempt. In this case, in order to return we will use the RESET constant that contains zero value. At the next call of OnCalculate() (e.g. at the next tick), the prev_calculated parameter will contain zero value, which means that we will need to make one more attempt to do all the necessary calculations prior to displaying plotting series of the indicator in the chart.
But the chart will remain empty when the market is closed and there are no new ticks or following unsuccessful calculations. In this case, you can try a simple way of giving a command to make another attempt - by manually changing the chart time frame. But we will use a different approach. This is why at the very beginning we added the timer, the OnTimer() function, to our program template and set the time interval of 1 second in the OnInit() function.
Every second the timer will check whether the OnCalculate() function has returned zero. For this purpose, we will write a CopyDataOnCalculate() function that will copy all parameters from OnCalculate() to the global variables with corresponding names and arrays with the prefix OC_.
//+------------------------------------------------------------------+
//| Copying data from OnCalculate                                    |
//+------------------------------------------------------------------+
void CopyDataOnCalculate(const int      rates_total,
                         const int      prev_calculated,
                         const datetime &time[],
                         const double   &open[],
                         const double   &high[],
                         const double   &low[],
                         const double   &close[],
                         const long     &tick_volume[],
                         const long     &volume[],
                         const int      &spread[])
  {
   OC_rates_total=rates_total;
   OC_prev_calculated=prev_calculated;
   ArrayCopy(OC_time,time);
   ArrayCopy(OC_open,open);
   ArrayCopy(OC_high,high);
   ArrayCopy(OC_low,low);
   ArrayCopy(OC_close,close);
   ArrayCopy(OC_tick_volume,tick_volume);
   ArrayCopy(OC_volume,volume);
   ArrayCopy(OC_spread,spread);
  }
This function should be called at the very beginning of the OnCalculate() function body. Furthermore, at the very beginning we should also add another custom function, ResizeCalculatedArrays(), that will set the size to the arrays for data preparation before placing them in indicator buffers. The size of these arrays should be equal to the size of input time series.
//+------------------------------------------------------------------+
//| Resizing the size of arrays to the size of the main array        |
//+------------------------------------------------------------------+
void ResizeCalculatedArrays()
  {
   for(int s=0; s<SYMBOLS_COUNT; s++)
     {
      ArrayResize(tmp_symbol_time[s].time,OC_rates_total);
      ArrayResize(tmp_atr_values[s].value,OC_rates_total);
     }
  }
Further, we will create a ZeroCalculatedArrays() function that initializes arrays for data preparation to zero before outputting them to the chart.
//+------------------------------------------------------------------+
//| Zeroing out arrays for data preparation                          |
//+------------------------------------------------------------------+
void ZeroCalculatedArrays()
  {
   for(int s=0; s<SYMBOLS_COUNT; s++)
     {
      ArrayInitialize(tmp_symbol_time[s].time,NULL);
      ArrayInitialize(tmp_atr_values[s].value,EMPTY_VALUE);
     }
  }
The same function will be required to preliminary zero out indicator buffers. Let's call it ZeroIndicatorBuffers().
//+------------------------------------------------------------------+
//| Zeroing out indicator buffers                                    |
//+------------------------------------------------------------------+
void ZeroIndicatorBuffers()
  {
   for(int s=0; s<SYMBOLS_COUNT; s++)
      ArrayInitialize(atr_buffers[s].data,EMPTY_VALUE);
  }
The current code of the OnCalculate() function will be as shown below. I have also provided comments for the main operations to be filled in later on (comments and dots underneath).
//+------------------------------------------------------------------+
//| Custom indicator iteration function                              |
//+------------------------------------------------------------------+
int OnCalculate(const int      rates_total,     // Size of input time series
                const int      prev_calculated, // Bars processed at the previous call
                const datetime &time[],         // Opening time
                const double   &open[],         // Open prices
                const double   &high[],         // High prices
                const double   &low[],          // Low prices
                const double   &close[],        // Close prices
                const long     &tick_volume[],  // Tick volumes
                const long     &volume[],       // Real volumes
                const int      &spread[])       // Spread
  {
//--- For the purpose of determining the bar from which the calculation shall be made
   int limit=0;
//--- Make a copy of the OnCalculate() parameters
   CopyDataOnCalculate(rates_total,prev_calculated,
                       time,open,high,low,close,
                       tick_volume,volume,spread);
//--- Set the size to arrays for data preparation
   ResizeCalculatedArrays();
//--- If this is the first calculation or if a deeper history has been loaded or gaps in the history have been filled
   if(prev_calculated==0)
     {
      //--- Zero out arrays for data preparation
      ZeroCalculatedArrays();
      //--- Zero out indicator buffers
      ZeroIndicatorBuffers();
      //--- Other checks
      // ...
      //--- If you reached this point, it means that OnCalculate() will return non-zero value and this needs to be saved
      OC_prev_calculated=rates_total;
     }
//--- If only the last values need to be recalculated
   else
      limit=prev_calculated-1;

//--- Prepare data for drawing
// ...
//--- Fill arrays with data for drawing
// ...

//--- Return the size of the data array of the current symbol
   return(rates_total);
  }
Currently, the OnTimer() function code is as follows:
//+------------------------------------------------------------------+
//| Timer function                                                   |
//+------------------------------------------------------------------+
void OnTimer()
  {
//--- If for some reason calculations have not been completed or
//    a deeper history has been loaded or
//    gaps in the history have been filled,
//    then make another attempt without waiting for the new tick
   if(OC_prev_calculated==0)
     {
      OnCalculate(OC_rates_total,OC_prev_calculated,
                  OC_time,OC_open,OC_high,OC_low,OC_close,
                  OC_tick_volume,OC_volume,OC_spread);
     }
  }
Now, let's consider other functions that will be used when the prev_calculated variable is equal to zero. These functions will:
- load and generate the necessary amount of data (bars);
- check for availability of all handles;
- check the readiness of the required amount of data;
- synchronize data with the server;
- determine bars from which plotting series will be drawn.
In addition, we will identify the first 'true' bar for each symbol. This concise term has been coined to make it more convenient later on. Here is what it means. All the time frames in MetaTrader 5 are built from minute data. But if, for example, daily data on the server are available from 1993, whereas minute data are only available from 2000, then if we select, say, hourly chart time frame, bars will be built starting from the date where minute data becomes available, i.e. from year 2000. Everything prior to 2000 will either be represented by daily data or the data nearest to the current time frame. Therefore, to avoid confusion you should not display indicator data for data that are not related to the current time frame. This is the reason why we are going to identify the first 'true' bar of the current time frame and mark it with a vertical line of the same color as that of the indicator buffer of the symbol.
Identification of 'true' bars is also important when developing Expert Advisors because if parameters are optimized for a certain time frame, data from other time frames would in that case be inappropriate.
Before running the above checks, we will add the canvas to the indicator subwindow. So first we should write all the functions we will need to manage the canvas. Prior to adding the canvas to the subwindow, we need to determine its size, as well as the coordinates based on which text messages will be displayed on the canvas. For this purpose, let's write a GetSubwindowGeometry() function:
//+------------------------------------------------------------------+
//| Getting geometry of the indicator subwindow                      |
//+------------------------------------------------------------------+
void GetSubwindowGeometry()
  {
//--- Get the indicator subwindow number
   subwindow_number=ChartWindowFind(0,subwindow_shortname);
//--- Get the subwindow width and height
   chart_width=(int)ChartGetInteger(0,CHART_WIDTH_IN_PIXELS);
   subwindow_height=(int)ChartGetInteger(0,CHART_HEIGHT_IN_PIXELS,subwindow_number);
//--- Calculate the center of the subwindow
   subwindow_center_x=chart_width/2;
   subwindow_center_y=subwindow_height/2;
  }
When the subwindow properties are obtained, you can add the canvas. Its background will be 100% transparent (opacity equal to 0), only becoming visible when loading and generating data to let the user know what is currently happening. When visible, the background opacity will be equal to 190. You can set the opacity value anywhere between 0 and 255. For further information, please refer to the ColorToARGB() function description available under Help .
To set the canvas, let's write a SetCanvas() function:
//+------------------------------------------------------------------+
//| Setting canvas                                                   |
//+------------------------------------------------------------------+
void SetCanvas()
  {
//--- If there is no canvas, set it
   if(ObjectFind(0,canvas_name)<0)
     {
      //--- Create the canvas
      canvas.CreateBitmapLabel(0,subwindow_number,canvas_name,0,0,chart_width,subwindow_height,clr_format);
      //--- Make the canvas completely transparent
      canvas.Erase(ColorToARGB(canvas_background,0));
      //--- Redraw the canvas
      canvas.Update();
     }
  }
We will also need a function that checks whether the indicator subwindow has been resized. If it has, the canvas size will be automatically adjusted to the new subwindow size. Let's call this function OnSubwindowChange():
//+------------------------------------------------------------------+
//| Checking the subwindow size                                      |
//+------------------------------------------------------------------+
void OnSubwindowChange()
  {
//--- Get subwindow properties
   GetSubwindowGeometry();
//--- If the subwindow size has not changed, exit
   if(!SubwindowSizeChanged())
      return;
//--- If the subwindow height is less than one pixel or if the center has been calculated incorrectly, exit
   if(subwindow_height<1 || subwindow_center_y<1)
      return;
//--- Set the new canvas size
   ResizeCanvas();
//--- Show the last message
   ShowCanvasMessage(msg_last);
  }
The functions highlighted in the above code can be explored below. Please note the types of checks that are run before resizing the subwindow. If any property turns out to be incorrect, the function stops its operation.
The SubwindowSizeChanged() function code is as follows:
//+------------------------------------------------------------------+
//| Checking if the subwindow has been resized                       |
//+------------------------------------------------------------------+
bool SubwindowSizeChanged()
  {
//--- If the subwindow size has not changed, exit
   if(last_chart_width==chart_width && last_subwindow_height==subwindow_height)
      return(false);
//--- If the size has changed, save it
   else
     {
      last_chart_width=chart_width;
      last_subwindow_height=subwindow_height;
     }
//---
   return(true);
  }
The ResizeCanvas() function code is as follows:
//+------------------------------------------------------------------+
//| Resizing canvas                                                  |
//+------------------------------------------------------------------+
void ResizeCanvas()
  {
//--- If the canvas has already been added to the indicator subwindow, set the new size
   if(ObjectFind(0,canvas_name)==subwindow_number)
      canvas.Resize(chart_width,subwindow_height);
  }
And finally, below is the ShowCanvasMessage() function code which we also used earlier when getting indicator handles:
//+------------------------------------------------------------------+
//| Displaying message on the canvas                                 |
//+------------------------------------------------------------------+
void ShowCanvasMessage(string message_text)
  {
   GetSubwindowGeometry();
//--- If the canvas has already been added to the indicator subwindow
   if(ObjectFind(0,canvas_name)==subwindow_number)
     {
      //--- If the string passed is not empty and correct coordinates have been obtained, display the message
      if(message_text!="" && subwindow_center_x>0 && subwindow_center_y>0)
        {
         canvas.Erase(ColorToARGB(canvas_background,canvas_opacity));
         canvas.TextOut(subwindow_center_x,subwindow_center_y,message_text,ColorToARGB(clrRed),TA_CENTER|TA_VCENTER);
         canvas.Update();
        }
     }
  }
The canvas will be deleted with disappearing effect. To implement it, right before deleting the canvas, we need to gradually change the opacity from the current value to zero in a loop, while refreshing the canvas at each iteration.
The DeleteCanvas() function code is as follows:
//+------------------------------------------------------------------+
//| Deleting canvas                                                  |
//+------------------------------------------------------------------+
void DeleteCanvas()
  {
//--- Delete the canvas if it exists
   if(ObjectFind(0,canvas_name)>0)
     {
      //--- Before deleting, implement the disappearing effect
      for(int i=canvas_opacity; i>0; i-=5)
        {
         canvas.Erase(ColorToARGB(canvas_background,(uchar)i));
         canvas.Update();
        }
      //--- Delete the graphical resource
      canvas.Destroy();
     }
  }
Next, let's take a look at the functions required for checking the readiness of data before placing them in indicator buffers and displaying on the chart. Let's start with the LoadAndFormData() function. We use it to compare the size of the current symbol array with the data available for other symbols. If necessary, data are loaded from the server. The function code is provided with detailed comments for your consideration.
//+------------------------------------------------------------------+
//| Loading and generating the necessary/available amount of data    |
//+------------------------------------------------------------------+
void LoadAndFormData()
  {
   int bars_count=100; // Number of loaded bars
//---
   for(int s=0; s<SYMBOLS_COUNT; s++)
     {
      int      attempts          =0;    // Counter of data copying attempts
      int      array_size        =0;    // Array size
      datetime firstdate_server  =NULL; // Time of the first bar on the server
      datetime firstdate_terminal=NULL; // Time of the first bar in the terminal base
      //--- Get the first date by the symbol/time frame in the terminal base
      SeriesInfoInteger(symbol_names[s],Period(),SERIES_FIRSTDATE,firstdate_terminal);
      //--- Get the first date of the symbol/time frame on the server
      SeriesInfoInteger(symbol_names[s],Period(),SERIES_SERVER_FIRSTDATE,firstdate_server);
      //--- Print the message
      msg_last=msg_load_data="Loading and generating data: "+
               symbol_names[s]+"("+(string)(s+1)+"/"+(string)SYMBOLS_COUNT+") ... ";
      ShowCanvasMessage(msg_load_data);
      //--- Load/generate data.
      //    If the array size is smaller than the maximum number of bars in the terminal, and if
      //    the number of bars between the first date of the series in the terminal and the first date of the series on the server is more than specified
      while(array_size<OC_rates_total &&
            firstdate_terminal-firstdate_server>PeriodSeconds()*bars_count)
        {
         datetime copied_time[];
         //--- Get the first date by the symbol/time frame in the terminal base
         SeriesInfoInteger(symbol_names[s],Period(),SERIES_FIRSTDATE,firstdate_terminal);
         //--- Load/copy the specified number of bars
         if(CopyTime(symbol_names[s],Period(),0,array_size+bars_count,copied_time)!=-1)
           {
            //--- If the time of the first bar in the array, excluding the number of the bars being loaded, is earlier
            //    than the time of the first bar in the chart, terminate the loop
            if(copied_time[0]-PeriodSeconds()*bars_count<OC_time[0])
               break;
            //--- If the array size hasn't increased, increase the counter
            if(ArraySize(copied_time)==array_size)
               attempts++;
            //--- Otherwise get the current size of the array
            else
               array_size=ArraySize(copied_time);
            //--- If the array size hasn't increased over 100 attempts, terminate the loop
            if(attempts==100)
              {
               attempts=0;
               break;
              }
           }
         //--- Check the subwindow size once every 2000 bars
         //    and if the size has changed, adjust the canvas size to it
         if(!(array_size%2000))
            OnSubwindowChange();
        }
     }
  }
After the attempt to load the required amount of data, we once again check for indicator handles. For this purpose, we use the GetIndicatorHandles() function considered above.
Once the handles have been checked, the program checks for the availability of the specified symbols' data and indicator values for each symbol using the CheckAvailableData() function. Below you can have a closer look at how this is done:
//+------------------------------------------------------------------+
//| Checking the amount of available data for all symbols            |
//+------------------------------------------------------------------+
bool CheckAvailableData()
  {
   for(int s=0; s<SYMBOLS_COUNT; s++)
     {
      //--- If this symbol is available
      if(symbol_names[s]!=empty_symbol)
        {
         double   data[]; // Array for checking the amount of indicator data
         datetime time[]; // Array for checking the number of bars
         int      calculated_values =0;    // Amount of indicator data
         int      available_bars    =0;    // Number of bars of the current period
         datetime firstdate_terminal=NULL; // First date of the current time frame data available in the terminal
         //--- Get the number of calculated values of the indicator
         calculated_values=BarsCalculated(symbol_handles[s]);
         //--- Get the first date of the current time frame data in the terminal
         firstdate_terminal=(datetime)SeriesInfoInteger(symbol_names[s],Period(),SERIES_TERMINAL_FIRSTDATE);
         //--- Get the number of available bars from the date specified
         available_bars=Bars(symbol_names[s],Period(),firstdate_terminal,TimeCurrent());
         //--- Check the readiness of bar data: 5 attempts to get values
         for(int i=0; i<5; i++)
           {
            //--- Copy the specified amount of data
            if(CopyTime(symbol_names[s],Period(),0,available_bars,time)!=-1)
              {
               //--- If the required amount has been copied, terminate the loop
               if(ArraySize(time)>=available_bars)
                  break;
              }
           }
         //--- Check the readiness of indicator data: 5 attempts to get values
         for(int i=0; i<5; i++)
           {
            //--- Copy the specified amount of data
            if(CopyBuffer(symbol_handles[s],0,0,calculated_values,data)!=-1)
              {
               //--- If the required amount has been copied, terminate the loop
               if(ArraySize(data)>=calculated_values)
                  break;
              }
           }
         //--- If the amount of data copied is not sufficient, one more attempt is required
         if(ArraySize(time)<available_bars || ArraySize(data)<calculated_values)
           {
            msg_last=msg_prepare_data;
            ShowCanvasMessage(msg_prepare_data);
            OC_prev_calculated=0;
            return(false);
           }
        }
     }
//---
   return(true);
  }
The CheckAvailableData() function will not allow to make further calculations until data for all symbols are ready. The operation of all check functions follows a similar pattern.
The next function is required to monitor the event of loading a deeper history of quotes. Let's call it CheckEventLoadHistory(). If greater amount of data is loaded, the indicator should be fully recalculated. The source code of this function is provided below:
//+------------------------------------------------------------------+
//| Checking the event of loading a deeper history                   |
//+------------------------------------------------------------------+
bool CheckLoadedHistory()
  {
   bool loaded=false;
//---
   for(int s=0; s<SYMBOLS_COUNT; s++)
     {
      //--- If this symbol is available
      if(symbol_names[s]!=empty_symbol)
        {
         //--- If the series need to be updated
         if(OC_prev_calculated==0)
           {
            //--- Get the first date by the symbol/time frame
            series_first_date[s]=(datetime)SeriesInfoInteger(symbol_names[s],Period(),SERIES_FIRSTDATE);
            //--- If this is the first time (no value is available), then
            if(series_first_date_last[s]==NULL)
               //--- Store the first date by the symbol/time frame for further comparison
               //    in order to determine if a deeper history has been loaded
               series_first_date_last[s]=series_first_date[s];
           }
         else
           {
            //--- Get the first date by the symbol/time frame
            series_first_date[s]=(datetime)SeriesInfoInteger(symbol_names[s],Period(),SERIES_FIRSTDATE);
            //--- If the dates are different, i.e. the date in the memory is later than the one we have just obtained,
            //     this means that a deeper history has been loaded
            if(series_first_date_last[s]>series_first_date[s])
              {
               //--- Print the relevant message to the log
               Print("(",symbol_names[s],",",TimeframeToString(Period()),
                     ") > A deeper history has been loaded/generated: ",
                     series_first_date_last[s]," > ",series_first_date[s]);
               //--- Store the date
               series_first_date_last[s]=series_first_date[s];
               loaded=true;
              }
           }
        }
     }
//--- If a deeper history has been loaded/generated, then
//    send the command to refresh the plotting series of the indicator
   if(loaded)
      return(false);
//---
   return(true);
  }
Let's write another function for checking the synchronization between the data in the terminal and on the server. This check will only be run if the connection to the server is established. The CheckSymbolIsSynchronized() function code is provided below:
//+------------------------------------------------------------------+
//| Checking synchronization by symbol/time frame                    |
//+------------------------------------------------------------------+
bool CheckSymbolIsSynchronized()
  {
//--- If the connection to the server is established, check the data synchronization
   if(TerminalInfoInteger(TERMINAL_CONNECTED))
     {
      for(int s=0; s<SYMBOLS_COUNT; s++)
        {
         //--- If the symbol is available
         if(symbol_names[s]!=empty_symbol)
           {
            //--- If the data are not synchronized, print the relevant message and try again
            if(!SeriesInfoInteger(symbol_names[s],Period(),SERIES_SYNCHRONIZED))
              {
               msg_last=msg_not_synchronized;
               ShowCanvasMessage(msg_not_synchronized);
               return(false);
              }
           }
        }
     }
//---
   return(true);
  }
The function for conversion of the time frame to a string will be taken from previous articles of the "MQL5 Cookbook" series:
//+------------------------------------------------------------------+
//| Converting time frame to a string                                |
//+------------------------------------------------------------------+
string TimeframeToString(ENUM_TIMEFRAMES timeframe)
  {
   string str="";
//--- If the value passed is incorrect, take the current chart time frame
   if(timeframe==WRONG_VALUE || timeframe== NULL)
      timeframe= Period();
   switch(timeframe)
     {
      case PERIOD_M1  : str="M1";  break;
      case PERIOD_M2  : str="M2";  break;
      case PERIOD_M3  : str="M3";  break;
      case PERIOD_M4  : str="M4";  break;
      case PERIOD_M5  : str="M5";  break;
      case PERIOD_M6  : str="M6";  break;
      case PERIOD_M10 : str="M10"; break;
      case PERIOD_M12 : str="M12"; break;
      case PERIOD_M15 : str="M15"; break;
      case PERIOD_M20 : str="M20"; break;
      case PERIOD_M30 : str="M30"; break;
      case PERIOD_H1  : str="H1";  break;
      case PERIOD_H2  : str="H2";  break;
      case PERIOD_H3  : str="H3";  break;
      case PERIOD_H4  : str="H4";  break;
      case PERIOD_H6  : str="H6";  break;
      case PERIOD_H8  : str="H8";  break;
      case PERIOD_H12 : str="H12"; break;
      case PERIOD_D1  : str="D1";  break;
      case PERIOD_W1  : str="W1";  break;
      case PERIOD_MN1 : str="MN1"; break;
     }
//---
   return(str);
  }
And finally, we need to identify and save the first true bar for each symbol by marking it in the chart with a vertical line. To do this, let's write a DetermineFirstTrueBar() function and an auxiliary function GetFirstTrueBarTime() which returns the time of the first true bar.
//+-----------------------------------------------------------------------+
//| Determining the time of the first true bar for the purpose of drawing |
//+-----------------------------------------------------------------------+
bool DetermineFirstTrueBar()
  {
   for(int s=0; s<SYMBOLS_COUNT; s++)
     {
      datetime time[];           // Bar time array
      int      available_bars=0; // Number of bars
      //--- If this symbol is not available, move to the next one
      if(symbol_names[s]==empty_symbol)
         continue;
      //--- Get the total number of bars for the symbol
      available_bars=Bars(symbol_names[s],Period());
      //--- Copy the bar time array. If this action failed, try again.
      if(CopyTime(symbol_names[s],Period(),0,available_bars,time)<available_bars)
         return(false);
      //--- Get the time of the first true bar corresponding to the current time frame
      limit_time[s]=GetFirstTrueBarTime(time);
      //--- Place a vertical line on the true bar
      CreateVerticalLine(0,0,limit_time[s],prefix+symbol_names[s]+": begin time series",
                          2,STYLE_SOLID,line_colors[s],false,TimeToString(limit_time[s]),"\n");
     }
//---
   return(true);
  }
//+-----------------------------------------------------------------------+
//| Returning the time of the first true bar of the current time frame    |
//+-----------------------------------------------------------------------+
datetime GetFirstTrueBarTime(datetime &time[])
  {
   datetime true_period =NULL; // Time of the first true bar
   int      array_size  =0;    // Array size
//--- Get the array size
   array_size=ArraySize(time);
   ArraySetAsSeries(time,false);
//--- Check each bar one by one
   for(int i=1; i<array_size; i++)
     {
      //--- If the bar corresponds to the current time frame
      if(time[i]-time[i-1]==PeriodSeconds())
        {
         //--- Save it and terminate the loop
         true_period=time[i];
         break;
        }
     }
//--- Return the time of the first true bar
   return(true_period);
  }
The time of the first true bar is marked in the chart with a vertical line using the CreateVerticalLine() function:
//+------------------------------------------------------------------+
//| Creating a vertical line at the specified time point             |
//+------------------------------------------------------------------+
void CreateVerticalLine(long            chart_id,           // chart id
                        int             window_number,      // window number
                        datetime        time,               // time
                        string          object_name,        // object name
                        int             line_width,         // line width
                        ENUM_LINE_STYLE line_style,         // line style
                        color           line_color,         // line color
                        bool            selectable,         // cannot select the object if FALSE
                        string          description_text,   // text of the description
                        string          tooltip)            // no tooltip if "\n"
  {
//--- If the object has been created successfully
   if(ObjectCreate(chart_id,object_name,OBJ_VLINE,window_number,time,0))
     {
      //--- set its properties
      ObjectSetInteger(chart_id,object_name,OBJPROP_TIME,time);
      ObjectSetInteger(chart_id,object_name,OBJPROP_SELECTABLE,selectable);
      ObjectSetInteger(chart_id,object_name,OBJPROP_STYLE,line_style);
      ObjectSetInteger(chart_id,object_name,OBJPROP_WIDTH,line_width);
      ObjectSetInteger(chart_id,object_name,OBJPROP_COLOR,line_color);
      ObjectSetString(chart_id,object_name,OBJPROP_TEXT,description_text);
      ObjectSetString(chart_id,object_name,OBJPROP_TOOLTIP,tooltip);
     }
  }
The check functions are ready. As a result, the part of the OnCalculate() function code when the prev_calculated variable is equal to zero will now look as shown below:
//--- If this is the first calculation or if a deeper history has been loaded or gaps in the history have been filled
   if(prev_calculated==0)
     {
      //--- Zero out arrays for data preparation
      ZeroCalculatedArrays();
      //--- Zero out indicator buffers
      ZeroIndicatorBuffers();
      //--- Get subwindow properties
      GetSubwindowGeometry();
      //--- Add the canvas
      SetCanvas();
      //--- Load and generate the necessary/available amount of data
      LoadAndFormData();
      //--- If there is an invalid handle, try to get it again
      if(!GetIndicatorHandles())
         return(RESET);
      //--- Check the amount of data available for all symbols
      if(!CheckAvailableData())
         return(RESET);
      //--- Check if a deeper history has been loaded
      if(!CheckLoadedHistory())
         return(RESET);
      //--- Check synchronization by symbol/time frame at the current moment
      if(!CheckSymbolIsSynchronized())
         return(RESET);
      //--- For each symbol, determine the bar from which we should start drawing
      if(!DetermineFirstTrueBar())
         return(RESET);
      //--- If you reached this point, it means that OnCalculate() will return non-zero value and this needs to be saved
      OC_prev_calculated=rates_total;
     }
Now, every time a certain check fails, the program will step backwards to make another attempt at the next tick or timer event. In the timer, we should also run the check for loading a deeper history outside of the OnCalculate() function:
//+------------------------------------------------------------------+
//| Timer function                                                   |
//+------------------------------------------------------------------+
void OnTimer()
  {
//--- If a deeper history has been loaded
   if(!CheckLoadedHistory())
      OC_prev_calculated=0;
//--- If for some reason calculations have not been completed or
//    a deeper history has been loaded or
//    gaps in the history have been filled,
//    then make another attempt without waiting for the new tick
   if(OC_prev_calculated==0)
     {
      OnCalculate(OC_rates_total,OC_prev_calculated,
                  OC_time,OC_open,OC_high,OC_low,OC_close,
                  OC_tick_volume,OC_volume,OC_spread);
     }
  }
Now we only need to write two main loops to be placed in the OnCalculate() function:
- The first loop will prepare data based on the principle of "getting the value by all means" to avoid gaps in indicator series. The idea behind it is simple: a given number of attempts will be made in case of failure to get the value. In this loop, time values of the symbols and volatility indicator (ATR) values will be saved to separate arrays.
- In the second main loop, when filling indicator buffers, time arrays of other symbols will be required for comparison with the time of the current symbol and synchronization of all plotting series.
The code of the first loop is provided below:
//--- Prepare data for drawing
   for(int s=0; s<SYMBOLS_COUNT; s++)
     {
      //--- If the symbol is available
      if(symbol_names[s]!=empty_symbol)
        {
         double percent=0.0; // For the purpose of calculating the progress percentage
         msg_last=msg_sync_update="Preparing data ("+IntegerToString(rates_total)+" bars) : "+
                      symbol_names[s]+"("+(string)(s+1)+"/"+(string)(SYMBOLS_COUNT)+") - 00% ... ";
         //--- Print the message
         ShowCanvasMessage(msg_sync_update);
         //--- Control every value of the array
         for(int i=limit; i<rates_total; i++)
           {
            PrepareData(i,s,time);
            //--- Refresh the message once every 1000 bars
            if(i%1000==0)
              {
               //--- Progress percentage
               ProgressPercentage(i,s,percent);
               //--- Print the message
               ShowCanvasMessage(msg_sync_update);
              }
            //--- Check the subwindow size once every 2000 bars
            //    and if the size has changed, adjust the canvas size to it
            if(i%2000==0)
               OnSubwindowChange();
           }
        }
     }
The main function for copying and saving values, PrepareData(), is highlighted in the code above. There is also a new function which has not yet been considered - ProgressPercentage(). It calculates progress percentage of the current operation to let the user know how long it will last.
The code of the PrepareData() function is as follows:
//+------------------------------------------------------------------+
//| Preparing data before drawing                                    |
//+------------------------------------------------------------------+
void PrepareData(int bar_index,int symbol_number,datetime const &time[])
  {
   int attempts=100; // Number of copying attempts
//--- Time of the bar of the specified symbol and time frame
   datetime symbol_time[];
//--- Array for copying indicator values
   double atr_values[];
//--- If within the area of the current time frame bars
   if(time[bar_index]>=limit_time[symbol_number])
     {
      //--- Copy the time
      for(int i=0; i<attempts; i++)
        {
         if(CopyTime(symbol_names[symbol_number],0,time[bar_index],1,symbol_time)==1)
           {
            tmp_symbol_time[symbol_number].time[bar_index]=symbol_time[0];
            break;
           }
        }
      //--- Copy the indicator value
      for(int i=0; i<attempts; i++)
        {
         if(CopyBuffer(symbol_handles[symbol_number],0,time[bar_index],1,atr_values)==1)
           {
            tmp_atr_values[symbol_number].value[bar_index]=atr_values[0];
            break;
           }
        }
     }
//--- If outside the area of the current time frame bars, set an empty value
   else
      tmp_atr_values[symbol_number].value[bar_index]=EMPTY_VALUE;
  }
The code of the ProgressPercentage() function is as follows:
//+------------------------------------------------------------------+
//| Calculating progress percentage                                  |
//+------------------------------------------------------------------+
void ProgressPercentage(int bar_index,int symbol_number,double &percent)
  {
   string message_text="";
   percent=(double(bar_index)/OC_rates_total)*100;
//---
   if(percent<=9.99)
      message_text="0"+DoubleToString(percent,0);
   else if(percent<99)
      message_text=DoubleToString(percent,0);
   else
      message_text="100";
//---
   msg_last=msg_sync_update="Preparing data ("+(string)OC_rates_total+" bars) : "+
            symbol_names[symbol_number]+
            "("+(string)(symbol_number+1)+"/"+(string)SYMBOLS_COUNT+") - "+message_text+"% ... ";
  }
The indicator buffers are filled in the second main loop of the OnCalculate() function:
//--- Fill indicator buffers
   for(int s=0; s<SYMBOLS_COUNT; s++)
     {
      //--- If the specified symbol does not exist, zero out the buffer
      if(symbol_names[s]==empty_symbol)
         ArrayInitialize(atr_buffers[s].data,EMPTY_VALUE);
      else
        {
         //--- Generate a message
         msg_last=msg_sync_update="Updating indicator data: "+
                      symbol_names[s]+"("+(string)(s+1)+"/"+(string)SYMBOLS_COUNT+") ... ";
         //--- Print the message
         ShowCanvasMessage(msg_sync_update);
         //--- Fill indicator buffers with values
         for(int i=limit; i<rates_total; i++)
           {
            FillIndicatorBuffers(i,s,time);
            //--- Check the subwindow size once every 2000 bars
            //    and if the size has changed, adjust the canvas size to it
            if(i%2000==0)
               OnSubwindowChange();
           }
        }
     }
The highlighted string in the above code contains the FillIndicatorBuffers() function. This is where the final operations are performed prior to displaying plotting series of the indicator in the chart:
//+------------------------------------------------------------------+
//| Filling indicator buffers                                        |
//+------------------------------------------------------------------+
void FillIndicatorBuffers(int bar_index,int symbol_number,datetime const &time[])
  {
//--- For the purpose of checking the obtained indicator value
   bool check_value=false;
//--- Counter of the current time frame bars
   static int bars_count=0;
//--- Zero out the counter of the current time frame bars at the beginning of the symbol's time series
   if(bar_index==0)
      bars_count=0;
//--- If within the area of current time frame bars and the counter is smaller
//    than the specified indicator period, increase the counter
   if(bars_count<IndicatorPeriod && time[bar_index]>=limit_time[symbol_number])
      bars_count++;
//--- If within the indicator area and the time of the current symbol coincides with the time of the specified symbol
   if(bars_count>=IndicatorPeriod &&
      time[bar_index]==tmp_symbol_time[symbol_number].time[bar_index])
     {
      //--- If the value obtained is not empty
      if(tmp_atr_values[symbol_number].value[bar_index]!=EMPTY_VALUE)
        {
         check_value=true;
         atr_buffers[symbol_number].data[bar_index]=tmp_atr_values[symbol_number].value[bar_index];
        }
     }
//--- Set an empty value in case of failure to set a higher value
   if(!check_value)
      atr_buffers[symbol_number].data[bar_index]=EMPTY_VALUE;
  }
At the end of the OnCalculate() function, we need to delete the canvas, set levels, zero out variables of messages and refresh the chart. Finally, the rates_total array size will be returned, following which only the last value will be recalculated at each subsequent tick or timer event in OnCalculate().
These are the strings of code to be inserted between the second main loop and the value returned by the function:
//--- Delete the canvas
   DeleteCanvas();
//--- Set indicator levels
   SetIndicatorLevels();
//--- Zero out variables
   msg_last="";
   msg_sync_update="";
//--- Refresh the chart
   ChartRedraw();
The code of the SetIndicatorLevels() function for setting horizontal levels is as follows:
//+------------------------------------------------------------------------+
//| Setting indicator levels                                               |
//+------------------------------------------------------------------------+
void SetIndicatorLevels()
  {
//--- Get the indicator subwindow number
   subwindow_number=ChartWindowFind(0,subwindow_shortname);
//--- Set levels
   for(int i=0; i<LEVELS_COUNT; i++)
      CreateHorizontalLine(0,subwindow_number,
                            prefix+"level_0"+(string)(i+1)+"",
                            CorrectValueBySymbolDigits(indicator_levels[i]*_Point),
                            1,STYLE_DOT,clrLightSteelBlue,false,false,false,"\n");
  }
//+------------------------------------------------------------------------+
//| Adjusting the value based on the number of digits in the price (double)|
//+------------------------------------------------------------------------+
double CorrectValueBySymbolDigits(double value)
  {
   return(_Digits==3 || _Digits==5) ? value*=10 : value;
  }
The CreateHorizontalLine() function code for setting a horizontal level with the specified properties is as follows:
//+------------------------------------------------------------------+
//| Creating a horizontal line at the price level specified          |
//+------------------------------------------------------------------+
void CreateHorizontalLine(long            chart_id,      // chart id
                          int             window_number, // window number
                          string          object_name,   // object name
                          double          price,         // price level
                          int             line_width,    // line width
                          ENUM_LINE_STYLE line_style,    // line style
                          color           line_color,    // line color
                          bool            selectable,    // cannot select the object if FALSE
                          bool            selected,      // line is selected
                          bool            back,          // background position
                          string          tooltip)       // no tooltip if "\n"
  {
//--- If the object has been created successfully
   if(ObjectCreate(chart_id,object_name,OBJ_HLINE,window_number,0,price))
     {
      //--- set its properties
      ObjectSetInteger(chart_id,object_name,OBJPROP_SELECTABLE,selectable);
      ObjectSetInteger(chart_id,object_name,OBJPROP_SELECTED,selected);
      ObjectSetInteger(chart_id,object_name,OBJPROP_BACK,back);
      ObjectSetInteger(chart_id,object_name,OBJPROP_STYLE,line_style);
      ObjectSetInteger(chart_id,object_name,OBJPROP_WIDTH,line_width);
      ObjectSetInteger(chart_id,object_name,OBJPROP_COLOR,line_color);
      ObjectSetString(chart_id,object_name,OBJPROP_TOOLTIP,tooltip);
     }
  }
Functions for deleting graphical objects:
//+------------------------------------------------------------------+
//| Deleting levels                                                  |
//+------------------------------------------------------------------+
void DeleteLevels()
  {
   for(int i=0; i<LEVELS_COUNT; i++)
      DeleteObjectByName(prefix+"level_0"+(string)(i+1)+"");
  }
//+------------------------------------------------------------------+
//| Deleting vertical lines of the beginning of the series           |
//+------------------------------------------------------------------+
void DeleteVerticalLines()
  {
   for(int s=0; s<SYMBOLS_COUNT; s++)
      DeleteObjectByName(prefix+symbol_names[s]+": begin time series");
  }
//+------------------------------------------------------------------+
//| Deleting the object by name                                      |
//+------------------------------------------------------------------+
void DeleteObjectByName(string object_name)
  {
//--- If such object exists
   if(ObjectFind(0,object_name)>=0)
     {
      //--- If an error occurred when deleting, print the relevant message
      if(!ObjectDelete(0,object_name))
         Print("Error ("+IntegerToString(GetLastError())+") when deleting the object!");
     }
  }
The following code should be added to the OnDeinit() function:
Now everything is ready and can be tested thoroughly. The maximum number of bars in the window can be set in the Charts tab of the terminal settings. How fast the indicator will be ready to run is conditional on the number of bars in the window.

Fig. 1. Setting the maximum number of bars in the terminal settings
When loading the indicator to the chart, you can see the progress of data preparation for all symbols:

Fig. 2. The message on the canvas during data preparation
Below you can see the screenshot displaying the indicator on a 20-minute time frame:

Fig. 3. Multi-symbol ATR indicator on a 20-minute time frame
The beginning of 'true' bars is marked in the chart with the vertical lines. The screenshot below shows that true bars for NZDUSD (yellow line) start from 2000 (MetaQuotes-Demo server), while for all other currency pairs true bars appear in early 1999, which is why only one line is displayed (all of them are on the same date). We can also notice that period separators have a smaller interval prior to 1999 and if you analyze the time of the bars, you will be able to see that these are daily bars.
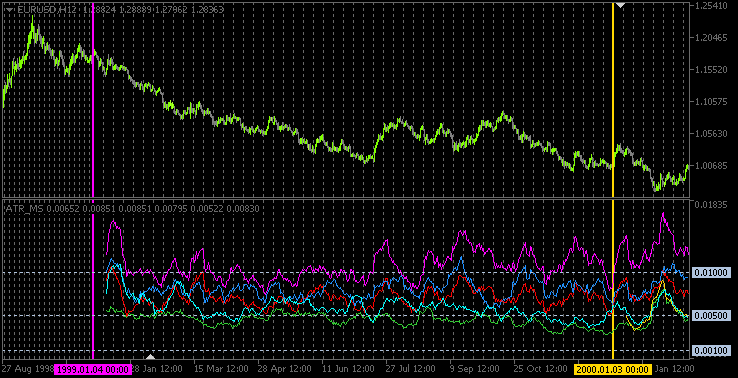
Fig. 4. The vertical lines mark the beginning of true bars for each symbol
Conclusion
The article can be finished here. The source code described is attached to the article and is available for download. In one of the future articles, we will try to implement a trading system that would analyze volatility and see what comes out of it.