Extract profit down to the last pip
fxsaber | 5 August, 2019
Introduction
This article covers one of algo trading approaches. It is not directly related to MetaQuotes platforms and is intended for broad masses. If any of the terms is not clear for you, please use search options. The purpose of this article is to find a profitable trading system (or a trading robot).
Where to dig?
This is what each trader is trying to find out. Millions of attempts have already been made. If you are satisfied with existing solutions, you can skip this article and switch to the next one. But a more logical solution is to search for a treasure where it has not been searched by a crowd.
Soil
Most of discussions concerning the creation of Trading Systems is connected with the use of historic bars and various indicators applied thereon. This is the most well covered field and thus we will not consider it. Bars represent a very artificial entity; therefore we will work with something closer to proto-data, namely the price ticks. This approach may give us some informational advantage over the crowd.
Shovel
The task of profit earning is quite difficult. Therefore, an opinion exists that the task should be solved by complex intellectual methods. These include machine learning, econometric math models, etc. All of them have a very significant drawback: long creation and testing period (due to computational complexity). Therefore, let's go the opposite way, which involves very simple and quick ideas. Thus, we will be able to search for market patterns not in a specific location, but at a very extensive scope.
This method may seem stupid. But there is so much information around, that it’s inefficient to look for treasure in one specific place using an archaeological tassel. Therefore, we need a very good research tool. This tool must be able to work with millions of any ticks. It must be fast. It must be able to conveniently visualize found results. It must have short and clear instructions.
Archaeological excavator
It is great if you can use any mathematical package and have ready developments which meet the above requirements. If not, let us use the Strategy Tester from the MetaTrader 5 platform and use all its advantages.
This tool incorporates a huge number of ticks from different brokers, and it can additionally work with other ticks. It stores in its database calculation results and can visualize various parameters. It also has its own multithreaded optimizer based on full testing of all variations and a genetic algorithm based on user criteria.
Trading Algorithm
We also need a simple and fast idea in the form of a trading algorithm. The idea can be any. The most important criterion is its speed. It is also recommended that you avoid loops inside algorithms. Receive a new tick, perform a fast action and exit.
One of the variants of such an algorithm is used as the basis of this article. This may seem to be the article core, which needs to be disclosed for clarity. But it is not. The purpose of the article is not this specific algorithm. That is why it is hidden.
MQL5
The trading algorithm is created as an Expert Advisor in the MQL5 language. We decided not to use bars and indicators. Thus, we will have to work with ticks and orders (the history of orders). Such Expert Advisors can be conveniently written in MQL4 and then converted to MQL5 in one line, using the MT4Orders trading library.
#include <MT4Orders.mqh> // https://www.mql5.com/en/code/16006
We can create a cross-platform code (which can operate in MetaTrader 4/5) while using some very useful libraries. The trading algorithm must be fast and require minimum of checks in the Tester.
Source
Where can we get price data for research? There are many sources of ticks. Let us choose one of them.
Chances of finding a gold nugget are probably higher when you are dealing with the rock having higher concentration of gold. Therefore, we will use tick source with a higher potential profit. The method of determining such a comparative criterion was described in a forum comment (in Russian, use built-in translation option). Based on this method, I selected multi-gigabyte this archive of tick data. Billions of ticks.
Custom ticks
Ticks can be fed into the MetaTrader 5 tester using custom symbols. This may be too complicated for fast understanding, therefore we will use a ready script ThirdPartyTicks, which creates such symbols based on data from the selected archive of quotes.

Fuel additive
Billions of ticks need to be processed over reasonable time. We need to generate trillions of ticks for trading algorithm input when searching for regularities. It is very time consuming and we therefore need an acceleration mechanism.
Actually, not every tick is needed. Since we know our trading algorithm, we must understand which tick do not lead to trade changes. It means we can identify empty ticks and remove them from history. This filtering is very efficient:
Total Ticks (EURAUD.rann) = 61354152 (2134296 ticks/sec.), Reserve = 80023750
Recording...
After Filter (MinPips = 5) Ticks = 7820486 (12.75%)
The log shoes that the number of ticks has reduced almost by an order of magnitude.
The MetaTrader 5 tester is sometimes very meticulous (which can definitely be useful) and it performs a large amount of calculations which may be unnecessary for the analysis under consideration (sometimes they are erroneous). This can be avoided if you know the details of its operation, but we will not consider them now. There is a forum discussion concerning this topic (in Russian).
Here is what we need for a trading algorithm in MQL5:
- Opening/closing positions only using limit orders.
- Netting logic. Also, a netting account should be opened in MetaTrader 5.
- Trading 1 lot — Profit in pips.
- Launch on the server where there is no commission for custom symbols in the Tester.
- Custom symbol should be set "exchange".
A single launch result should be as follows

The highlighted column shows that position reversals are performed using limit orders. They are all executed at exactly the requested price. Accurate execution at the requested price is very important.
Trick
Market behavior depends on the time of day. Therefore, let us use the BestInterval library: for this write two lines in EA source code:
#define BESTINTERVAL_ONTESTER // Optimization criterion - profit of the best interval.
#include <fxsaber\BestInterval\BestInterval.mqh> // Calculating the best trading interval
This will provide additional input parameters in the EA

We will optimize by the BestInterval criterion, which is equal to the highest profit shown by the EA when trading only at the specific time of the day.
Excavator
We have prepared the trading algorithm. Filtered custom ticks are also ready. Now we need to somehow combine them via the MetaTrader 5 tester. This can be solved through the MultiTester solution It will automatically use take every custom symbol and will perform EA optimization using this symbol.
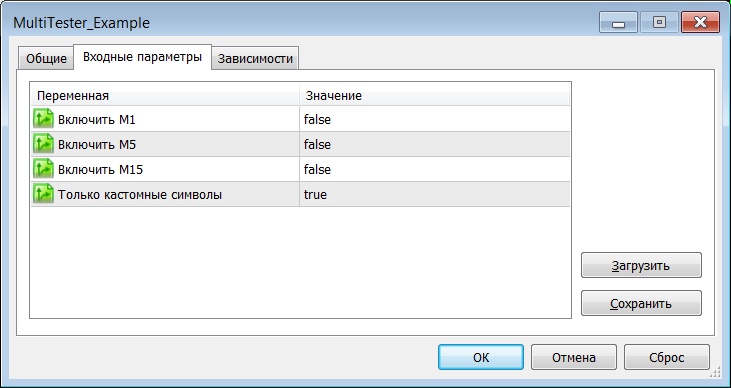
Optimization interval
There is no point in optimizing the EA over the entire history - it will be hard to understand if it is a regularity or over-fitting. Since we are guided by "numerical thresher" calculations, let us count on a large number of deals.
The more deals are better for statistical conclusions. The smaller the deal lifetime, the lower the risk. In general, a large number of deals is good. Although it is not properly explained here.
Moreover, we need a high frequency of deals, therefore we can select a small interval. It may still include a good number of deals.

This is a little less than the last four months.
Let's get started.
Artifacts
All calculations on 81 symbols (all data from the archive source) were performed in 10 hours, some of which we used for the author's sleep. Therefore, it is convenient to run testing at night. Since the MetaTrader 5 tester is multi-core, this also provides 10 hours of additional heating.
Check optimization cache in the MetaTrader 5 tester database.

Open a record from the database and view corresponding optimization results for the selected symbol.
All variants (81) were checked manually. This process can be automated, but it is not implemented yet, therefore I had to spend an hour for this. Let us analyze one of the symbols as an example. The same was done for each of the symbols.

Here if the optimization result for one symbol sorted by the BestInterval criterion. The advantage of custom symbols is that there is no limit on negative balance. That is the balance size does not affect trading so do not pay attention to this.
We seek for a large number of deals. Therefore, select one of the records in the red column and run a single test. Its trading chart is shown below:

This is a round-the-clock trade. The following record can be found at the end of the single test:
BestInterval Action(true - single pass & MT4-style & Virtual is required) = false

Profit = -2392.00 = -2392.00 + 0.00 (0.00%) - Amount of Delete Intervals = 0 (2019.04.01 - 2019.07.20)
00:00:00 - 23:59:59 : Profit = -2392.00 (100.00%), Total = 2612 (70.64%), PF = 0.94, Mean = -0.92, DD = 3840.00, RF = -0.62
SUMMARY: 00:00:00 - 23:59:59 : Profit = -2392.00 (100.00%), Total = 2612 (70.64%), PF = 0.94, Mean = -0.92, DD = 3840.00, RF = -0.62

Profit = 4035.00 = -2392.00 + 6427.00 (-268.69%) - Amount of Delete Intervals = 1 (2019.04.01 - 2019.07.20), 20:00 - 08:00, CountHours = 11
00:00:00 - 07:58:54 : Profit = 1074.00 (26.62%), Total = 349 (76.22%), PF = 1.21, Mean = 3.08, DD = 709.00, RF = 1.51
19:41:38 - 23:59:59 : Profit = 2961.00 (73.38%), Total = 348 (76.44%), PF = 1.94, Mean = 8.51, DD = 358.00, RF = 8.27
SUMMARY: 00:00:00 - 23:59:59 : Profit = 4035.00 (100.00%), Total = 697 (76.33%), PF = 1.49, Mean = 5.79, DD = 484.00, RF = 8.34
BestInterval is saved in "TesterEA"-file in common(MT5)/base(MT4) folder.

final balance - InitBalance (10000.00) + Profit (-2392.00) without BestInterval.
OnTester - Profit (4035.00) with BestInterval.
final balance 7608.00 USD
OnTester result 4035
It follows from the record that in order to achieve the profit of 4035 pips, the one should trade from 8 pm to 8 am. To see what trading looks like, go to input parameters and indicate the need to activate BestInterval.

Make sure to disable the Optimization mode in MetaTrader 5. Here is how you should disable it:

Start and watch the BestInterval usage results.
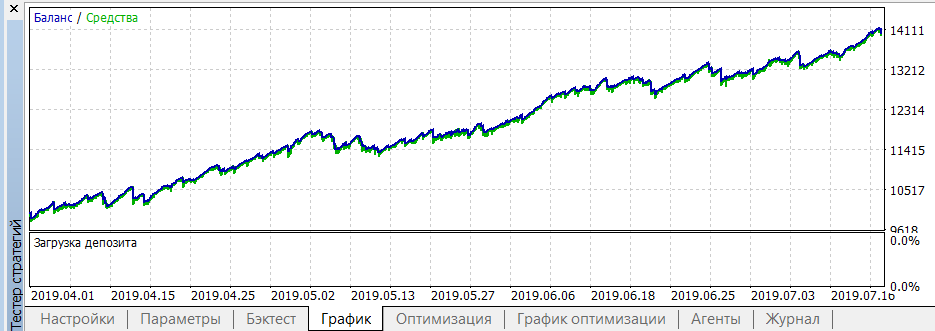
Check single-test logs to make sure it performed well
BestInterval Action(true - single pass & MT4-style & Virtual is required) = true
Calculation time activated intervals is 2019.07.23 16:27:25 - TesterEA (common folder) 00:13:14 ago.

Amount of Delete Intervals = 1 (2019.04.01 - 2019.07.20), 20:00 - 08:00, CountHours = 11
00:00:00 - 07:58:54 : Profit = 1074.00 (26.62%), Total = 349 (76.22%), PF = 1.21, Mean = 3.08, DD = 709.00, RF = 1.51
19:41:38 - 23:59:59 : Profit = 2961.00 (73.38%), Total = 348 (76.44%), PF = 1.94, Mean = 8.51, DD = 358.00, RF = 8.27
SUMMARY: 00:00:00 - 23:59:59 : Profit = 4035.00 (100.00%), Total = 697 (76.33%), PF = 1.49, Mean = 5.79

final balance - InitBalance (10000.00) + Profit (4035.00) with BestInterval.
OnTester - Virtual InitBalance (10000.00) + Profit (-2403.00) without BestInterval. Profit is calculated with TickValue=1 and w/o Commission+Swap.
final balance 14035.00 USD
OnTester result 7597
The result seems to be good. There are a lot of deals and the balance graph is quite smooth. But now it is necessary to launch the EA in the entire history.

Every time we will get an awful chart showing that we have mathematical overfitting of results in the optimization interval. But the results do not work in other periods. Therefore, if you launch this strategy in real trading, you will lose your deposit.
Forward testing
The MetaTrader 5 Tester supports the forward testing mode. In my opinion, such testing is self-deception. Thus, a better solution is to check two-three good results in the entire history. If none of the results performs well in the entire history, don't use the strategy. Forward test performs much more results, which is also kind of overfitting.
Gold
Will the graph be always so bad? It is true with our case - optimized values show bad results when tested in the entire available history.

The optimized interval is shown in red. As you can see, a good stability is observed if the testing period is much longer than the optimized interval.
Jewelry etching
After all tests it has become clear what symbol to choose for further work: EURCHF. The report of the above shown test:

The mathematical expectation in pips is highlighted in red. This is a very important parameter! Commission for EURCHF is about 4.40 pips. This means that two thirds of the profit will be taken by the broker. That's too much.
Delete BestInterval and add an input to adjust trading time. Let's start optimizing from the end of the largest drawdown time, which is marked with green in above graph. If there are a lot of parameters, perform genetic optimization several times.
To avoid strong distortion when searching for regularities during optimization remove the non-system data.
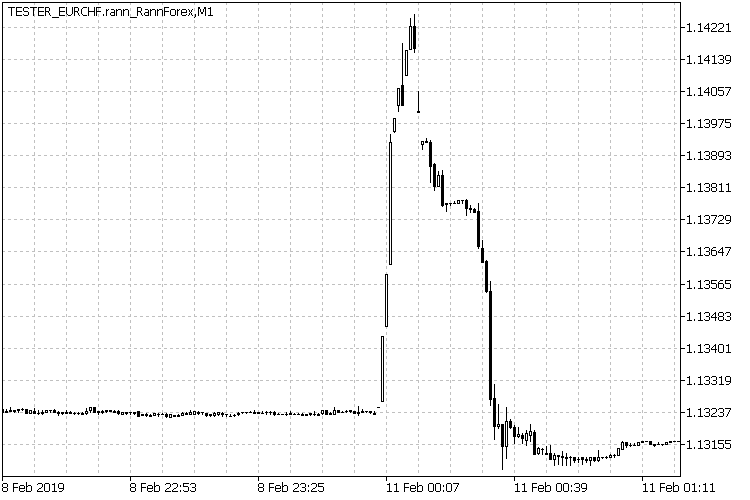
For this, write the following in the source code:
const bool TradeTime = (TimeCurrent() < D'2018.02.10') || (TimeCurrent() >= D'2018.02.12');
As a result, we managed to increase the mathematical expected payoff twice, in the unfiltered symbol.
Martingale/Grid
Of course, I tried to apply additional methods, such as order grids and others. Firstly, I was happy to see the growth in math payoff. But I could not explain the reason. I found out that the MetaTrader 5 tester uses a different calculation on netting accounts. So the calculated value show not what we expect to see. I wrote the proper calculation:
// Calculating expected payoff on hedging accounts corresponds to traditional calculation.
double OnTester()
{
  double Res = 0;

  if (HistorySelect(0, INT_MAX))
    for (int i = HistoryDealsTotal() - 1; i >= 0; i--)
      Res += HistoryDealGetDouble(HistoryDealGetTicket(i), DEAL_VOLUME);

  Res /= 2;

  if (Res)
    Res = TesterStatistics(STAT_PROFIT) / Res;

  return(Res);
}
The result fully confirmed the theory that a grid cannot improve a well optimized trading strategy. This is a precise but concise conclusion.
Monetization
Now we need to determine how to trade the idea. Review trading conditions of different brokers (including price history) and especially check the implementation of limit orders. Some of the brokers execute limit orders through market orders allowing negative slippage. Some of the orders forbid partial filling of limit orders. Avoid such brokers because every pip is important for us (see the title of the article). Therefore, we must be extremely careful when selecting trading conditions.
The trading strategy itself implies a large number of trades.
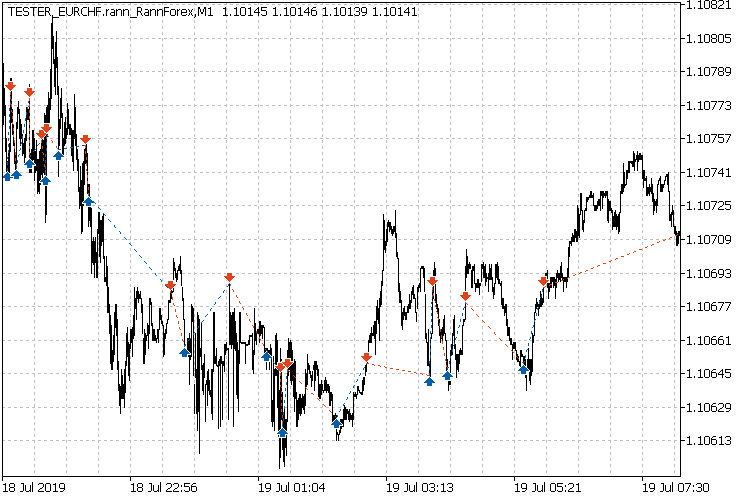
I managed to find a suitable place to trade. The initial limit orders here quickly reach the liquidity provider and thus the chances of order filling are increased. Another possible bonus here is the possible slippage. Each pip in the math expectation is important. This allows covering at least part of commission fees.
Live trading
Live trading was performed in the MetaTrader 4 platform. Thus, I used the cross-platform feature.
To achieve the maximum correspondence of real and testing results, I had to implement the following operating scheme.
- Upon the Expert Advisor launch, the tick history up to the current state is accessed using the HistoryTicks library.
- The Expert Advisor is automatically adjusted to this tick history in the virtual environment using the Virtual library.
- The whole trading history with the specified EA settings, up to the present moment is shown in the browser. This enables the minimizing of the probability of errors in input values. If there is a loss, then there must be an error.
- The EA continues trading in the virtual environment at teach tick. If the EA is turned off, after re-start it will continue trading as if there was no stop.
- The non-ideal real environment is constantly synchronized with the virtual environment, where the execution is perfect.
All these steps were need in order to increase math payoff However I would apply these steps for almost any trading system. Of course, you can omit this part if you don't want to bother. However, I see how these steps can really help in real trading. The steps are especially important for this trading strategy.
Diversification
Choosing only one set of input values is not enough. We cannot know in advance which of the optimization variants will show good performance in the future.
Therefore, I quickly selected eight variants and equally divided balance between them. All of them were launched simultaneously (eight charts with one ea having an individual MagicNumber running on it). This may look like a grid. But it has nothing to do with grid trading systems. These are eight independent trading systems.
Pie cake
Suppose you launched the trading systems. What can you do next? There are several ways. From trust management and PAMMs to Signals copying services.
Since we are talking about grabbing profit pip by pip, the strategy can be offered as a Signal only for PR purposes. Subscribers will not be able to profit, because they will have negative slippage when copying trades. Thus, the math expected payoff will become negative for them. It means that most probably subscribers will lose money.
When a trading method is publicly published, this can cause reverse engineering of the entire system or its basic principles. This is another possibility to benefit from a publicly available system.
Also, there is a possibility to view how a seemingly good system loses the deposit. This is unavoidable.
Memoirs
During a research related to any specific topic you come across various situations. I also remember a few cases. EURDKK was mentioned in this thread (in Russian).
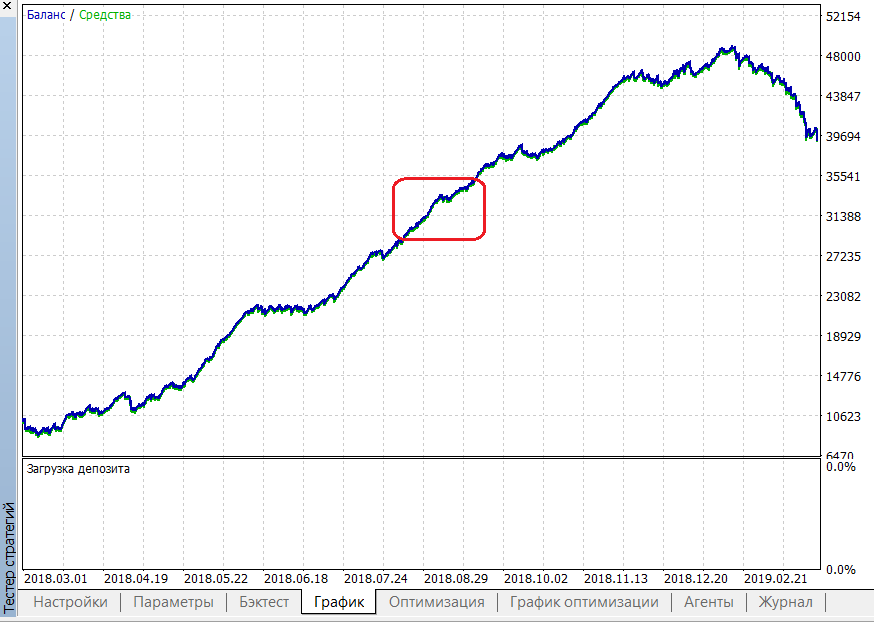
This figure shows performance of a trading system which was optimized in the red interval. I cannot reproduce it now. But I remember that the picture to the left of the optimization interval was better and was represented as a straight line. This was almost a grail, which was run on a real account and showed performance similar to that in the Tester. After New Years it started to lose consistently. I was wise enough to stop trading. I lost about 10% of the earlier earned funds. I still don't know what caused this.
The most important conclusion here is that even an almost a grail causes losses. But I remembered this case for the other reason,
which is the NOKSEK symbol. Have you ever paid attention to this symbol? Why?
Conclusions
The article contains a certain philosophical struggle: the "numerical thresher" against the classical intellectual approach. You can choose the suitable solution for yourself.
Some tricks and ideas may be helpful.
There is an interesting statement behind all considerations within this article: if you have a profitable trading system in your hands, then it is likely that you will never know about it. I think many good systems were thrown away. The article has shown that testing a trading system is not only launching it in one/two symbols.
You should test different times of the day. Monte Carlo method is not desirable. This can spoil conclusions regarding the system profitability.
Universal systems are unlikely to extract profit. You can struggle for every pip.
As for the MetaTrader 5 Tester, sometimes it is great! Sometimes it is disappointing, but without the Tester it would be impossible to do such a study. Thanks to the developers! I hope improved versions will be released in future.
What else
I couldn't include the following into this article:
- Other symbols.
- Calculation of slippages in MetaTrader 5.
- Demonstration of how the commission is covered by the positive slippage of limit orders.
- Demonstration of that the currently available MetaTrader 5 Take Profit is not suitable for use.
- The effect of swaps on the results.
- EURCHF system shows very similar losing results in two Mays (2018 and 2019).
- Creation of criteria for assessing the trading system validity through the auto optimizer.
- Creation of mixed symbols.
- The importance of full parameter testing before genetic optimization.
- The reversion of a symbol should not affect the found regularities and the trading system performance.
- Interpretation of Tester results is important.
- Spread or local extremes.