MQL5 Cookbook: Handling Typical Chart Events
Denis Kirichenko | 13 October, 2014
Introduction
In my article I would like to describe the capabilities and hands-on practice of using OnChartEvent() with typical (standard) events predefined by MQL5 developers. The MQL5 articles and Code Base already contain examples of using this handler.
However, my purpose is to analyze this instrument in the context of Event-Oriented Programming (EOP). I believe that this handler can be successfully used for fully automatic and semi-automatic trading systems.
1. "ChartEvent" Event
So, first let's see what this type of event is.
According to the Documentation, the ChartEvent event may appear when working with a chart, in particular when:
- pressing a key on the keyboard when a chart window is in focus.
- creating a graphical object.
- deleting a graphical object.
- clicking on a graphical object.
- dragging a graphical object with a mouse.
- finishing to edit text in a text field of a LabelEdit graphical object.
Thus, this event brings interactivity and allows interacting with a chart. Moreover, such an interaction may be a result of manual trading, as well as of some algorithmic operations (automated trading).
MQL5 developers classify the ChartEvent event by types specified in the ENUM_CHART_EVENT enumeration.
It is important to note that this list has a range of user-defined events, that act as a hidden reserve to serve the programmer. MQL5 developers provide 65535 IDs for custom events.
To work with custom events, a special generator function EventChartCustom() is available for programmer's needs. However, this article does not consider custom events.
2. ChartEvent Handler and Generator
All the processing of the ChartEvent event is done by a special handler function OnChartEvent(). This is consistent with the MQL5 language concept, where for example the Trade event is handled by the OnTrade() function, the Init event is handled by the OnInit() function, etc.
The OnChartEvent() function has the following signature:
void OnChartEvent(const int id,         // event identifier
                  const long& lparam,   // parameter of the event of type long
                  const double& dparam, // parameter of the event of type double
                  const string& sparam  // parameter of the event of type string
                  )
All the input parameters are constant, and when the handler is called they convey some useful information.
Thus, the value of the id parameter can reveal what particular event has called the handler. Others may have values of types long, double and string. This way additional information about an event can be obtained.
Later on, we shall create an example where the values of specified parameters will be used to analyze what is going on.
The custom part of the ChartEvent event, which is up for a programmer to implement, is connected to the EventChartCustom() function. This very function can generate the event. The function signature is as follows:
bool  EventChartCustom(long    chart_id,        // receiving chart identifier
                       ushort  custom_event_id, // event identifier
                       long    lparam,          // the long parameter
                       double  dparam,          // the double parameter
                       string  sparam           // the string parameter
                       )
In fact, the generator function can create an event and send it to any chart including the current one with any values of input parameters. The latter are the types: ushort, long, double, string.
The OnChartEvent() and EventChartCustom() functions together form a powerful tool which is a good example of Event-Oriented Programming benefits.
3. Standard Event Processing Template
Now I am going to consider the types of chart events and give an example for each of them. Each event will have its own dedicated version of EventProcessor.mq5 and its code will contain handling of a chart event. There are 10 typical events in MQL5.
For three of them (mouse event, graphical object creation event, graphical object removal event) we need to prepare a chart. It can be done by using the ChartSetInteger() function. It allows a chart to respond to specified events.
A typical block for processing chart events could look like:
void OnChartEvent(const int id,
                  const long   &lparam,
                  const double &dparam,
                  const string &sparam)
  {
   string comment="Last event: ";

//--- select event on chart
   switch(id)
     {
      //--- 1
      case CHARTEVENT_KEYDOWN:
        {
         comment+="1) keystroke";
         break;
        }
      //--- 2
      case CHARTEVENT_MOUSE_MOVE:
        {
         comment+="2) mouse";
         break;
        }
      //--- 3
      case CHARTEVENT_OBJECT_CREATE:
        {
         comment+="3) create graphical object";
         break;
        }
      //--- 4
      case CHARTEVENT_OBJECT_CHANGE:
        {
         comment+="4) change object properties via properties dialog";
         break;
        }
      //--- 5
      case CHARTEVENT_OBJECT_DELETE:
        {
         comment+="5) delete graphical object";
         break;
        }
      //--- 6
      case CHARTEVENT_CLICK:
        {
         comment+="6) mouse click on chart";
         break;
        }
      //--- 7
      case CHARTEVENT_OBJECT_CLICK:
        {
         comment+="7) mouse click on graphical object";
         break;
        }
      //--- 8
      case CHARTEVENT_OBJECT_DRAG:
        {
         comment+="8) move graphical object with mouse";
         break;
        }
      //--- 9
      case CHARTEVENT_OBJECT_ENDEDIT:
        {
         comment+="9) finish editing text";
         break;
        }
      //--- 10
      case CHARTEVENT_CHART_CHANGE:
        {
         comment+="10) modify chart";
         break;
        }
     }
//---
   Comment(comment);
  }
In each case I added the string describing a selected event. As a result, in the comment line we can see the last event happened on the chart. If you run the template and perform various manipulations with the chart, you will notice that the comment line may have different records.
Obviously, there is little use of such an Expert Advisor that only determines the type of event. We need to extend its capabilities.
4. Standard Event Processing Examples
4.1. Keystroke Event
Let's take the first case and work with buttons on the keyboard, so that our EA will respond to keystrokes. Let it buy when pressing the "up arrow", and sell when pressing the "down arrow". Then this case will look as follows:
//--- 1
      case CHARTEVENT_KEYDOWN:
        {
         //--- "up" arrow
         if(lparam==38)
            TryToBuy();

         //--- "down" arrow
         else if(lparam==40)
            TryToSell();

         comment+="1) keystroke";
         //---
         break;
        }
See the attached EA source code for details of the TryToBuy() and TryToSell() implementation. Trading parameters (lot size, Stop Loss, Take Profit, etc.) are specified as input variables (InpLot, InpStopLoss, InpTakeProfit, etc.). It should be also mentioned, that parameter lparam gets the code of the pressed key.
The updated version of the EA is called EventProcessor1.mq5.
4.2. Mouse Event
This type of the event will be handled only if the property CHART_EVENT_MOUSE_MOVE has been specified for the chart. For this reason the initialization block of the EA contains such strings:
//--- mouse move
bool is_mouse=false;
if(InpIsEventMouseMove)
   is_mouse=true;
ChartSetInteger(0,CHART_EVENT_MOUSE_MOVE,is_mouse);
It should be noted that if you use a mouse, then, naturally, a mouse event will often take place. For that reason an opportunity to disable processing of this event may be useful. The lparam and dparam parameters of the handler are reporting coordinates X and Y accordingly.
We are going to discuss a made up example. Let us suppose that there is a zero bar shift from the right border. Hovering a cursor over the part of the screen to the right from the shift will bring up a window suggesting to buy or sell.
To do that we first have to determine the shift. We are going to introduce an input variable for determining the size of a zero bar shift from the right border in percents (InpChartShiftSize).
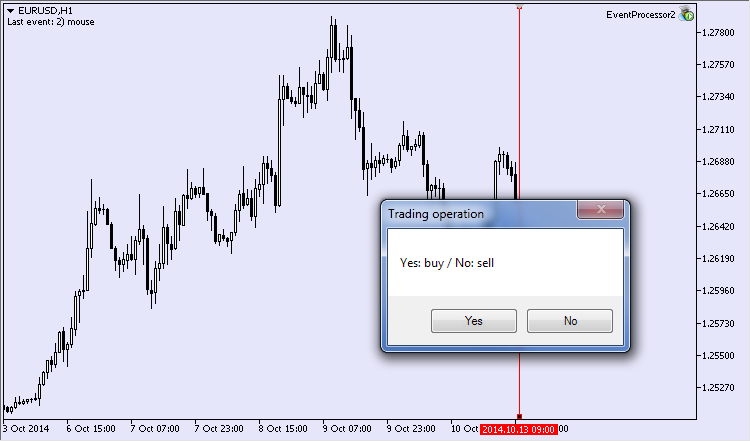
Fig.1 Window of a trade operation
We are going to use the functions that enable the shift and determine its size ChartShiftSet()and ChartShiftSizeSet(). Then we shall identify if the X-coordinate of the cursor was previously on the left from the border and if it has moved to the right. If it has, then a window suggesting to buy/sell will appear (Fig.1).
The code implementing the set target looks like:
//--- 2
      case CHARTEVENT_MOUSE_MOVE:
        {
         comment+="2) mouse";
         //--- if a mouse event is processed
         if(InpIsEventMouseMove)
           {
            long static last_mouse_x;

            //--- enable shift
            if(ChartShiftSet(true))
               //--- set shift size
               if(ChartShiftSizeSet(InpChartShiftSize))
                 {
                  //--- chart width
                  int chart_width=ChartWidthInPixels();

                  //--- calculate X coordinate of shift border
                  int chart_shift_x=(int)(chart_width-chart_width*InpChartShiftSize/100.);

                  //--- border crossing condition
                  if(lparam>chart_shift_x && last_mouse_x<chart_shift_x)
                    {
                     int res=MessageBox("Yes: buy / No: sell","Trade operation",MB_YESNO);
                     //--- buy
                     if(res==IDYES)
                        TryToBuy();
                     //--- sell
                     else if(res==IDNO)
                        TryToSell();
                    }

                  //--- store mouse X coordinate
                  last_mouse_x=lparam;
                 }
           }

         //---
         break;
        }
Buying and selling is done by the previously created trade functions. The updated version of the EA will be named EventProcessor2.mq5.
4.3. Graphical Object Creation Event
This type of event is generated when an object is created on a chart. Similar to a mouse event, this type has to receive a permission for handling with the property CHART_EVENT_OBJECT_CREATE. It needs to be specified only once in the block of initialization if we are going to respond to the appearance of a new graphical object.
//--- object create
bool is_obj_create=false;
if(InpIsEventObjectCreate)
   is_obj_create=true;
ChartSetInteger(0,CHART_EVENT_OBJECT_CREATE,is_obj_create);
Only one parameter of the handler is going to contain information. It is a string parameter sparam that holds the name of created graphical object. We can find that object by the name, deal with it and then decide what to do next.
Here is a simple example. We are going to draw a horizontal line on the chart and let the robot place it at the maximum price of all bars reflected on the chart and draw two other lines. The lower line will be placed at the minimum price and the third line will be between the first two ones equidistant from both.
The code for the implementation of the task:
//--- 3
      case CHARTEVENT_OBJECT_CREATE:
        {
         comment+="3) create graphical object";
         //--- if graphical object creation event is processed
         if(InpIsEventObjectCreate)
           {
            //--- capture creation of horizontal line
            int all_hor_lines=ObjectsTotal(0,0,OBJ_HLINE);

            //--- if this is the only line
            if(all_hor_lines==1)
              {
               string hor_line_name1=sparam;

               //--- calculate levels
               int visible_bars_num=ChartVisibleBars();

               //--- arrays for high and low prices
               double highs[],lows[];
               //---
               int copied=CopyHigh(_Symbol,_Period,0,visible_bars_num-1,highs);
               if(copied!=visible_bars_num-1)
                 {
                  Print("Failed to copy highs!");
                  return;
                 }
               copied=CopyLow(_Symbol,_Period,0,visible_bars_num-1,lows);
               if(copied!=visible_bars_num-1)
                 {
                  Print("Failed to copy lows!");
                  return;
                 }
               //--- high and low prices
               double ch_high_pr,ch_low_pr,ch_mid_pr;
               //---
               ch_high_pr=NormalizeDouble(highs[ArrayMaximum(highs)],_Digits);
               ch_low_pr=NormalizeDouble(lows[ArrayMinimum(lows)],_Digits);
               ch_mid_pr=NormalizeDouble((ch_high_pr+ch_low_pr)/2.,_Digits);

               //--- place created line on high
               if(ObjectFind(0,hor_line_name1)>-1)
                  if(!ObjectMove(0,hor_line_name1,0,0,ch_high_pr))
                    {
                     Print("Failed to move!");
                     return;
                    }
               //--- create line on low
               string hor_line_name2="Hor_line_min";
               //---
               if(!ObjectCreate(0,hor_line_name2,OBJ_HLINE,0,0,ch_low_pr))
                 {
                  Print("Failed to create the 2nd horizontal line!");
                  return;
                 }
               //--- create line between high and low
               string hor_line_name3="Hor_line_mid";
               //---
               if(!ObjectCreate(0,hor_line_name3,OBJ_HLINE,0,0,ch_mid_pr))
                 {
                  Print("Failed to create the 3rd horizontal line!");
                  return;
                 }
              }
           }
         break;
        }
The name of the updated version of the EA is EventProcessor3.mq5.
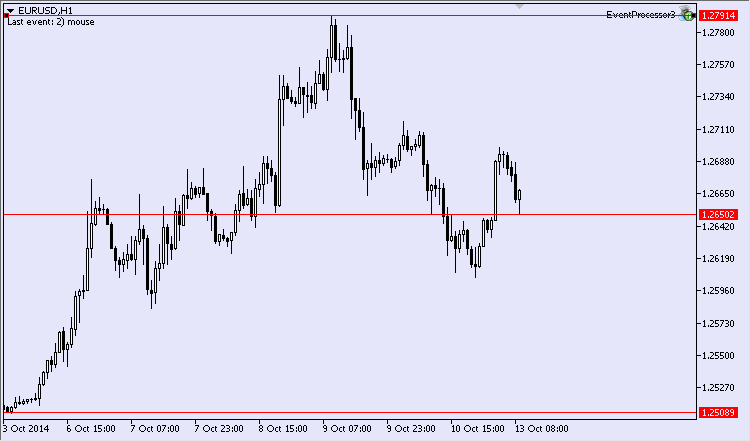
Fig. 2. Result of handling event of a graphical object creation
After I completed the procedure, I received the following picture (Fig. 2). So, the integrated functions give an EA a capability to react to a creation of a graphical object and then act on it.
4.4. Event of Changing Properties of a Graphical Object through a Properties Dialog
This event type is partially similar to the previous one. It triggers when one of the properties of a graphical object gets changed through a properties dialog. This tool might be useful, for example, for synchronizing of graphical properties of objects of the same type.
Imagine a number of some objects on a chart. A trader usually has a lot of various lines on a chart. These lines need to be made invisible for some time without getting deleted. We are going to find a solution to this task. The changed line can be decolored and the same can be done to other graphical objects. Then the code could be as follows:
//--- 4
      case CHARTEVENT_OBJECT_CHANGE:
        {
         comment+="4) change object properties via properties dialog";
         //---
         string curr_obj_name=sparam;
         //--- find the changed object
         if(ObjectFind(0,curr_obj_name)>-1)
           {
            //--- get object color
            color curr_obj_color=(color)ObjectGetInteger(0,curr_obj_name,OBJPROP_COLOR);
            //--- total number of objects on chart
            int all_other_objects=ObjectsTotal(0);
            //--- find other objects
            for(int obj_idx=0;obj_idx<all_other_objects;obj_idx++)
              {
               string other_obj_name=ObjectName(0,obj_idx);
               if(StringCompare(curr_obj_name,other_obj_name)!=0)
                  if(!ObjectSetInteger(0,other_obj_name,OBJPROP_COLOR,curr_obj_color))
                    {
                     Print("Failed to change the object color!");
                     return;
                    }
              }
            //--- redraw chart
            ChartRedraw();
           }
         //---
         break;
Let's assume that there is a set of lines on the chart (Fig.3).
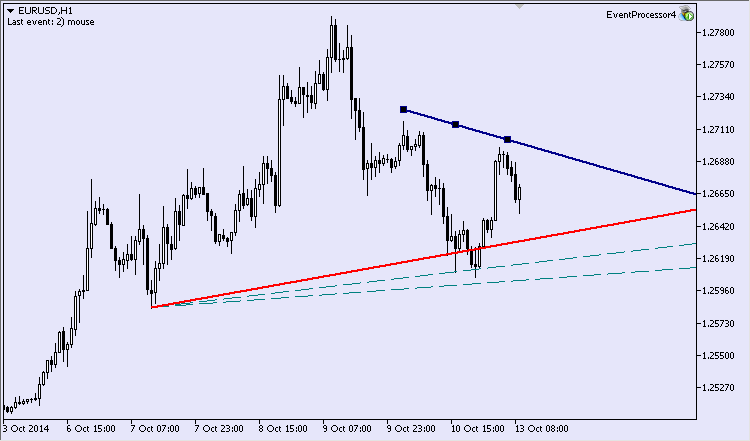
Fig.3. Multi-colored dynamic lines
If we try to change the color of any of the lines, or to be precise, decolor it (Fig.4) in the properties dialog, then there will be no lines visible on the chart. At the same time, the graphical objects will still be present there.
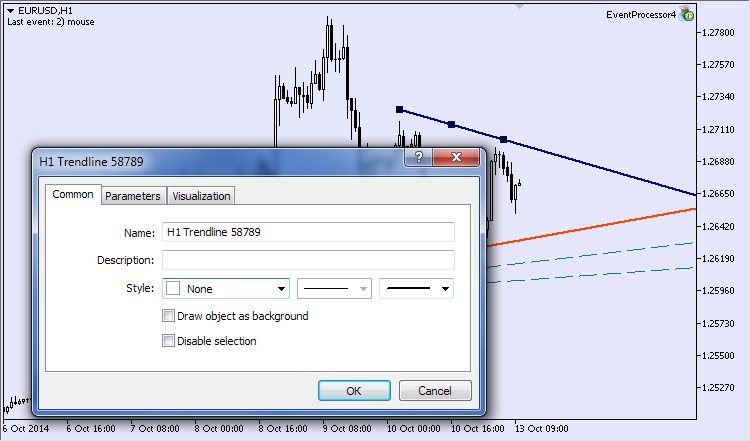
Fig.4. Changing a line color
The updated version of the EA is called EventProcessor4.mq5.
4.5. Graphical Object Deletion Event
As the name of this event type implies, it appears on deletion of an object from a chart. It is the last event of a group, that requires a direct preceding authorization for handling. It can be done through the property CHART_EVENT_OBJECT_DELETE.
//--- object delete
   bool is_obj_delete=false;
   if(InpIsEventObjectDelete)
      is_obj_delete=true;
   ChartSetInteger(0,CHART_EVENT_OBJECT_DELETE,is_obj_delete);
Here is another hypothetical example. On the chart where your EA is attached, there is a set of graphical objects of different types. Let's assume that we need to delete objects of only one particular type. For instance, vertical lines (Fig.5).
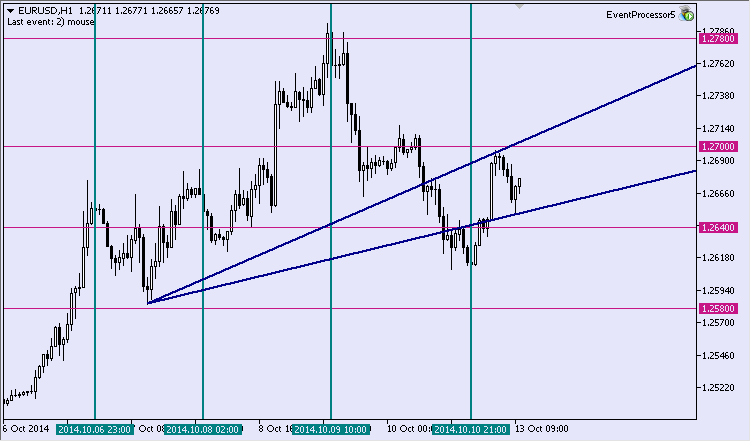
Fig.5. Five verticals and other lines
We need to remove only one vertical and the Expert will remove the others (Fig.6).
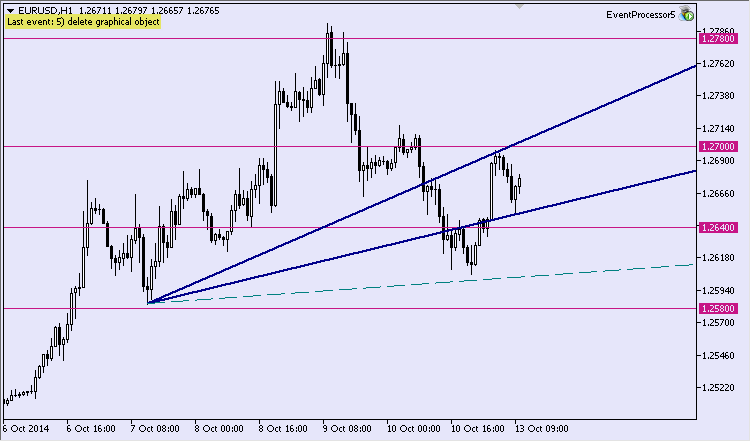
Fig.6. Remaining lines
The following entries will appear in the register "Experts":
NS      0       10:31:17.937    EventProcessor5 (EURUSD.e,W1)   Vertical lines before removing: 4
MD      0       10:31:17.937    EventProcessor5 (EURUSD.e,W1)   Vertical lines removed from the chart: 4
QJ      0       10:31:18.078    EventProcessor5 (EURUSD.e,W1)   Vertical lines after removing: 0
An important aspect must be mentioned. Once an object is removed, there is no access to its properties. It means that if we do not retrieve the required data on the object beforehand, then it will not be accessible after it was removed. Therefore, if we need to find out the type of a removed object, we must store it before the object itself is removed. I have a suggestion for the MQL5 developers to create a history of a chart available in the terminal. That will let us refer to the properties of removed objects.
We will call the last version of the Expert EventProcessor5.mq5.
4.6. Event of Mouse Click on Chart
This event will be generated if the chart is clicked with left mouse button. Right click on the chart will open a context menu, and clicking with the middle button will bring up a crosshair. The lparam and dparam parameters of the handler are reporting coordinates X and Y accordingly.
The following simple task will serve as an example. We need to arrange so that an arrow 'buy' is drawn in the point where the mouse click takes place. The object 'arrow' has only one anchor point. Consequently, only one transformation of the coordinates X and Y to values of the time and the price of the anchor point is required.
The code for the above example:
//--- 6
      case CHARTEVENT_CLICK:
        {
         comment+="6) mouse click on chart";
         //--- object counter
         static uint sign_obj_cnt;
         string buy_sign_name="buy_sign_"+IntegerToString(sign_obj_cnt+1);
         //--- coordinates
         int mouse_x=(int)lparam;
         int mouse_y=(int)dparam;
         //--- time and price
         datetime obj_time;
         double obj_price;
         int sub_window;
         //--- convert the X and Y coordinates to the time and price values
         if(ChartXYToTimePrice(0,mouse_x,mouse_y,sub_window,obj_time,obj_price))
           {
            //--- create object
            if(!ObjectCreate(0,buy_sign_name,OBJ_ARROW_BUY,0,obj_time,obj_price))
              {
               Print("Failed to create buy sign!");
               return;
              }
            //--- redraw chart
            ChartRedraw();
            //--- increase object counter
            sign_obj_cnt++;
           }
         //---
         break;
        }
The current version of the expert is named EventProcessor6.mq5.
4.7. Event of Mouse Click on a Graphical Object
This type of chart events differs from the previous one only by the fact that a mouse click happens on a graphical object. The string parameter sparam will contain the name of the object clicked on. In the previous example we created 'buy' arrows. Let us make it so that a click on the object of this type will turn it into a 'sell' arrow.
The code of this block of the handler may look like:
//--- 7
      case CHARTEVENT_OBJECT_CLICK:
        {
         comment+="7) mouse click on graphical object";
         //---
         string sign_name=sparam;

         //--- delete buy arrow
         if(ObjectDelete(0,sign_name))
           {
            //--- redraw chart
            ChartRedraw();
            //---
            static uint sign_obj_cnt;
            string sell_sign_name="sell_sign_"+IntegerToString(sign_obj_cnt+1);

            //--- coordinates
            int mouse_x=(int)lparam;
            int mouse_y=(int)dparam;
            //--- time and price
            datetime obj_time;
            double obj_price;
            int sub_window;
            //--- convert the X and Y coordinates to the time and price values
            if(ChartXYToTimePrice(0,mouse_x,mouse_y,sub_window,obj_time,obj_price))
              {
               //--- create object
               if(!ObjectCreate(0,sell_sign_name,OBJ_ARROW_SELL,0,obj_time,obj_price))
                 {
                  Print("Failed to create sell sign!");
                  return;
                 }
               //--- redraw chart
               ChartRedraw();
               //--- increase object counter
               sign_obj_cnt++;
              }
           }
         //---
         break;
        }
For the sake of this example I kept the case of a mouse click handling untouched. Launching the EA, I left-clicked the mouse three times and got three arrows to buy (Fig.7). I highlighted their location in yellow.
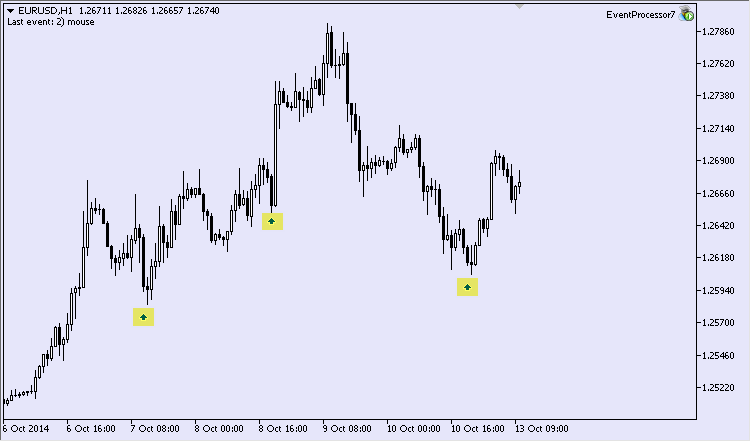
Fig.7. 'Buy' arrows
If now we click on each 'buy' arrow, we shall receive the following picture (Fig.8).
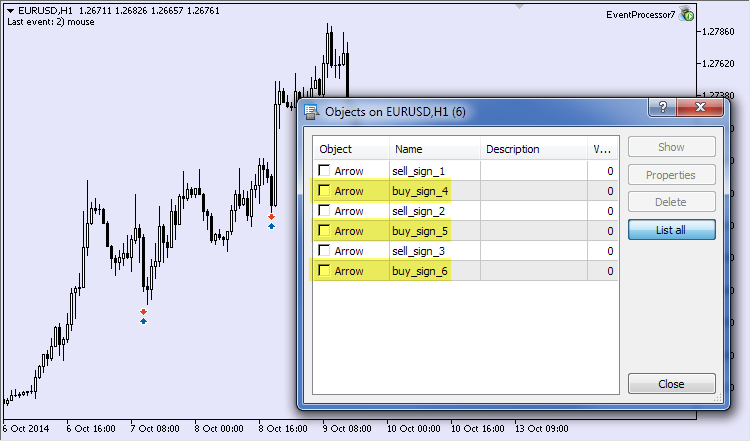
Fig.8. 'Buy' and 'sell' arrows
'Sell' arrows appeared as planned, but 'buy' arrows were not designed to appear. There is a reason why I am bringing a list of objects on the chart where I highlighted in yellow the names of 'buy' arrows.
It is easy to notice that the EA created the 4th, 5th and 6th 'buy' arrows. Why did that happen? It happened because the first click on the object triggered two events: the first was the actual click on the object and the second - a click on the chart. The last event generates creating a 'buy' arrow. Here arises a necessity to add a mechanism that will prevent handling of the second event, which is a click on the chart. It seem to me that control on time can be such a mechanism.
Let us add a global variable gLastTime. It will facilitate a control over the time of a 'buy' arrow creation. If a simple click handler is called for less than 250 ms after a 'sell' arrow was created, then this call is to be passed.
Before the chart is redrawn, the below string is to be added to the block of handling a click on the object:
//--- store the moment of creation
gLastTime=GetTickCount();
Verification of the time should be added to the block of handling a click on the chart.
uint lastTime=GetTickCount();
if((lastTime-gLastTime)>250)
  {
   //--- click handling
  }
Let us create three arrows on the chart of the 'buy' type again (Fig.9).
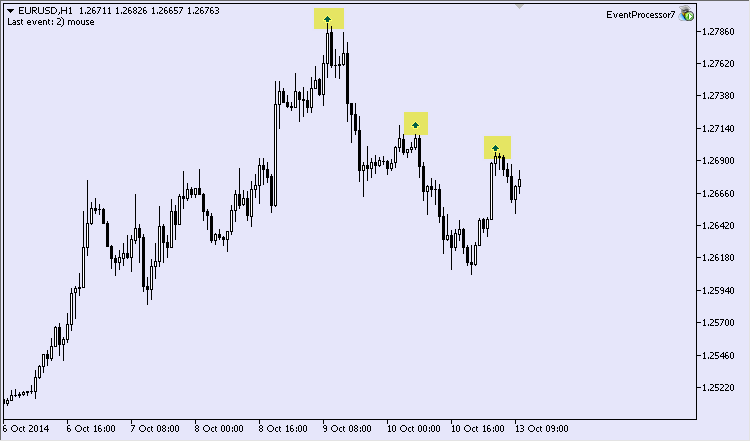
Fig.9. 'Buy' arrows
We shall try to click on them despite their small size. The arrows turned into 'sell' type upon the click (Fig.10).
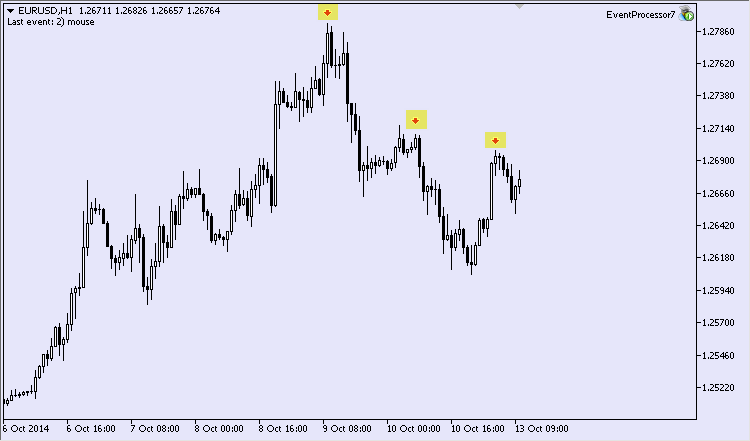
Fig.10. 'Sell' arrows
Similar to the ones before, we are going to name the new version EventProcessor7.mq5.
4.8. Event of Moving a Graphical Object with Mouse
This event takes place when an object gets moved about within a chart area. The handler receives the name of the moved object in the form of a string parameter sparam.
Here is another example. Intra-day traders very often trade within a certain time interval. Vertical lines will be the limits of a time interval. The picture will look approximately like Fig.11. The interval of interest is highlighted.
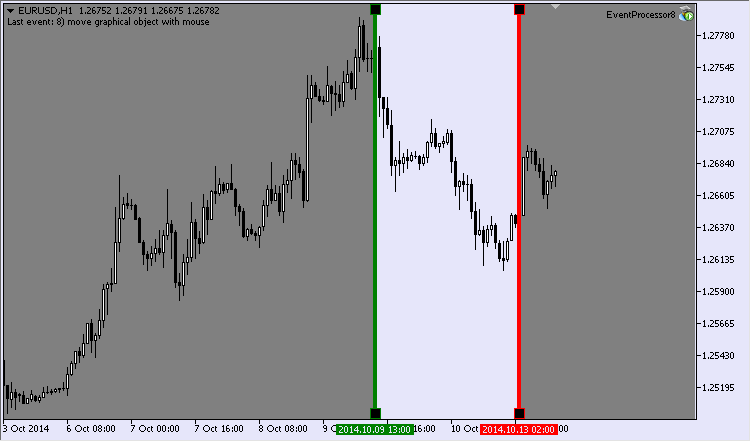
Fig.11. Limits of a time interval
The time interval can be changed manually. Then our semi-automaton will have to react to such a change.
At the global level we shall create variables describing the names of the two verticals - gTimeLimit1_name and gTimeLimit2_name. We also need to create a couple of variables for the names of the rectangles, that darken the non trading time on the chart. Global variables for anchor points will also have to be created. Since we have two rectangles, we will have four points.
The code of the case of the CHARTEVENT_OBJECT_DRAG handler:
//--- 8
      case CHARTEVENT_OBJECT_DRAG:
        {
         comment+="8) move graphical object with mouse";
         string curr_obj_name=sparam;
         //--- if one of the vertical lines is moved
         if(!StringCompare(curr_obj_name,gTimeLimit1_name) ||
            !StringCompare(curr_obj_name,gTimeLimit2_name))
           {
            //--- the time coordinate of vertical lines
            datetime time_limit1=0;
            datetime time_limit2=0;
            //--- find the first vertical line
            if(ObjectFind(0,gTimeLimit1_name)>-1)
               time_limit1=(datetime)ObjectGetInteger(0,gTimeLimit1_name,OBJPROP_TIME);
            //--- find the second vertical line
            if(ObjectFind(0,gTimeLimit2_name)>-1)
               time_limit2=(datetime)ObjectGetInteger(0,gTimeLimit2_name,OBJPROP_TIME);

            //--- if vertical lines are found
            if(time_limit1>0 && time_limit2>0)
               if(time_limit1<time_limit2)
                 {
                  //--- update properties of rectangles
                  datetime start_time=time_limit1;
                  datetime finish_time=time_limit2;
                  //---
                  if(RefreshRecPoints(start_time,finish_time))
                    {
                     //---
                     if(!ObjectMove(0,gRectLimit1_name,0,gRec1_time1,gRec1_pr1))
                       {
                        Print("Failed to move the 1st point!");
                        return;
                       }
                     if(!ObjectMove(0,gRectLimit1_name,1,gRec1_time2,gRec1_pr2))
                       {
                        Print("Failed to move the 2nd point!");
                        return;
                       }
                     //---
                     if(!ObjectMove(0,gRectLimit2_name,0,gRec2_time1,gRec2_pr1))
                       {
                        Print("Failed to move the 1st point!");
                        return;
                       }
                     if(!ObjectMove(0,gRectLimit2_name,1,gRec2_time2,gRec2_pr2))
                       {
                        Print("Failed to move the 2nd point!");
                        return;
                       }
                    }
                 }
           }
         //---
         break;
        }
This code contains a custom function RefreshRecPoints(). It is dealing with updating the values of anchor points for two rectangles. The block of the EA initialization can provide information about creating graphical objects. The updated version will be called EventProcessor8.mq5.
4.9. End of Editing a Text in the Text Field Event
This event type has a highly specialized nature and appears when the text in the data entry field is being edited. Parameter sparam contains the name of the object worked on.
Here is an example to consider. In the data entry field we shall input the trade operation we are about to execute. Let there be only two operations - buy and sell. If we enter the word 'Buy' in the entry field, then the EA will buy an asset and if we enter 'Sell', the asset will be sold. We are going to arrange that this field is not case sensitive, that is we can type 'buy' and 'sell'. The text and the input field will be colored red at sale and blue at buy (Fig.12).
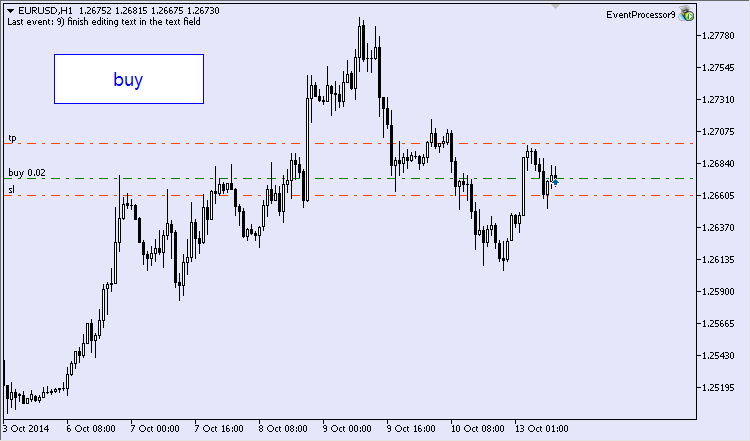
Fig.12. Buy through the text field
The code in the case CHARTEVENT_OBJECT_ENDEDIT:
//--- 9
      case CHARTEVENT_OBJECT_ENDEDIT:
        {
         comment+="9) end of editing a text in the data entry field";
         //---
         string curr_obj_name=sparam;
         //--- if specified text field is being edited
         if(!StringCompare(curr_obj_name,gEdit_name))
           {
            //--- get object description
            string obj_text=NULL;
            if(ObjectGetString(0,curr_obj_name,OBJPROP_TEXT,0,obj_text))
              {
               //--- check value
               if(!StringCompare(obj_text,"Buy",false))
                 {
                  if(TryToBuy())
                     //--- set text color
                     ObjectSetInteger(0,gEdit_name,OBJPROP_COLOR,clrBlue);
                 }
               else if(!StringCompare(obj_text,"Sell",false))
                 {
                  if(TryToSell())
                     //--- set text color
                     ObjectSetInteger(0,gEdit_name,OBJPROP_COLOR,clrRed);
                 }
               else
                 {
                  //--- set text color
                  ObjectSetInteger(0,gEdit_name,OBJPROP_COLOR,clrGray);
                 }
               //--- redraw chart
               ChartRedraw();
              }
           }
         //---
         break;
        }
The updated version of the EA is called EventProcessor9.mq5. You can find the block of creating the text field in the source file.
4.10. Chart Modification Event
The last event we are going to consider in this article is connected with changing the settings of the chart. This is a peculiar event because at this point we deal with the chart itself, not objects on the chart. The developers say that this event is generated when the size of a chart is altered or a new setting is introduced.
Here is another example. Let us assume that there is a prohibition for altering some of the chart settings. Then all attempts to change the settings under restriction will be ignored. In fact, the EA will simply be returning previous values. Let us fix the following parameters of the chart:
- display grid;
- type of chart display;
- background color.
Code for this case:
//--- 10
      case CHARTEVENT_CHART_CHANGE:
        {
         //--- current height and width of the chart
         int curr_ch_height=ChartHeightInPixelsGet();
         int curr_ch_width=ChartWidthInPixels();
         //--- if chart height and width have not changed
         if(gChartHeight==curr_ch_height && gChartWidth==curr_ch_width)
           {
            //--- fix the properties:
            //--- display grid
            if(!ChartShowGridSet(InpToShowGrid))
              {
               Print("Failed to show grid!");
               return;
              }
            //--- type of chart display
            if(!ChartModeSet(InpMode))
              {
               Print("Failed to set mode!");
               return;
              }
            //--- background color
            if(!ChartBackColorSet(InpBackColor))
              {
               Print("Failed to set background сolor!");
               return;
              }
           }
         //--- store window dimensions
         else
           {
            gChartHeight=curr_ch_height;
            gChartWidth=curr_ch_width;
           }
         //---
         comment+="10) modify chart";
         //---
         break;
        }
The last version will be called EventProcessor10.mq5.
Conclusion
In this article I tried to illustrate the diversity of typical chart events in MetaTrader 5. I hope that these examples of event handling will be useful for programmers who start coding in MQL5.