Debugging MQL5 Programs
Mykola Demko | 19 April, 2013
Introduction
This article is intended primarily for the programmers who have already learned the language but have not fully mastered the program development yet. It highlights the key issues that every developer deals with when debugging a program. So, what is debugging?
Debugging is a stage in program development meant for detecting and removing program execution errors. During the debugging process, a developer analyzes an application trying to detect possible issues. Data for analysis is received by observing the variables and program execution (what functions are called and when).
There are two complementary debugging technologies:
- Using the debugger - utility showing step-by-step execution of the developed program.
- Interactive display of variables' states and functions' invocations on a screen, in the journal or in a file.
Let's assume that you know MQL5, including variables, structures, etc. But you have not developed programs on your own yet. The first thing you will perform is a compilation. In fact, this is the first stage of debugging.
1. Compilation
Compilation is translating a source code from a high-level programming language to a lower level one.
MetaEditor compiler translates programs into a bytecode, not a native code (follow the link for details). This allows developing encrypted programs. Besides, a bytecode can be launched both in 32 and 64-bit operating systems.
But let's return to compilation, which is the first stage of debugging. After pressing F7 (or Compile button), MetaEditor 5 will report on all errors you have made when writing the code. "Errors" tab of "Toolbox" window contains description of detected errors and their location. Highlight description line by the cursor and press Enter to go directly to the error.
Only two types of errors are displayed by the compiler:
- Syntax errors (displayed in red) - a source code cannot be compiled till they are eliminated.
- Warnings (displayed in yellow) - a code will be complied but it would be better to correct such mistakes.
Syntax errors are often caused by carelessness. For example, "," and ";" can be easily confused when declaring variables:
int a; b; // incorrect declaration
The compiler will return an error in case of such a declaration. The correct declaration will look as follows:
int a, b; // correct declaration
Or:
int a; int b; // correct declaration
Warnings should not be ignored as well (many developers are too careless about them). If MetaEditor 5 returned warnings during the compilation, a program will be created but there is no guarantee that it will work as you planned.
Warnings are only the tip of the iceberg hiding major efforts of MQL5 developers to systematize common typos of programmers.
Suppose that you are going to compare two variables:
if(a==b) { } // if a is equal to b, then ...
But as a result of a typo or because of forgetfulness, you use "=" instead of "==". In this case, the compiler interprets the code the following way:
if(a=b) { } // assign b to a, if a is true, then ... (unlike MQL4, it is applicable in MQL5)
As we can see, this typo can change the program operation dramatically. Therefore, the compiler will show the warning for this line.
Let's sum it up: compilation is the first stage of debugging. Compiler warnings should not be ignored.
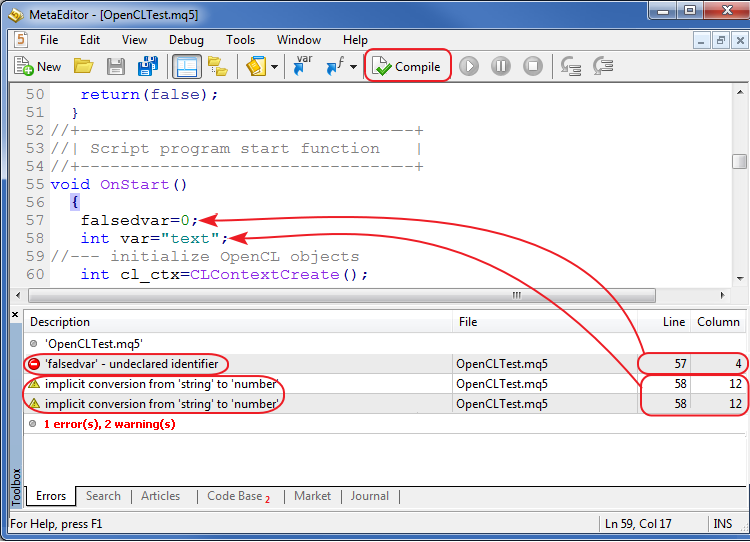
Fig. 1. Debugging data during compilation.
2. Debugger
The second debugging stage is using Debugger (F5 hotkey). The debugger launches your program in emulation mode executing it step by step. Debugger is a new feature of MetaEditor 5, as it is absent in MetaEditor 4. That is why there is no experience of using it by the programmers switching from MQL4 to MQL5.
Debugger interface has three main and three auxiliary buttons:
- Start [F5] - start debugging.
- Pause [Break] - pause debugging.
- Stop [Shift+F5] - stop debugging.
- Step into [F11] - user is moved inside the function called in this line.
- Step over [F10] - the debugger ignores a body of the function called in this string and moves to the next line.
- Step out [Shift+F11] - a user exits a body of the function he or she is currently located at.
That is the debugger's interface. But how should we use it? Program debugging may start from the line, at which a programmer has set special DebugBreak() debugging function, or from a breakpoint that can be set by pressing F9 button or by clicking a special button on the toolbar:

Fig. 2. Setting breakpoints.
Without breakpoints, the debugger will simply execute the program and report that debugging is successful but you will see nothing. Using DebugBreak, you can skip some of the code you are not interested in and start step-by-step check of the program from the line you consider to be troublesome.
So, we have launched the debugger, put DebugBreak to the right place and we are examining the program execution now. What's next? How can it help us understand what is happening with the program?
First of all, look at the left part of the debugger's window. It displays the function name and the number of the line where you are located now. Second, look at the right side of the window. It is empty but you can enter the name of any variable in Expression field. Enter the name of the variable to see its current value in Value field.
The variable can also be selected and added using [Shift+F9] hotkey or from the context menu as shown below:
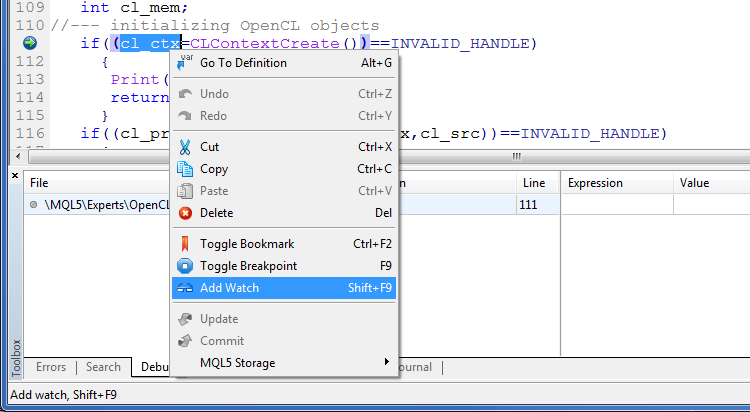
Fig. 3. Adding variable watching when debugging.
Thus, you can track a code line, at which you are located at the moment, and view the values of the important variables. Analyzing all this, you will eventually be able to understand whether the program is operating correctly.
There is no need to worry that the variable you are interested in is declared locally while you have not yet reached the function it is declared in. While you are outside of the scope of the variable, it will have the value of "Unknown identifier". It means that the variable is not declared. That will not cause the debugger's error. After reaching the scope of the variable, you will see its value and type.
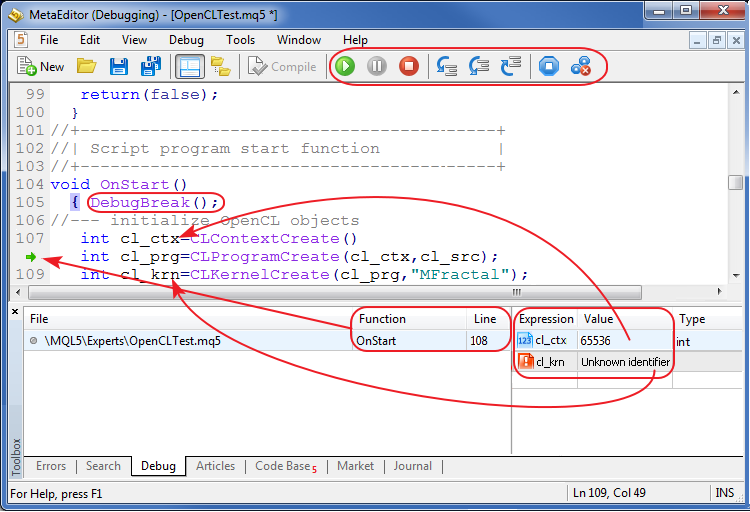
Fig. 4. Debugging process. Viewing variable values.
These are the main debugger features. Tester section shows what cannot be done in the debugger.
3. Profiler
The code profiler is an important addition to the debugger. In fact, this is the last stage of the program debugging consisting of its optimization.
The profiler is called from MetaEditor 5 menu by clicking "Start profiling" button. Instead of step-by-step program analysis offered by the debugger, the profiler executes the program. If a program is an indicator or an Expert Advisor, the profiler will work till the program is unloaded. The unload may be performed by removing an indicator or an Expert Advisor from the chart, as well as by clicking "Stop profiling".
Profiling provides us with important statistics: how many times each function was called, how much time has been spent on its execution. Perhaps, you will be a little confused by statistics in percentage terms. It is necessary to understand that statistics does not consider nested functions. Therefore, the sum of all percentage values will greatly exceed 100%.
But despite that fact, the profiler still remains a powerful tool for optimizing programs allowing users to view what function should be optimized for speed and where you can save some memory.
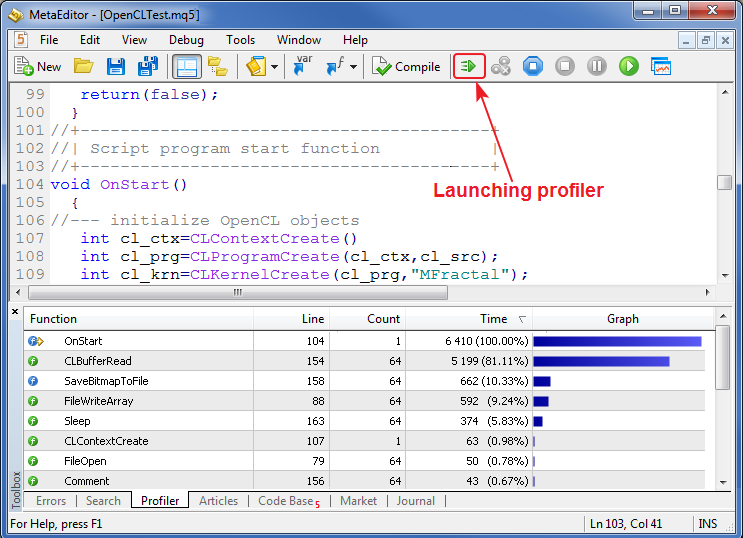
Fig. 5. Profiler operation results.
4. Interactivity
Anyway, I think that message display functions - Print and Comment are the main debugging tools. First, they are very easy to use. Second, programmers switching to MQL5 from the previous version of the language already know them.
"Print" function sends the passed parameter to the log file and Experts tool tab as a text string. Sending time and the the name of the program that has called the function are displayed to the left of the text. During the debugging, the function is used to define what values are contained in the variables.
In addition to variable values, it is sometimes necessary to know the sequence of calls of those functions. "__FUNCTION__" and "__FUNCSIG__" macros can be used for that. The first macro returns a string with the name of the function it is called from, while the second one additionally displays the list of parameters of the called function.
Below you can see the use of macros:
//+------------------------------------------------------------------+
//| Example of displaying data for debugging                             |
//+------------------------------------------------------------------+
void myfunc(int a)
  {
   Print(__FUNCSIG__); // display data for debugging
//--- here is some code of the function itself
  }
I prefer to use "__FUNCSIG__" macro as it shows the difference between overloaded functions (having the same name but different parameters).
It is often required to skip some calls or even focus on a particular function call. For these purposes, Print function can be protected by a condition. For example, print may be called only after 1013th iteration:
//+------------------------------------------------------------------+
//| Example of data output for debugging                             |
//+------------------------------------------------------------------+
void myfunc(int a)
  {
//--- declare the static counter
   static int cnt=0;
//--- condition for the function call
   if(cnt==1013)
      Print(__FUNCSIG__," a=",a); // data output for debugging
//--- increment the counter
   cnt++;
//--- here is some code of the function itself
  }
The same can be done to Comment function, which displays comments in the upper left corner of a chart. This is a great advantage, as you do not have to switch to anywhere during debugging. However, when using the function, each new comment deletes the previous one. That can be seen as a disadvantage (though it is convenient at times).
To eliminate this drawback, the method of additional writing of a new string to the variable can be applied. First, string type variable is declared (in most cases, globally) and initialized by the empty value. Then, each new text string is placed at the beginning with the added line feed character, while the previous value of the variable is added to the end.
string com=""; // declare the global variable for storing debugging data
//+------------------------------------------------------------------+
//| Example of data output for debugging                             |
//+------------------------------------------------------------------+
void myfunc(int a)
  {
//--- declare the static counter
   static int cnt=0;
//--- storing debugging data in the global variable
   com=(__FUNCSIG__+" cnt="+(string)cnt+"\n")+com;
   Comment(com); // вывод информации для отладки
//--- increase the counter
   cnt++;
//--- here is some code of the function itself
  }
Here we come to another opportunity to view the contents of the program in details - printing to file. Print and Comment functions may not be always suitable for large data volumes or high-speed printing. The former sometimes may not have enough time to display the changes (as calls may run ahead of the display causing confusion), the latter - because it operates even slower. Besides, comment cannot be reread and examined in details.
Printing to file is the most convenient method of data output when you need to check the sequence of calls or log large amount of data. However, it should be kept in mind that the print is not used at each iteration but at the end of the file instead, while data saving to string variable is used at each iteration according to the principle described above (the only difference is that the new data is additionally written to the end of the variable).
string com=""; // declare the global variable for storing debugging data
//+------------------------------------------------------------------+
//| Program shutdown                                                 |
//+------------------------------------------------------------------+
void OnDeinit(const int reason)
  {
//--- saving data to the file when closing the program
   WriteFile();
  }
//+------------------------------------------------------------------+
//| Example of data output for debugging                             |
//+------------------------------------------------------------------+
void myfunc(int a)
  {
//--- declare the static counter
   static int cnt=0;
//--- storing debugging data in the global variable
   com+=__FUNCSIG__+" cnt="+(string)cnt+"\n";
//--- increment the counter
   cnt++;
//--- here is some code of the function itself
  }
//+------------------------------------------------------------------+
//| Save data to file                                                |
//+------------------------------------------------------------------+
void WriteFile(string name="Отладка")
  {
//--- open the file
   ResetLastError();
   int han=FileOpen(name+".txt",FILE_WRITE|FILE_TXT|FILE_ANSI," ");
//--- check if the file has been opened
   if(han!=INVALID_HANDLE)
     {
      FileWrite(han,com); // печать данных
      FileClose(han);     // закрытие файла
     }
   else
      Print("File open failed "+name+".txt, error",GetLastError());
  }
WriteFile function is called in OnDeinit. Therefore, all changes that happened in the program are written to the file.
Note: if your log is too big, it would be wise to store it in several variables. The best way to do that is to put the contents of the text variable to string type array cell and zero out com variable (preparation to the next stage of the work).
It should be done after each 1-2 million strings (non-recurring entries). First, you will avoid data loss caused by variable overflow (by the way, I was not able to do that despite all my efforts, as developers worked hard on string type). Second, and the most important - you will be able to display data in several files instead of opening a huge file in the editor.
In order not to constantly track the amount of saved strings, you can use separation of functions for working with files into three parts. The first part is opening the file, the second one is writing to file at each iteration and the third one is closing the file.
//--- open the file
int han=FileOpen("Debugging.txt",FILE_WRITE|FILE_TXT|FILE_ANSI," ");
//--- print data
if(han!=INVALID_HANDLE) FileWrite(han,com);
if(han!=INVALID_HANDLE) FileWrite(han,com);
if(han!=INVALID_HANDLE) FileWrite(han,com);
if(han!=INVALID_HANDLE) FileWrite(han,com);
//--- close the file
if(han!=INVALID_HANDLE) FileClose(han);
But this method should be used with caution. If execution of your program fails (for example, due to zero divide), you may receive an unmanageable opened file that can disrupt the work of your operating system.
Also, I strongly do not recommend using the full open-write-close loop at each iteration. My personal experience says that your hard drive will die in a few months in that case.
5. Tester
When debugging Expert Advisors, you often need to check the activation of some particular condition. But the above-mentioned debugger launches an Expert Advisor only in real time mode and you may wait for quite a lot of time while these conditions are finally activated.
In fact, specific trading conditions may occur rarely. However, we do know that they happen but it would be an absurd thing to wait for them for months. So what can we do?
The strategy tester can help in that case. The same Print and Comment functions are used for debugging. Comment always takes the first place to assess the situation, while Print function is used for more detailed analysis. Tester stores displayed data in tester logs (separate directory for each tester agent).
To launch an Expert Advisor at the right interval, I localize the time (where failures occur, in my opinion), set the necessary date in the tester and launch it in visualization mode at all ticks.
I'd also like to mention that I borrowed this debugging method from MetaTrader 4 where it was almost the only way to debug a program during its execution.
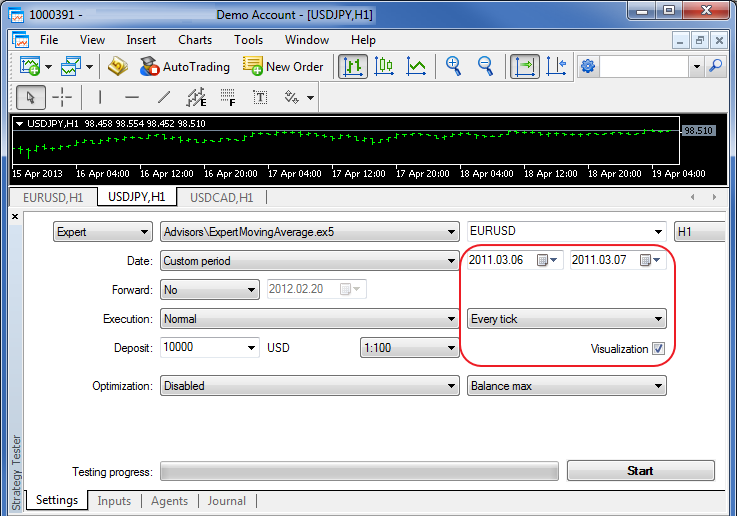
Fig. 6. Debugging using the Strategy Tester.
6. Debugging in OOP
Object-oriented programming, which appeared in MQL5, has influenced the debugging process. When debugging procedures, you can navigate in the program easily using only function names. However, in OOP, it is often necessary to know the object different methods are called from. It is especially important when objects are designed vertically (using inheritance). Templates (recently introduced in MQL5) can help in that case.
The template function allows receiving the pointer type as a string type value.
template<typename T> string GetTypeName(const T &t) { return(typename(T)); }
I use this property for debugging the following way:
//+------------------------------------------------------------------+
//| Base class contains the variable for storing the type             |
//+------------------------------------------------------------------+
class CFirst
  {
public:
   string            m_typename; // variable for storing the type
   //--- filling the variable by the custom type in the constructor
                     CFirst(void) { m_typename=GetTypeName(this); }
                    ~CFirst(void) { }
  };
//+------------------------------------------------------------------+
//| Derived class changes the value of the base class variable  |
//+------------------------------------------------------------------+
class CSecond : public CFirst
  {
public:
   //--- filling the variable by the custom type in the constructor
                     CSecond(void) { m_typename=GetTypeName(this); }
                    ~CSecond(void) {  }
  };
The base class contains the variable for storing its type (the variable is initialized in each object's constructor). Derived class also uses the value of this variable for storing its type. Thus, when the macro is called, I just add m_typename variable receiving not only the name of the called function but also the type of the object that called this function.
The pointer itself may be derived for more accurate recognition of objects allowing users to differ objects by numbers. Inside the object, this is done as follows:
Print((string)this); // print pointer number inside the class
While outside, it looks as follows:
Print((string)GetPointer(pointer)); // print pointer number outside the class
Also, the variable for storing the object name can be used inside each class. In that case, it is possible to pass the object name as a constructor's parameter when creating an object. This will allow you not only to divide objects by their numbers but also to understand what each object stands for (as you will name them). This method can be realized similarly to filling m_typename variable.
7. Tracing
All methods mentioned above complement each other and are very important for debugging. However, there is another method which is not so popular - tracing.
This method is rarely used because of its complexity. When you get stuck and you do not understand what is going on, tracing can help you.
This method allows you to understand the application's structure - the sequence and the objects of calls. Using tracing, you will understand what is wrong with the program. Besides, the method provides an overview of the project.
Tracing is performed the following way. Create two macros:
//--- opening substitution
#define zx Print(__FUNCSIG__+"{");
//--- closing substitution
#define xz Print("};");
These are opening zx and closing xz macros accordingly. Let's place them to function bodies that are to be traced:
//+------------------------------------------------------------------+
//| Example of function tracing                                       |
//+------------------------------------------------------------------+
void myfunc(int a,int b)
  {
   zx
//--- here is some code of the function itself
   if(a!=b) { xz return; } // exit in the middle of the function
//--- here is some code of the function itself
   xz return;
  }
If the function contains exit according to conditions, we should set closing xz in the protected area before each return. This will prevent disruption of tracing structure.
Note that the macro mentioned above is used just to simplify the example. It is better to use print to file for tracing. Besides, I use one trick when printing to file. To see the entire tracing structure, I wrap function names in the following syntactic construction:
if() {...} The resulting file is set with ".mqh" extension which allows opening it in MetaEditor and using styler [Ctrl+,] to display tracing structure.
Full tracing code is shown below:
string com=""; // declare global variable for storing debugging data
//--- opening substitution
#define zx com+="if("+__FUNCSIG__+"){\n";
//--- closing substitution
#define xz com+="};\n";
//+------------------------------------------------------------------+
//| Program shutdown                                      |
//+------------------------------------------------------------------+
void OnDeinit(const int reason)
  {
//--- //--- saving data to the file when closing the program
   WriteFile();
  }
//+------------------------------------------------------------------+
//| Example of the function tracing                                       |
//+------------------------------------------------------------------+
void myfunc(int a,int b)
  {
   zx
//--- here is some code of the function itself
   if(a!=b) { xz return; } // exit in the middle of the function
//--- here is some code of the function itself
   xz return;
  }
//+------------------------------------------------------------------+
//| Save data to file                                              |
//+------------------------------------------------------------------+
void WriteFile(string name="Tracing")
  {
//--- open the file
   ResetLastError();
   int han=FileOpen(name+".mqh",FILE_WRITE|FILE_TXT|FILE_ANSI," ");
//--- check if the file has opened
   if(han!=INVALID_HANDLE)
     {
      FileWrite(han,com); // print data
      FileClose(han);     // close the file
     }
   else
      Print("File open failed "+name+".mqh, error",GetLastError());
  }
To start tracing from the particular place, macros should be supplemented by conditions:
bool trace=0; // variable for protecting tracing by condition
//--- opening substitution
#define zx if(trace) com+="if("+__FUNCSIG__+"){\n";
//--- closing substitution
#define xz if(trace) com+="};\n";
In this case, you will be able to enable or disable tracing after setting "true" or "false" value to "trace" variable after some certain event or in a certain place.
If tracing is not required already though it can become necessary later or there is not enough time to clear the source at the moment, it can be disabled by changing macros values to the empty ones:
//--- substitute empty values
#define zx
#define xz
The file with the standard Expert Advisor containing changes for tracing is attached below. Tracing results can be seen in Files directory after launching the Expert Advisor on the chart (tracing.mqh file is created). Here is the passage from the resulting file's text:
if(int OnInit()){
};
if(void OnTick()){
if(void CheckForOpen()){
};
};
if(void OnTick()){
if(void CheckForOpen()){
};
};
if(void OnTick()){
if(void CheckForOpen()){
};
};
//--- ...
Note that the structure of nested calls cannot be clearly defined in the newly created file initially but you will be able to see its entire structure after using the code styler. Below is the text of the resulting file after using the styler:
if(int OnInit())
  {
  };
//+------------------------------------------------------------------+
//|                                                                  |
//+------------------------------------------------------------------+
if(void OnTick())
  {
   if(void CheckForOpen())
     {
     };
  };
//+------------------------------------------------------------------+
//|                                                                  |
//+------------------------------------------------------------------+
if(void OnTick())
  {
   if(void CheckForOpen())
     {
     };
  };
//+------------------------------------------------------------------+
//|                                                                  |
//+------------------------------------------------------------------+
if(void OnTick())
  {
   if(void CheckForOpen())
     {
     };
  };
//--- ...
This is only my trick and not an example of how tracing should be performed. Everyone is free to do tracing in his or her own way. The main thing is that tracing reveals the structure of function calls.
Important Note on Debugging
If you implement changes to your code during debugging, use wrapping of calls of direct MQL5 functions. Below is how it is done:
//+------------------------------------------------------------------+
//| Example of wrapping a standard function in a shell function      |
//+------------------------------------------------------------------+
void DebugPrint(string text) { Print(text); }
This will allow you to easily clear the code when debugging is completed:
- remove "DebugPrint" function call,
- then compile
- and delete calls of this function in the lines where MetaEditor warns on compilation errors.
The same goes for the variables used in debugging. Therefore, try using globally declared variables and functions. That will save you from searching for constructions lost in depths of your application.
Conclusion
Debugging is an important part of the programmer's work. A person who is not able to perform program debugging cannot be called a programmer. But the main debugging is always performed in your head. This article only shows some methods used in debugging. But without understanding of the application's operation principles, these methods will be of no use.
I wish you successful debugging!