
Color optimization of trading strategies

Introduction
After optimization, we need to select only one of a large variety of parameter sets. There is no clear answer about what criterion to use when selecting such a set: profitability, drawdown, recovery factor or some combination of these or other parameters. But how to evaluate the combination of parameters?
In this article we will perform an experiment: we will color optimization results. The color is determined by three parameters: the levels of red, green and blue (RGB). There are other color coding methods, which also use three parameters. Thus, three testing parameters can be converted into one color, which visually represents the values. At the end of this article we will find out if such a representation can be useful.
Initial data
In the article Analyzing trading results using HTML reports, we created a library of functions for parsing report files, HTMLReport.mqh. The library includes the OptimizerXMLReportToStruct() function, which is designed for operations with optimization results. We will use this function Two parameters are passed to the function:
- string aFileName is the name of the file with the optimization report. The file must be available in the MQL5/Files folder of the terminal data directory.
- SOptimization & aOptimization is passed by reference. After the function execution, data extracted from the report will be located in this structure.
The SOptimisation structure:
struct SOptimization{
   string ParameterName[];
   SPass Pass[];
};
The structure includes two arrays: string ParameterName[] and SPass Pass[]. The names of parameters to be optimized are located in ParameterName[]. We are mainly interested in the second array SPass[]: one element of this array contains data about one optimization pass.
The SPass structure:
struct SPass{
   string Pass;
   string Result;
   string Profit;
   string ExpectedPayoff;
   string ProfitFactor;
   string RecoveryFactor;
   string SharpeRatio;
   string Custom;
   string EquityDD_perc;
   string Trades;
   string Parameters[];
};
The structure fields:
- Pass — the number of the optimization pass;
- Result — the final balance after optimization;
- Profit — resulting profit value;
- ExpectedPayoff — the expected payoff value;
- ProfitFactor — the profit factor value;
- RecoveryFactor — recovery factor;
- SharpeRatio — Sharpe ratio;
- Custom — a custom parameter;
- EquityDD_perc — drawdown in percentage;
- Trades — number of trades;
- Parameters[] — an array with the values of optimized parameters.
Below are the most popular parameters for analyzing trading results:
- Profitability, the average profit per trade
- Drawdown, the equity decrease relative to the maximum value
- Recovery factor, the ratio of the absolute profit to the maximum drawdown
First of all we will use these parameters. However, the report includes other values and thus we need to provide the possibility to use them.
To enable the arbitrary parameter selection, we will create an additional structure to replace SPass. Optimization parameters will be located in the double array within this structure. We will not completely re-write the structure, but will use inheritance possibilities. Let us proceed to the implementation:
1. Create the ColorOptimization.mqh file. All functions for the creation of colored reports will be located in this file.
2. Connect the HTMLReport.mqh file at the beginning of the ColorOptimization.mqh file:
#include <HTMLReport.mqh>
3. Create a new structure, which inherits all the fields of the SPass structure and add the factor[] and dParameters[] arrays to it:
struct SPass2:SPass{
   double factor[9];
   double dParameters[];
};
Both arrays are of the double type. Nine resulting values will be located in the factor[] array, i.e. all except Pass (pass numbers) and parameters to be optimized. The values of the optimization parameters are located in the sParameters[] array. Although all the data are already available in the structure, they are presented in a string format, so we would need to convert them into numbers each time the data is used. The array allows having data in a convenient format.
4. Create the final structure for the optimization data:
struct SOptimization2{
   string ParameterName[];
   SPass2 Pass[];
};
5. Create a function for converting data from the SOptimization structure to SOptimization2:
void ConvertOptimizationStruct(SOptimization & src,SOptimization2 & dst){

   ArrayCopy(dst.ParameterName,src.ParameterName);
   int cnt=ArraySize(src.Pass);
   ArrayResize(dst.Pass,cnt);
   for(int i=0;i<cnt;i++){
      ArrayCopy(dst.Pass[i].Parameters,src.Pass[i].Parameters);

      dst.Pass[i].Pass=src.Pass[i].Pass;
      dst.Pass[i].Result=src.Pass[i].Result;
      dst.Pass[i].Profit=src.Pass[i].Profit;
      dst.Pass[i].ExpectedPayoff=src.Pass[i].ExpectedPayoff;
      dst.Pass[i].ProfitFactor=src.Pass[i].ProfitFactor;
      dst.Pass[i].RecoveryFactor=src.Pass[i].RecoveryFactor;
      dst.Pass[i].SharpeRatio=src.Pass[i].SharpeRatio;
      dst.Pass[i].Custom=src.Pass[i].Custom;
      dst.Pass[i].EquityDD_perc=src.Pass[i].EquityDD_perc;
      dst.Pass[i].Trades=src.Pass[i].Trades;

      dst.Pass[i].factor[0]=StringToDouble(src.Pass[i].Result);
      dst.Pass[i].factor[1]=StringToDouble(src.Pass[i].Profit);
      dst.Pass[i].factor[2]=StringToDouble(src.Pass[i].ExpectedPayoff);
      dst.Pass[i].factor[3]=StringToDouble(src.Pass[i].ProfitFactor);
      dst.Pass[i].factor[4]=StringToDouble(src.Pass[i].RecoveryFactor);
      dst.Pass[i].factor[5]=StringToDouble(src.Pass[i].SharpeRatio);
      dst.Pass[i].factor[6]=StringToDouble(src.Pass[i].Custom);
      dst.Pass[i].factor[7]=StringToDouble(src.Pass[i].EquityDD_perc);
      dst.Pass[i].factor[8]=StringToDouble(src.Pass[i].Trades);

      int pc=ArraySize(src.Pass[i].Parameters);

      ArrayResize(dst.Pass[i].dParameters,pc);

      for(int j=0;j<pc;j++){
         if(src.Pass[i].Parameters[j]=="true"){
            dst.Pass[i].dParameters[j]=1;
         }
         else if(src.Pass[i].Parameters[j]=="false"){
            dst.Pass[i].dParameters[j]=0;
         }
         else{
            dst.Pass[i].dParameters[j]=StringToDouble(src.Pass[i].Parameters[j]);
         }
      }
   }
}
The data structure with data is passed to the function as the first parameter and a new structure is returned by reference as the second parameter. Loop through all optimization passes is performed in the function; also some fields of the structure are copied and for some fields type conversion is performed. The general process is not complicated and can be understood from the function code.
The factor[] array elements will be accessed using the enumeration:
enum EOptimizatrionFactor{
   Result=0,
   Profit=1,
   ExpectedPayoff=2,
   ProfitFactor=3,
   RecoveryFactor=4,
   SharpeRatio=5,
   Custom=6,
   EquityDD_perc=7,
   Trades=8
};
The enumeration option values start with zero and are increased by 1 and thus it may not necessary to specify the values. However the values are indicated since it is important to provide matching with the factor[] array. This will help in avoiding possible errors in further revisions and additions to the program.
6. Create a function for loading the report file to the SOptimization2 structure, which is similar to OptimizerXMLReportToStruct() from HTMLReport.mqh:
bool OptimizerXMLReportToStruct2(string aFileName,SOptimization2 & aOptimization){
   SOptimization tmp;
   if(!OptimizerXMLReportToStruct(aFileName,tmp)){
      return(false);
   }
   ConvertOptimizationStruct(tmp,aOptimization);
   return(true);
}
The report file name is passed to the function as the first parameter and the filled SOptimization2 structure is returned as the second parameter.
Now everything is ready for solving the main task of the article.
Creating a color report
Functions for the creation of the color report will be located in ColorOptimization.mqh. Call of these functions will the performed from a script.
1. Let us create a script ColorOptimization.mq5.
2. Connect ColorOptimization.mqh to ColorOptimization.mq5.
#include <ColorOptimization.mqh>
3. Add external parameters to the script. First we will add a property indicating that a properties window exists and then we will add variables.
Property:
#property script_show_inputs
External variables:
input string               ReportName     =  "*.xml";
input string               OutputName     =  "ColorOptimization1-1.htm";
input EOptimizatrionFactor Factor1        =  Profit;
input EOptimizatrionFactor Factor2        =  EquityDD_perc;
input EOptimizatrionFactor Factor3        =  RecoveryFactor;
input bool                 Factor1Invert  =  false;
input bool                 Factor2Invert  =  true;
input bool                 Factor3Invert  =  false;
input bool                 Sort           =  true;
Description of the variables:
- ReportName — the name of the source optimization report file;
- OutputName — the file name for the report created by the script;
- Factor1 — the first factor, based on which the report color is determined;
- Factor2 — the second factor, based on which the report color is determined;
- Factor3 — the third factor, based on which the report color is determined;
- Factor1Invert — inverting the first factor;
- Factor2Invert — inverting the second factor;
- Factor3Invert — inverting the third factor;
- Sort — enable sorting of the final report in accordance with the color indication;
4. In the OnStart() function of the script, we declare a variable of type SOptimisation2 and receive the source report data to it:
SOptimization2 opt;

if(!OptimizerXMLReportToStruct2(ReportName,opt)){
   Alert("Error OptimizerXMLReportToStruct2");
   return;
}
5. Since RGB is just one of many different color models, let us provide the possibility of further library modifications, in particular, the addition of other color models. That is why we will start with the calculation of abstract values from 0 to 1 rather than calculating the values of RGB components. Then we will convert these values to RGB components ranging from 0 to 255. A separate color indication is used for each optimization pass, so we need to add to SPass2 three fields for color components. Instead of adding three fields, we will add one three-element array:
double ColorComponent[3];
6. The SolveColorComponents() function in ColorOptimization.mqh will calculate the color components. The following parameters should be passed to the function:
- SOptimization2 & aOpt — data of the source optimization report
- int i1, int i2, int i3 — indices of the source optimization report values (the factor[9] array of the SPass structure)
- bool r1=false, bool r2=false, bool r3=false — variables for inverting the values
After the function execution, the ColorComponents[3] array in the SPass structures array will be filled with values.
For the calculation of colored components, we need to find the minimum and maximum values for each of the parameters and then calculate the value in the range from 0 to 1. The entire SolveColorComponents() function code is shown below:
void SolveColorComponents(  SOptimization2 & aOpt,
                              int i1,int i2,int i3,
                              bool r1=false,bool r2=false,bool r3=false){

   double mx[3]={0,0,0};
   double mn[3]={DBL_MAX,DBL_MAX,DBL_MAX};

   int size=ArraySize(aOpt.Pass);

   for(int i=0;i<size;i++){
      mx[0]=MathMax(mx[0],aOpt.Pass[i].factor[i1]);
      mx[1]=MathMax(mx[1],aOpt.Pass[i].factor[i2]);
      mx[2]=MathMax(mx[2],aOpt.Pass[i].factor[i3]);
      mn[0]=MathMin(mn[0],aOpt.Pass[i].factor[i1]);
      mn[1]=MathMin(mn[1],aOpt.Pass[i].factor[i2]);
      mn[2]=MathMin(mn[2],aOpt.Pass[i].factor[i3]);
   }

   double c1,c2,c3,d;

   for(int i=0;i<size;i++){

      c1=0;
      c2=0;
      c3=0;

      d=mx[0]-mn[0];
      if(d!=0){
         c1=(aOpt.Pass[i].factor[i1]-mn[0])/d;
      }

      d=mx[1]-mn[1];
      if(d!=0){
         c2=(aOpt.Pass[i].factor[i2]-mn[1])/d;
      }

      d=mx[2]-mn[2];
      if(d!=0){
         c3=(aOpt.Pass[i].factor[i3]-mn[2])/d;
      }

      if(r1)c1=1.0-c1;
      if(r2)c2=1.0-c2;
      if(r3)c3=1.0-c3;

      aOpt.Pass[i].ColorComponent[0]=c1;
      aOpt.Pass[i].ColorComponent[1]=c2;
      aOpt.Pass[i].ColorComponent[2]=c3;
   }

}
How to call this function from the script:
SolveColorComponents(opt,Factor1,Factor2,Factor3,Factor1Invert,Factor2Invert,Factor3Invert);
7. If sorting is enabled in external script parameters, we need to calculate the factor for the sorting and perform that sorting. The best optimization pass is the one, during which all parameters combined have the maximum value. If these parameters correspond to RGB, the best option is the white color. Thus the sorting factor should be calculated as the arithmetic average of three components.
Let us add one more field to the SPass2 structure:
double SortFactor;
The functions for calculating the sorting factor should be added to the ColorOptimization.mqh file:
void SolveSortFactor(SOptimization2 & aOpt){

   int size=ArraySize(aOpt.Pass);

   for(int i=0;i<size;i++){
      aOpt.Pass[i].SortFactor=0;
      for(int j=0;j<3;j++){
         aOpt.Pass[i].SortFactor+=aOpt.Pass[i].ColorComponent[j];
      }
      aOpt.Pass[i].SortFactor/=3;
   }
}
Below is the sorting Function (using the bubble sort method):
void SortFactorSort(SOptimization2 & aOpt){
   int size=ArraySize(aOpt.Pass);
   for(int i=size-1;i>0;i--){
      for(int j=0;j<i;j++){
         if(aOpt.Pass[j].SortFactor<aOpt.Pass[j+1].SortFactor){
            SPass2 tmp=aOpt.Pass[j];
            aOpt.Pass[j]=aOpt.Pass[j+1];
            aOpt.Pass[j+1]=tmp;
         }
      }
   }
}
Call these functions from the scrip. The sorting factor is used not only for sorting the table, therefore the SolveSortFactor() will be called regardless of the value of the Sort variable:
SolveSortFactor(opt);
if(Sort){
   SortFactorSort(opt);
}
Now everything is ready for report creation. The report will consist of two parts. The first one is a copy of the optimization data table with an additional color button (Fig. 1.). The second part consists of several colored planes (tables) for each pair of optimized parameters, each cell will display the gradient reflecting changes in the testing results for the given pair of optimized parameters (Fig. 2).
Table with a color indication
Creation of a table with an additional color indication is performed in the TableContent() function. This function is located in the ColorOptimization.mqh file and returns the HTML code of the table.
Creation of a HTML table is a simple task. Color for a color indication cell is set by specifying the cell style, the 'background-color' attribute. Color components ranging between 0 and 1 can be easily converted to components ranging from 1 to 255 by multiplying the values. To provide more visual information in the table, let us add details about what optimization parameter corresponds to this or that color. This data will be specified in the upper cell of the color indicator column, and the upper cells of the parameters will have the appropriate color (Fig. 1).

Fig. 1. Report fragment with a color indication
The entire TableContent() function is shown below:
string TableContent(SOptimization2 & aOpt,int i1,int i2,int i3){ int size=ArraySize(aOpt.Pass); int pc=ArraySize(aOpt.ParameterName); int nc=ArraySize(co_names); string s="<table>"; s=s+"<tr>"; s=s+"<th>Pass</td>"; for(int i=0;i<nc;i++){ s=s+"<th"+HStyle(i,i1,i2,i3)+">"+co_names[i]+"</th>"; } s=s+"<th>"+ColorCollHeader(i1,i2,i3)+"</th>"; for(int j=0;j<pc;j++){ s=s+"<th>"+aOpt.ParameterName[j]+"</th>"; } s=s+"</tr>"; int r,g,b; for(int i=0;i<size;i++){ ComponentsToRGB(aOpt.Pass[i].ColorComponent[0], aOpt.Pass[i].ColorComponent[1], aOpt.Pass[i].ColorComponent[2], r,g,b); s=s+"<tr>"; s=s+"<td>"+aOpt.Pass[i].Pass+"</td>"; s=s+"<td>"+aOpt.Pass[i].Result+"</td>"; s=s+"<td>"+aOpt.Pass[i].Profit+"</td>"; s=s+"<td>"+aOpt.Pass[i].ExpectedPayoff+"</td>"; s=s+"<td>"+aOpt.Pass[i].ProfitFactor+"</td>"; s=s+"<td>"+aOpt.Pass[i].RecoveryFactor+"</td>"; s=s+"<td>"+aOpt.Pass[i].SharpeRatio+"</td>"; s=s+"<td>"+aOpt.Pass[i].Custom+"</td>"; s=s+"<td>"+aOpt.Pass[i].EquityDD_perc+"</td>"; s=s+"<td>"+aOpt.Pass[i].Trades+"</td>"; string cs=RGBToStr(r,g,b); s=s+"<td title='"+cs+"' style='background-color: "+cs+"'> </td>"; for(int j=0;j<pc;j++){ s=s+"<td>"+aOpt.Pass[i].Parameters[j]+"</td>"; } s=s+"</tr>"; } s=s+"</table>"; return(s); }
Let us consider this function in more detail. We receive the number of optimization passes to the 'size' variable, the number of optimized parameters is received to the pc variable and the size of the array with the parameter names (which is declared at the global level) is received to the nc variable:
int size=ArraySize(aOpt.Pass);

int pc=ArraySize(aOpt.ParameterName);

int nc=ArraySize(co_names);
Global array co_names[]:
string co_names[]={"Result","Profit","Expected Payoff",
                   "Profit Factor","Recovery Factor",
                   "Sharpe Ratio","Custom","Equity DD","Trades"};
The HTML code of the table will be added to the s variable during its formation, thus during declaration of the variable we will add the table beginning tag:
string s="<table>";
Then add the row beginning tag and the first cell of the header with the "Pass" text:
s=s+"<tr>";
s=s+"<th>Pass</th>";
The "Pass" column is followed by columns with parameters, any of which can be used to form the color indication. Firming the HTML code for the cells:
for(int i=0;i<nc;i++){
   s=s+"<th"+HStyle(i,i1,i2,i3)+">"+co_names[i]+"</th>";
}
If necessary, the HStyle() function forms a code which changes the cell background color:
string HStyle(int i,int i1,int i2,int i3){
   if(i==i1)return(" style='background-color: rgb(255,0,0);'");
   if(i==i2)return(" style='background-color: rgb(0,255,0);'");
   if(i==i3)return(" style='background-color: rgb(0,0,255);'");
   return("");
}
Forming text for the cell with the color indication header:
s=s+"<th>"+ColorCollHeader(i1,i2,i3)+"</th>";
The ColorCollHeader() function code:
string ColorCollHeader(int i1,int i2,int i3){
   return(co_names[i1]+"-R,<br>"+co_names[i2]+"-G,<br>"+co_names[i3]+"-B");
}
Then we form the HTML code for the cells containing the names of optimized parameters and end the table row:
for(int j=0;j<pc;j++){
   s=s+"<th>"+aOpt.ParameterName[j]+"</th>";
}
s=s+"</tr>";
After that three auxiliary variables are declared: r, g, b. This is followed by a loop in which the HTML code of all report rows is formed. The RGB component values are calculated at the beginning of each loop:
ComponentsToRGB(aOpt.Pass[i].ColorComponent[0],
                aOpt.Pass[i].ColorComponent[1],
                aOpt.Pass[i].ColorComponent[2],
                r,g,b);
The ComponentsToRGB() function code:
void ComponentsToRGB(double c1,double c2,double c3,int & r,int & g,int & b){
   r=(int)(c1*255.0);
   g=(int)(c2*255.0);
   b=(int)(c3*255.0);
}
Then the HTML code of a row is formed with the cells containing testing results:
s=s+"<tr>";

s=s+"<td>"+aOpt.Pass[i].Pass+"</td>";
s=s+"<td>"+aOpt.Pass[i].Result+"</td>";
s=s+"<td>"+aOpt.Pass[i].Profit+"</td>";
s=s+"<td>"+aOpt.Pass[i].ExpectedPayoff+"</td>";
s=s+"<td>"+aOpt.Pass[i].ProfitFactor+"</td>";
s=s+"<td>"+aOpt.Pass[i].RecoveryFactor+"</td>";
s=s+"<td>"+aOpt.Pass[i].SharpeRatio+"</td>";
s=s+"<td>"+aOpt.Pass[i].Custom+"</td>";
s=s+"<td>"+aOpt.Pass[i].EquityDD_perc+"</td>";
s=s+"<td>"+aOpt.Pass[i].Trades+"</td>";
Then comes the color indication cell. RGB components are first converted to a string using the RGBToStr() function; after that the cell code is formed:
string cs=RGBToStr(r,g,b); s=s+"<td title='"+cs+"' style='background-color: "+cs+"'> </td>";
RGBToStr() function code:
string RGBToStr(int r,int g,int b){
   return("rgb("+(string)r+","+(string)g+","+(string)b+")");
}
Cells with the values of parameters under optimization are shown at the end of the row:
for(int j=0;j<pc;j++){
   s=s+"<td>"+aOpt.Pass[i].Parameters[j]+"</td>";
}

s=s+"</tr>";
The table is closed and the s variable contents are returned at the end of the function:
s=s+"</table>";

return(s);
Planes with optimized parameters
The plane can be drawn when there are two or more optimized parameters. The plane is shown in Fig. 2.
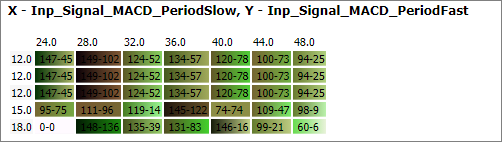
Fig. 2. Optimized parameters plane
The first line shows which parameters correspond to the plane axes: values of Inp_Signal_MACD_PeriodSlow are shown along the X axis (horizontally) and Inp_Signal_MACD_PeriodFast values are displayed along the Y axis. The gradient in the cells shows how the testing results were changing for this pair of values of X and Y parameters when other parameters were changed. The color of the worst value is shown on the left, and that of the best of is on the right. The best and the worst variants are determined based on the previously mentioned sorting factor, which is calculated as the arithmetic mean of the abstract color components.
The HTML code of the planes is formed in the Color2DPlanes() function. All possible combinations of two optimized parameters are found in this function, and the HTML plane code is generated for each pair. The Color2DPlanes() function code:
string Color2DPlanes(SOptimization2 & aOpt){
   string s="";
   int pc=ArraySize(aOpt.ParameterName);
   for(int y=0;y<pc;y++){
      for(int x=y+1;x<pc;x++){
         s=s+Color2DPlane(aOpt,x,y);
      }
   }
   return(s);
}
HTML code of one plane is formed in the Color2DPlane() function:
string Color2DPlane(SOptimization2 & aOpt,int xi,int yi){ double xa[]; double ya[]; int cnt=ArraySize(aOpt.Pass); ArrayResize(xa,cnt); ArrayResize(ya,cnt); for(int i=0;i<cnt;i++){ xa[i]=aOpt.Pass[i].dParameters[xi]; ya[i]=aOpt.Pass[i].dParameters[yi]; } ArraySort(xa); ArraySort(ya); int xc=1; int yc=1; for(int i=1;i<cnt;i++){ if(xa[i]!=xa[i-1]){ xa[xc]=xa[i]; xc++; } if(ya[i]!=ya[i-1]){ ya[xc]=ya[i]; yc++; } } string s="<hr><h3>X - "+aOpt.ParameterName[xi]+", Y - "+aOpt.ParameterName[yi]+"</h3><table>"; s=s+"<tr>"; s=s+"<td> </td>"; for(int x=0;x<xc;x++){ s=s+"<td>"+(string)xa[x]+"</td>"; } s=s+"</tr>"; for(int y=0;y<yc;y++){ s=s+"<tr>"; s=s+"<td>"+(string)ya[y]+"</td>"; for(int x=0;x<xc;x++){ double mx=0; double mn=DBL_MAX; int mxi=0; int mni=0; for(int i=0;i<cnt;i++){ if(aOpt.Pass[i].dParameters[yi]==ya[y] && aOpt.Pass[i].dParameters[xi]==xa[x] ){ if(aOpt.Pass[i].SortFactor>mx){ mx=aOpt.Pass[i].SortFactor; mxi=i; } if(aOpt.Pass[i].SortFactor<mn){ mn=aOpt.Pass[i].SortFactor; mni=i; } } } int mnr,mng,mnb; int mxr,mxg,mxb; ComponentsToRGB(aOpt.Pass[mni].ColorComponent[0], aOpt.Pass[mni].ColorComponent[1], aOpt.Pass[mni].ColorComponent[2], mnr,mng,mnb); ComponentsToRGB(aOpt.Pass[mxi].ColorComponent[0], aOpt.Pass[mxi].ColorComponent[1], aOpt.Pass[mxi].ColorComponent[2], mxr,mxg,mxb); string title=RGBToStr(mnr,mng,mnb)+"/"+RGBToStr(mxr,mxg,mxb)+"\n"; int digits[]={2,2,6,6,6,6,6,4,0}; for(int k=0;k<ArraySize(co_names);k++){ title=title+co_names[k]+": "+DoubleToString(aOpt.Pass[mni].factor[k],digits[k])+ "/"+DoubleToString(aOpt.Pass[mxi].factor[k],digits[k])+"\n"; } s=s+"<td title='"+title+"' style='background: linear-gradient(to right, rgb("+ (string)mnr+","+(string)mng+","+(string)mnb+"), rgb("+ (string)mxr+","+(string)mxg+","+(string)mxb+"));'> "+ (string)mni+"-"+(string)mxi+"</td>"; } s=s+"</tr>"; } s=s+"<table>"; return(s); }
Let us consider the Color2DPlane() function in more detail. The following is input to the function: SOptimization2 structure containing all data from the optimization report and two int variable xi and yi, which are the indices of the pair of optimized parameters for which a plane will be created. First, we will collect all possible values of each of the pair of parameters into arrays. For this we declare two arrays, change their sizes according to the number of optimization passes and fill them with all the possible values:
double xa[];
double ya[];

int cnt=ArraySize(aOpt.Pass);

ArrayResize(xa,cnt);
ArrayResize(ya,cnt);

for(int i=0;i<cnt;i++){
   xa[i]=aOpt.Pass[i].dParameters[xi];
   ya[i]=aOpt.Pass[i].dParameters[yi];
}
Only unique values of parameters should be used so let us sort the arrays and move unique values to the beginning of the arrays:
ArraySort(xa);
ArraySort(ya);

int xc=1;
int yc=1;

for(int i=1;i<cnt;i++){
   if(xa[i]!=xa[i-1]){
      xa[xc]=xa[i];
      xc++;
   }
   if(ya[i]!=ya[i-1]){
      ya[xc]=ya[i];
      yc++;
   }
}
After that the xc variable contains the number of unique values of one parameter, and yc contains those of the other parameter. The HTML code of the plane will be added to the s variable during its formation. Let us add information about the names of the variables and the table opening tag immediately during the s variable declaration:
string s="<hr><h3>X - "+aOpt.ParameterName[xi]+", Y - "+aOpt.ParameterName[yi]+"</h3><table>";
Let's create the first table row containing the x parameter values:
s=s+"<tr>"; s=s+"<td> </td>"; for(int x=0;x<xc;x++){ s=s+"<td>"+(string)xa[x]+"</td>"; } s=s+"</tr>";
After that loop through all variants of the y parameter:
for(int y=0;y<yc;y++){
In this loop, start a row at each pass and add a cell with the y parameter value:
s=s+"<tr>";

s=s+"<td>"+(string)ya[y]+"</td>";
Then add cells with the gradient (they are added in a loop through all x parameter variants):
for(int x=0;x<xc;x++){
To create a gradient, it is necessary to find the best and worst optimization passes:
double mx=0;
double mn=DBL_MAX;
int mxi=0;
int mni=0;

for(int i=0;i<cnt;i++){
   if(aOpt.Pass[i].dParameters[yi]==ya[y] &&
      aOpt.Pass[i].dParameters[xi]==xa[x]
   ){
      if(aOpt.Pass[i].SortFactor>mx){
         mx=aOpt.Pass[i].SortFactor;
         mxi=i;
      }
      if(aOpt.Pass[i].SortFactor<mn){
         mn=aOpt.Pass[i].SortFactor;
         mni=i;
      }
   }
}
After the execution of this code part, the mxi and mni variables will contain the indices of the best and worst optimization pass.
Abstract color components then need to be converted to RGB:
ComponentsToRGB(aOpt.Pass[mni].ColorComponent[0],
                aOpt.Pass[mni].ColorComponent[1],
                aOpt.Pass[mni].ColorComponent[2],
                mnr,mng,mnb);

ComponentsToRGB(aOpt.Pass[mxi].ColorComponent[0],
                aOpt.Pass[mxi].ColorComponent[1],
                aOpt.Pass[mxi].ColorComponent[2],
                mxr,mxg,mxb);
For a more efficient analysis of the planes, let us add tooltips (can be added using the HTML attribute 'title'):
string title=RGBToStr(mnr,mng,mnb)+"/"+RGBToStr(mxr,mxg,mxb)+"\n";

int digits[]={2,2,6,6,6,6,6,4,0};

for(int k=0;k<ArraySize(co_names);k++){
   title=title+co_names[k]+": "+DoubleToString(aOpt.Pass[mni].factor[k],digits[k])+
   "/"+DoubleToString(aOpt.Pass[mxi].factor[k],digits[k])+"\n";
}
The titles are shown in Fig. 3.
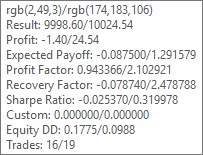
Fig. 3. A tooltip for one cell of the plain
The tooltip contains all data about the worst and best optimization pass (the worst / the best). The component values of the RGB gradient are shown in the first line of the tooltip.
Now proceed to the most important part, to the gradient:
s=s+"<td title='"+title+"' style='background: linear-gradient(to right, rgb("+ (string)mnr+","+(string)mng+","+(string)mnb+"), rgb("+ (string)mxr+","+(string)mxg+","+(string)mxb+"));'> "+ (string)mni+"-"+(string)mxi+"</td>";
The gradient display was checked in the following web browsers: Opera, Google Chrome, Yandex browser and Microsoft-Edge. In all of them it works well.
Add the row end tag at the end of each row:
s=s+"</tr>";
At the end of the table, add the table end tag and return the formed HTML code:
s=s+"<table>";

return(s);
Now let us call the functions from the script:
string report=HTMLStart("Color Optimization","style2.css")+
TableContent(opt,Factor1,Factor2,Factor3)+
Color2DPlanes(opt)+HTMLEnd();
I used the HTMLStart() and HTMLEnd() functions from the article Analyzing trading results using HTML reports. The styles file from the same article was slightly changed and renamed to style2.css.
The ready files are attached below: ColorOptimization.mqh and the ColorOptimization.mq5 script.
Modification of the color model
Code in ColorOptimization.mqh is structured so that you can easily amend it for a different color model. Let us try to add the CMY color model. For this, we need to perform a few preliminary steps.
1. Copy ColorOptimization.mqh and ColorOptimization.mq5 and save them as ColorOptimization2.mqh and ColorOptimization2.mq5.
2. Add to ColorOptimization2.mqh two constants for the two color model types and a global variable, which will determine the color model:
#define MODEL_RGB 0
#define MODEL_CMY 1

int co_ColorModel;
3. Add an enumeration and an external variable, using which the user will select the color model:
enum EColorModel{
   RGB=MODEL_RGB,
   CMY=MODEL_CMY
};

input EColorModel          ColorModel     =  RGB;
At the beginning of the script's OnStart() function, assign the value selected in the properties window to the co_ColorModel variable:
co_ColorModel=ColorModel;
The main amendments are performed in the ColorOptimization2.mqh file functions. First of all we need to change ComponentsToRGB(). The values of components in the CMY model range from 0 to 1 and thus the values of components of the report data structure correspond to CMY components and can be recalculated to RGB. Here is the ComponentsToRGB() structure:
void ComponentsToRGB(double c1,double c2,double c3,int & r,int & g,int & b){
   if(co_ColorModel==MODEL_RGB){
      r=(int)(c1*255.0);
      g=(int)(c2*255.0);
      b=(int)(c3*255.0);
   }
   else if(co_ColorModel==MODEL_CMY){
      CMYtoRGB(c1,c2,c3,r,g,b);
   }
}
The transformation of the CMY model to RGB is implemented in a separate function:
void CMYtoRGB(double C,double M,double Y,int & R,int & G,int & B){
   R=(int)((1.0-C)*255.0);
   G=(int)((1.0-M)*255.0);
   B=(int)((1.0-Y)*255.0);
}
Other modifications only concern auxiliary report elements. Revision of the HStyle() function for a proper coloring of the table's header row cells:
string HStyle(int i,int i1,int i2,int i3){
   if(co_ColorModel==MODEL_RGB){
      if(i==i1)return(" style='background-color: rgb(255,0,0);'");
      if(i==i2)return(" style='background-color: rgb(0,255,0);'");
      if(i==i3)return(" style='background-color: rgb(0,0,255);'");
   }
   else if(co_ColorModel==MODEL_CMY){
      if(i==i1)return(" style='background-color: rgb(0,255,255);'");
      if(i==i2)return(" style='background-color: rgb(255,0,255);'");
      if(i==i3)return(" style='background-color: rgb(255,255,0);'");
   }
   return("");
}
Revision of the ColorCollHeader() function for a correct header of the color indication column:
string ColorCollHeader(int i1,int i2,int i3){
   if(co_ColorModel==MODEL_RGB){
      return(co_names[i1]+"-R,<br>"+co_names[i2]+"-G,<br>"+co_names[i3]+"-B");
   }
   else if(co_ColorModel==MODEL_CMY){
      return(co_names[i1]+"-C,<br>"+co_names[i2]+"-M,<br>"+co_names[i3]+"-Y");
   }
   return "";
}
Then, a few amendments need to be made to the tooltips of the main table and color planes. For the main table, we need to change the value of the 'title' attribute in the TableContent(). The following lines:
string cs=RGBToStr(r,g,b); s=s+"<td title='"+cs+"' style='background-color: "+cs+"'> </td>";
should be changed as follows:
string ts="",cs=RGBToStr(r,g,b);
if(co_ColorModel==MODEL_RGB){
ts=cs;
}
else if(co_ColorModel==MODEL_CMY){
ts=CMYToStr(aOpt.Pass[i].ColorComponent[0],
aOpt.Pass[i].ColorComponent[1],
aOpt.Pass[i].ColorComponent[2]);
}
s=s+"<td title='"+ts+"' style='background-color: "+cs+"'> </td>";
The 'title' attribute in the Color2DPlane() function should be changed to set proper titles for planes. The line:
string title=RGBToStr(mnr,mng,mnb)+"/"+RGBToStr(mxr,mxg,mxb)+"\n";
should be changes as follows:
string title="";

if(co_ColorModel==MODEL_RGB){
   title=RGBToStr(mnr,mng,mnb)+"/"+RGBToStr(mxr,mxg,mxb)+"\n";
}
else if(co_ColorModel==MODEL_CMY){
   title=CMYToStr(aOpt.Pass[mni].ColorComponent[0],
                  aOpt.Pass[mni].ColorComponent[1],
                  aOpt.Pass[mni].ColorComponent[2])+"/"+
         CMYToStr(aOpt.Pass[mxi].ColorComponent[0],
                  aOpt.Pass[mxi].ColorComponent[1],
                  aOpt.Pass[mxi].ColorComponent[2])+"\n";
}
Now, the color model type can be selected during script launch. The difference between CMY and RGB is than in CMY the best values are shown in black and other colors will also be different (Figures 4, 5).
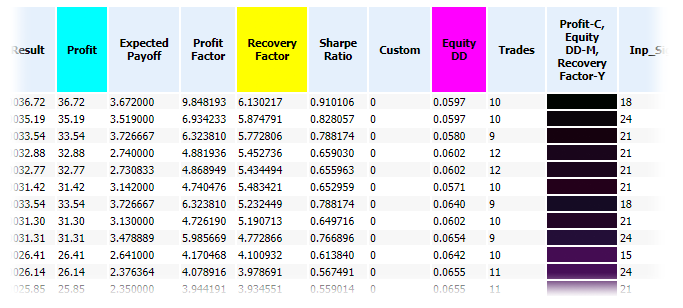
Fig. 4. Fragment of a report created using the CMY color model
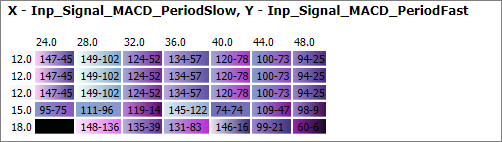
Fig. 5. The color plane in the CMY color model
How to interpret color indications
The best options in RGB are close to white and in CMY they are close to black. For a proper interpretation of other colors, we need to understand how individual components within the color model are combined and how the resulting color is formed.
Let us view the RGB model in more detail. When the values of all components are equal to 0, we get the black color. When all components are equal to the maximum value, the color is white. All other combinations provide different colors. If one of the components has the highest value, and the other two are equal to 0, we get the clear color of the appropriate component: red, green or blue. If two components have maximum values and the third one is zero, the resulting color is also clear. Red and green result in yellow, green and blue provide cyan, red and blue are shown as magenta. Figure 6 shows several combinations of RGB components.
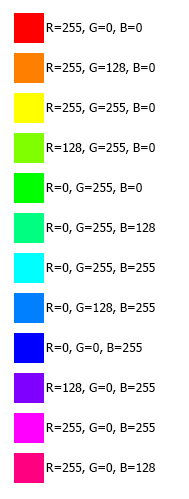
Fig. 7. Basic combinations of RGB components
Based on the shade, we can understand which parameters indicator contributes more positively to the testing result. If red, it is the first parameter; if the color is yellow, then the first and second ones; green means the third parameter, etc.
Colors in the RGB model are added similarly to colored lights. In the CMY model, values are subtracted from white, so the maximum value of all components corresponds to black. The CMY model is similar to mixing paints: if there are no paints, then we have a white sheet of paper; if you mix too many different paints, you get black color (or rather a dirty color when dealing with real paints). Figure 8. shows the basic combinations of CMY components.
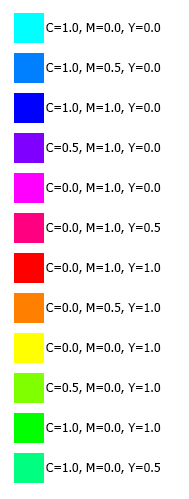
Fig. 7. Basic combinations of CMY components
Colors in CMY are shifted in comparison with RGB. Here is the interpretation: cyan is the first parameter, blue means the first and the second, magenta stands for the second one, red appears for the second and third values, yellow is used for the third and green is used for the first and third parameters.
As you can see, there is no fundamental difference in using RGB or CMY model.
Conclusion
The perception of colors is a subjective process and it is therefore difficult to make clear conclusions about the convenience and benefits of the color representation. At least one visual indication, the degree of light (which means closeness to white in RGB), allows evaluating the combination of the three parameters. This can simplify the report analysis. When the selection is automated, like in this article, the decision based on a sorted table is made in accordance with the arithmetic mean of the three values. This can be considered the first step into the area of fuzzy logic, using which the final value can be calculated not as a simple arithmetic mean, but in a more complex way. However, we need more practical experimenting to evaluate the effectiveness of this method.
Attachments
- HTMLReport.mqh — file with the report parsing functions (See the article Analyzing trading results using HTML reports);
- ColorOptimization.mqh — file with functions for creating color reports using the RGB model;
- ColorOptimization.mq5 — script with the ColorOptimization.mqh function use example;
- ColorOptimization2.mqh — file with functions for the creation of colored reports with a selection between RGB and CMY;
- ColorOptimization2.mq5 — script with the ColorOptimization2.mqh function use example;
- ReportOptimizer-555849.xml — file with the optimization report used in the article;
- ColorOptimization.htm — file with the report obtained through the ColorOptimization.mq5 script;
- ColorOptimization2.htm — file with the report obtained through the ColorOptimization2.mq5 script (the CMY color model).
- Style2.css — file with styles for the reports created by ColorOptimization.mq5 and ColorOptimization2.mq5.
Translated from Russian by MetaQuotes Ltd.
Original article: https://www.mql5.com/ru/articles/5437
 MetaTrader 5 and Python integration: receiving and sending data
 Studying candlestick analysis techniques (Part II): Auto search for new patterns
- Free trading apps
- Over 8,000 signals for copying
- Economic news for exploring financial markets
You agree to website policy and terms of use