Horizontal diagrams on MеtaTrader 5 charts
Andrei Novichkov | 25 February, 2019
Introduction
Horizontal diagrams are not a common occurrence on the terminal charts but they can still be of use in a number of tasks, for example when developing indicators displaying volume or price distribution for a certain period, when creating various market depth versions, etc. There may be more exotic tasks concerning distribution of custom (standard) indicator values. But in any case, they all have a common feature — diagrams that should be created, placed, scaled, moved and deleted. Let's highlight the following points:
- There may be several diagrams (this is the case in majority of occasions).
- Most diagrams we are interested in consist of bars.
- Diagram bars are located horizontally.
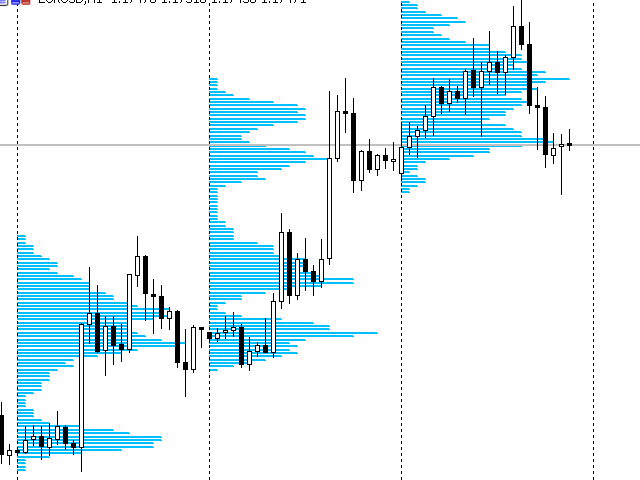
Let's use a well-known example to see how such diagrams might look:
Below is another example. The same diagrams drawn by graphical primitives:
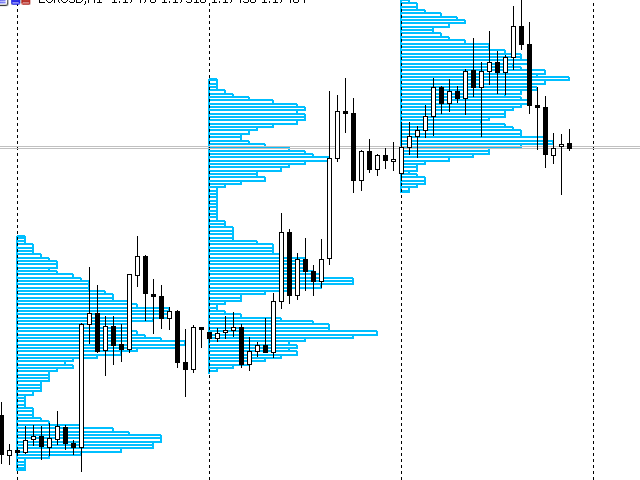
In this case, this is the indicator displaying tick volume distribution by days. This example shows quite clearly what tasks the developer has to solve:
- Create multiple graphical objects, assign unique names to them and place them on the chart.
- Scale and move the objects as needed.
- Remove them from the chart when the indicator's work is done.
Once again, we should note that there are several diagrams, which will further enable us to talk about an array of diagrams.
Below is a final example:
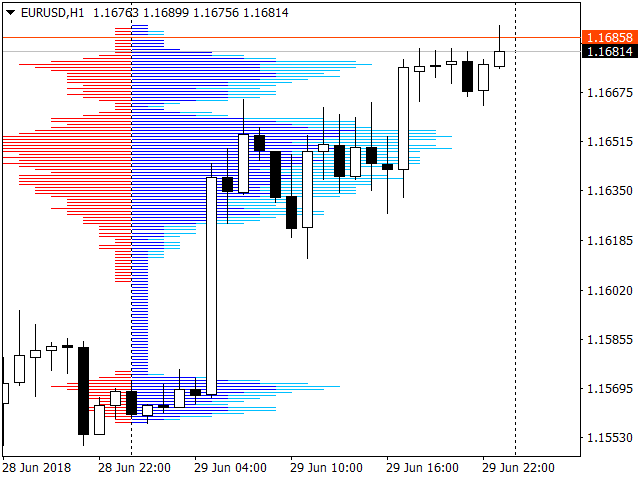
Here we can see a more complex version of tick volumes distribution. Despite the fact that the diagram looks whole, it consists of three different diagrams located in one place, namely:
- "Sell tick volumes"
- "Buy tick volumes"
- "Total tick volumes"
You may ask: "Are there any easier ways to display the data? Do we have to manage such a great number of graphical primitives?" Easier methods can indeed be found and their efficiency should be analyzed. However, the easiest way to solve the entire set of tasks mentioned at the very beginning of the article is to use the horizontal diagrams shown in the examples.
Setting a task
Let's outline our plan in two major parts:
- Since all graphical primitives have coordinates of bindings in the form of time and price, it is obvious that we should receive the arrays of bindings allowing to position diagrams on a chart.
- Using the arrays obtained at the first stage, it is necessary to display the diagrams and manage them.
Let's define the main ways of binding graphical objects using our case as an example. The first screenshots show, perhaps, the most common location of horizontal diagrams. They are bound to the start of a certain period. Here, it is start of the day.
This, of course, does not exhaust the list of time coordinate binding options. Another option is binding to the left or right side of the terminal window. It may be used, for example, when a diagram covers a very long period of time, and its beginning is outside the visible window. Binding to the left side of the window can be used in that case.
Yet another option is binding the diagram to the current period, while avoiding excessive number of objects on the working part of the chart. In this case, the right side of the terminal can be used. In any case, one of the time coordinates of the graphical primitives making up the diagram remains the same. Another coordinate (the one that calculates the "column horizontal length" of the diagram) is calculated.
The case is much simpler with regard to the price binding of the graphical primitives. A certain price segment is divided into intervals having a fixed step. For example, a price segment can be assumed to be equal to one hundred percent, while a step is equal to ten percent. In this case, we can obtain diagrams with a constant number of "horizontal bars" leading to a considerable rounding of the results in some cases. Therefore, in this article, we will apply a more efficient method, which will be considered a bit later.
From the above, we can conclude that the array of price bindings may not be needed in this case. We can use the following simple equation to calculate the i th price binding:
i th price binding = start of the diagram price interval + i * interval division step.
For the already provided examples with tick volumes, the price interval the diagrams may be built on is represented by the interval between Low and High of the examined period.
The diagram display issue should also be detailed. Thus, we have obtained arrays with bindings for diagrams following the principle: "one diagram – one set of arrays for binding". Another obvious observation: Charts often feature diagrams based on similar graphical primitives of the same color and "style" (for example, the diagrams on the second and first screenshots). On the third screenshot, all diagrams are different varying by color and "direction". One diagram has its columns "directed" from right to left, while two others – from left to right. It would be logical to combine "same-type" diagrams (like on the first two screenshots) into one array and allocate a manager to control it. Let's use the following principle to standardize the task even more:
- Each set of "same-type" diagrams should have its own manager even if the set consists of one diagram. Thus, the array of at least three diagrams managed by one manager is to be created for the first two screenshots, while for the diagram on the third screenshot, we will have to create three arrays (each consisting of one diagram) and three managers (one per each array).
Thus, we have outlined the main development points. However, there is some fundamental specificity here. As you may remember, horizontal diagrams display various distributions, like tick volumes, prices, etc. Therefore, the methods and principles for obtaining source arrays for binding graphical primitives can be very different, and it is not reasonable to create a library file for this part of the task.
In particular, a more efficient approach will be used when developing a training indicator of tick volumes distribution by days. This article offers yet another method. In other words, the first part of the task will be solved in different ways on each occasion. On the contrary, the second part of the task (developing an array of diagrams and managing this array with the help of a manager or developing several "manager - array of diagrams" associations) will be almost the same in all cases. This allows creating a library file to be included in all projects involving horizontal diagrams.
The last thing we should specify is what exactly the diagrams are to consist of. The diagrams will be made of either horizontal line segments or rectangles. These are the two most natural options.
Now let's proceed directly to the code.
Constants and inputs
It is pretty obvious that many of the mentioned diagram parameters are to be stored using enumerated types.
Location of diagrams:
enum HD_POSITION
{
        HD_LEFT  = -1,
        HD_RIGHT =  1,
        HD_CNDLE =  2
};
There are three diagram placement options — binding to the left side of the terminal (HD_LEFT), binding to the right one (HD_RIGHT), binding to a candle (HD_CNDLE) or to candles. On all the three screenshots at the beginning of the article, the diagrams are placed using HD_CNDLE. On the first two, the binding is performed to candles at the beginning of certain periods (start of a day), while on the third one, the binding is made to a single candle located at the start of the current day.
The diagram appearance (graphical primitives):
enum HD_STYLE
{
        HD_LINE      = OBJ_HLINE,
        HD_RECTANGLE = OBJ_RECTANGLE,
};
There are two appearance options — horizontal line segments (HD_LINE) and rectangles (HD_RECTANGLE). On the first and third screenshots at the beginning of the article, the diagrams consist of HD_LINE primitives, while on the second one, they are made of HD_RECTANGLE.
Direction of the diagrams' "horizontal bars":
enum HD_DIRECT
{
   HD_LEFTRIGHT = -1,
   HD_RIGHTLEFT =  1
};
On the third screenshot, the diagram consisting of red segments is displayed as HD_RIGHTLEFT, while two others are shown as HD_LEFTRIGHT.
The last enumerated type is related to the number of diagram levels. I have already mentioned that the best method is to be used for calculating the number of levels rather than a simple splitting of a price interval into a given number of levels. It is very important to note that this enumerated type is related to the first part of Setting a task, therefore, it will not be included into the final library file.
The applied method is very simple and comes down to rounding the price level to a nearest ten or hundred. Accordingly, the step size of price levels will also be equal to ten or one hundred. With this approach, the number of price levels varies. For those willing to obtain the maximum calculation currency (along with increased resource consumption), the HD_MIN method with no rounding is left:
enum HD_ZOOM {
   HD_MIN    = 0,  //1
   HD_MIDDLE = 1,  //10
   HD_BIG    = 2   //100
};
The HD_MIDDLE method is applied by default.
Let's consider the following example. We will use a training indicator displaying tick volumes distribution as a development object. The work of a similar indicator is provided as an example in the first two screenshots at the beginning of the article.
Let's move to the inputs block:
input HD_STYLE        hdStyle      = HD_LINE;
input int             hdHorSize    = 20;
input color           hdColor      = clrDeepSkyBlue;
input int             hdWidth      = 2;
input ENUM_TIMEFRAMES TargetPeriod = PERIOD_D1;
input ENUM_TIMEFRAMES SourcePeriod = PERIOD_M1;
input HD_ZOOM         hdStep       = HD_MIDDLE;
input int             MaxHDcount   = 5;
input int             iTimer       = 1;
Why is there no parameter responsible for positioning? The answer is obvious. Only one positioning method is applicable for the required indicator - HD_CNDLE. Therefore, we may leave it unspecified.
The HD_STYLE parameter function is quite obvious and requires no additional clarification.
- The hdHorSize parameter plays an important role. It defines the maximum size of the diagram's "horizontal bar" in candles. In this case, the longest "horizontal column" cannot exceed twenty candles. It is clear that the larger this parameter, the more accurate the diagram. However, if the parameter is too big, the diagrams start overlapping each other.
- The hdColor and hdWidth parameters deal with the diagrams' appearance (color and line width accordingly).
- The TargetPeriod contains the analyzed timeframe. In that case, the indicator displays the distribution of tick volumes within a day.
- The SourcePeriod parameter contains a timeframe the indicator takes the source data from to build the distribution. The M1 timeframe is used in this case. Use this parameter with caution. If the monthly timeframe is selected as the analyzed one, calculations may take a long time.
- The hdStep parameter rounds price levels. I have already described it above.
- The MaxHDcount parameter contains the maximum number of diagrams on a chart. Keep in mind that each diagram consists of multiple graphical primitives. Too many diagrams may slow down the terminal operation.
- The iTimer parameter contains the timer triggering frequency. When triggered, creation of new candles is checked and necessary actions are performed. The PeriodSeconds(SourcePeriod) call result could have been placed here. But the default value is one second, which allows us to determine the exact moment new candles appear more accurately.
Initialization
At this stage, we need to create the object of the diagram manager. Since all the diagrams are of the same type, we need only one manager. Since the class of the manager itself is not written yet, just remember that it is created here, in the OnInit() handler. Two diagrams are also created (but not drawn) here:
- Diagram displaying tick volume distribution for the current period. This diagram is to be redrawn periodically.
- Diagram displaying tick volume distribution on history. These distributions are not redrawn, so the diagram "forgets" about them after they are displayed, and control is given to the terminal.
The mentioned efficiency of the approach is that the indicator does not manage graphical primitives of the diagrams whose appearance does not change.
Next, the variables are initialized for subsequent calculations of price levels with a step. There are two such variables. They are derived from Digit() and Point():
   hdDigit = Digits() - (int)hdStep;
   switch (hdStep)
    {
      case HD_MIN:
         hdPoint =       Point();
         break;
      case HD_MIDDLE:
         hdPoint = 10 *  Point();
         break;
      case HD_BIG:
         hdPoint = 100 * Point();
         break;
      default:
         return (INIT_FAILED);
    }
Some minor actions and the launch of the timer take place in this handler as well.
Basic calculations
The next task is divided into two stages:
- Calculating necessary data and drawing the required number of diagrams except the current one. These diagrams will not change any more, and it is enough to display them once.
- Calculating necessary data and drawing diagrams for a period including the present one. Calculations for this point should be repeated periodically. This can be done in the OnTimer() handler.
Let's perform some of the work in the OnCalculate () handler while in the form of pseudo-code:
int OnCalculate(...)
  {
   if (prev_calculated == 0 || rates_total > prev_calculated + 1) {
   }else {
      if (!bCreateHis)
       {
         int br = 1;
         while (br < MaxHDcount) {
           {
            if(Calculate for bar "br")
                 {
                  sdata.bRemovePrev = false;
                  Print("Send data to the new Diagramm");
                 }

           }
         ChartRedraw();
         bCreateHis = true;
      }
   }
   return(rates_total);
  }
The necessary calculations are performed and the required number of diagrams except the current one are drawn here. To achieve this, calculations are performed in a loop for each bar of the TargetPeriod timeframe starting from the first one and ending with MaxHDcount. If the calculations are successful, a command is given to the manager to draw the diagram passing new data to the manager in the same loop. At the end of the entire loop, the diagram is redrawn and a flag is set to indicate that this part of the work is no longer necessary. The diagrams themselves are now controlled by the terminal.
Creating and drawing the diagram including the current period are performed in the OnTimer() handler. I am not going to show the pseudo-code here due to the obvious simplicity and clarity of the issue:
- Wait for a new candle in the SourcePeriod timeframe.
- Perform necessary calculations.
- Send data to the current-period diagram for creating and drawing new primitives.
Other handlers and indicator functions are not so interesting and are available in the attached code. Now it is time to describe the classes responsible for creating, drawing and managing diagrams.
Diagram management class
Let's start from the manager handling horizontal diagrams. This is a class that does not feature graphical primitives itself, while managing the array of other classes containing such primitives. Since all diagrams are of the same type in a single manager (as mentioned above), many properties of such diagrams are the same. Therefore, it does not make sense to keep the same set of properties in each diagram. Instead, it is worthwhile to put a single set of properties in the manager. Let's name the manager class "CHDiags" and start writing the code:
- Closed fields of the CHDiags class containing, among other things, a set of properties, which is the same for all diagrams under the control of this manager:
private:
                HD_POSITION m_position;
                HD_STYLE    m_style;
                HD_DIRECT   m_dir;
                int         m_iHorSize;
                color       m_cColor;
                int         m_iWidth;
                int         m_id;
                int         m_imCount;
                long        m_chart;
                datetime    m_dtVis;
   static const string      m_BaseName;
                CHDiagDraw* m_pHdArray[];
Describe the set:
- m_position, m_style, m_dir — these three parameters describe the binding and appearance of diagrams. We have already described them.
- m_iHorSize — maximum possible horizontal size of the diagram. We have described it as well.
- m_cColor and m_iWidth — diagram color and line width.
- m_id — unique manager ID. Given that there may be more than one, each of them should have a unique ID. It is required to form unique object names.
- m_chart — ID of the chart the diagrams are displayed on. By default, the value of this field is zero (the current chart).
- m_imCount — maximum number of diagrams on a chart. Ultimately, the number of diagrams on a chart is determined by this and the following fields.
- m_dtVis — do not create diagrams to the left of this timestamp.
- m_BaseName — extremely important parameter that defines the "base" name. All elements of the diagrams, as well as the diagrams themselves, should have unique names to be successfully created. Such names are given following the "base" name.
- m_pHdArray[] — array with pointers to objects containing individual diagrams. This field is not a property and there is no GetXXXX() function for it.
There is no SetXXXX() function for the properties. All of them (except m_BaseName) are set in the class constructor. The m_dtVis field is another exception. It is set in the constructor by the bool type parameter having the following meaning:
- Display diagrams only on the candles visible in the terminal window. This is done in order not to load the terminal by displaying diagrams located to the left of the left terminal border. The default is 'true'.
After creating the manager, we can create objects — diagrams. This is done by the CHDiags class method:
int CHDiags::AddHDiag(datetime dtCreatedIn)
The method returns the index of the created CHDiagDraw class object in the m_pHdArray array of the manager, or -1 in case of an error. The diagram start timing is passed to the dtCreatedIn method as a parameter. For example, the daily candle open time is passed to the analyzed indicator here. If the timestamp is not used (candles are bound to the terminal window borders), TimeCurrent() should be passed here. If the diagram is located to the left of the m_dtVis field timestamp, the object is not created. The following code shows how the method works:
int CHDiags::AddHDiag(datetime dtCreatedIn) {
   if(dtCreatedIn < m_dtVis ) return (-1);
   int iSize = ArraySize(m_pHdArray);
   if (iSize >= m_imCount) return (-1);
   if (ArrayResize(m_pHdArray,iSize+1) == -1) return (-1);
   m_pHdArray[iSize] = new CHDiagDraw(GetPointer(this) );
   if (m_pHdArray[iSize] == NULL) {
      return (-1);
   }
   return (iSize);
}//AddHDiag()
As you can see, the method performs some checks, increases the size of the array to save the diagrams and creates the desired object passing a pointer to the manager itself for later access to the properties.
The manager also features other methods allowing you to interact the diagram, albeit not directly but exclusively via the diagram manager:
   bool        RemoveDiag(const string& dname);
   void        RemoveContext(int index, bool bRemovePrev);
   int         SetData(const HDDATA& hddata, int index);
- The first method, as is clear from its name, completely removes the diagram from the manager and from the chart using the name of the diagram as a parameter. Currently, this is a reserved option.
- The second one removes only graphical primitives the diagram consists of. The diagram is removed from the chart but is present in the manager, while being "empty". The bRemovePrev flag value is clarified further.
- The third method passes the structure with input data for creating graphical primitives and drawing the diagram. The diagram index in the manager's m_pHdArray array is used as a parameter in the current and the previous methods.
The last method that is worth a quick mention is the CHDiags class method:
void Align();
The method is called if diagrams are bound to the left or right side of the terminal window. In this case, the method is called in the OnChartEvent handler of the CHARTEVENT_CHART_CHANGE event returning diagrams to their previous places.
Other methods of the CHDiags diagram manager class are auxiliary and available in the attached file.
Class for drawing and managing diagram's graphical primitives
Let's call this class "CHDiagDraw" and derive it from CObject. In the class constructor, we obtain the pointer to the manager (save it in the m_pProp field). The unique diagram name is defined here as well.
Next, we should implement the Type() method:
int CHDiagDraw::Type() const
  {
   switch (m_pProp.GetHDStyle() ) {
      case HD_RECTANGLE:
         return (OBJ_RECTANGLE);
      case HD_LINE:
         return (OBJ_TREND);
   }
   return (0);
  }
The displayed diagram type matches the types of applied graphical primitives, which is quite logical.
The main calculations in the CHDiagDraw class are executed by the method called by the manager's SetData method:
int SetData(const HDDATA& hddata);
The method's objective is to define the diagram sizes and create the necessary number of primitives in a certain point of the chart. To achieve this, a link to the structure instance is passed in the call point:
struct HDDATA
 {
   double   pcur[];
   double   prmax;
   double   prmin;
   int      prsize;
   double   vcur[];
   datetime dtLastTime;
   bool     bRemovePrev;
 };
Let's describe the structure fields in more details:
- pcur[] — array of the diagram price levels. For the created graphical primitives, this is the array of price bindings.
- prmax — maximum horizontal value the diagram can have. In this case, this is the maximum value of a tick volume traded at a certain level.
- prmin — reserved parameter.
- prsize — number of diagram levels. In other words, this is the number of primitives the diagram will consist of.
- vcur[] — array of values that defines the "horizontal size" of the diagram's bars. In this case, the array contains tick volumes traded at the appropriate levels of the pcur[] array. The size of the pcur and vcur arrays should match and be equal to prsize.
- dtLastTime — diagram location. For graphical primitives, this is a time binding. This field has a higher priority than the argument of the AddHDiag method of the manager.
- bRemovePrev — if 'true', the diagram is completely redrawn, while the previous graphical primitives are deleted. If set to 'false', the diagram stops managing previous graphical primitives and draws a new diagram without deleting them as if "forgetting" about them.
The SetData method code is provided below in full due to its importance:
int CHDiagDraw::SetData(const HDDATA &hddata)
  {
   RemoveContext(hddata.bRemovePrev);
   if(hddata.prmax == 0.0 || hddata.prsize == 0) return (0);
   double dZoom=NormalizeDouble(hddata.prmax/m_pProp.GetHDHorSize(),Digits());
   if(dZoom==0.0) dZoom=1;
   ArrayResize(m_hItem,hddata.prsize);
   m_hItemCount=hddata.prsize;
   int iTo,t;
   datetime dtTo;

   string n;
   double dl=hddata.pcur[0],dh=0;


   GetBorders(hddata);
   for(int i=0; i<hddata.prsize; i++)
     {
      if (hddata.vcur[i] == 0) continue;
      t=(int)MathCeil(hddata.vcur[i]/dZoom);
      switch(m_pProp.GetHDPosition())
        {
         case HD_LEFT:
         case HD_RIGHT:
            iTo=m_iFrom+m_pProp.GetHDPosition()*t;
            dtTo=m_pProp.GetBarTime(iTo);
            break;
         case HD_CNDLE:
            iTo   = m_iFrom + m_pProp.GetHDDirect() * t;
            dtTo  = m_pProp.GetBarTime(iTo);
            break;
         default:
            return (-1);
        }//switch (m_pProp.m_position)
      n=CHDiags::GetUnicObjNameByPart(m_pProp.GetChartID(),m_hname,m_iNameBase);
      m_iNameBase++;
      bool b=false;
      switch(m_pProp.GetHDStyle())
        {
         case HD_LINE:
            b=CHDiags::ObjectCreateRay(m_pProp.GetChartID(),n,dtTo,hddata.pcur[i],m_dtFrom,hddata.pcur[i]);
            break;
         case HD_RECTANGLE:
            if(dl!=hddata.pcur[i]) dl=dh;
            dh=(i == hddata.prsize-1) ? hddata.pcur[i] :(hddata.pcur[i]+hddata.pcur[i+1])/2;
            b = ObjectCreate(m_pProp.GetChartID(),n,OBJ_RECTANGLE,0,dtTo,dl,m_dtFrom,dh);
            break;
        }//switch(m_pProp.m_style)
      if(!b)
        {
         Print("ERROR while creating graphic item: ",n);
         return (-1);
           } else {
         m_hItem[i]=n;
         ObjectSetInteger(m_pProp.GetChartID(), n, OBJPROP_COLOR, m_pProp.GetHDColor() );
         ObjectSetInteger(m_pProp.GetChartID(), n, OBJPROP_WIDTH, m_pProp.GeHDWidth() );
         ObjectSetInteger(m_pProp.GetChartID(), n, OBJPROP_SELECTABLE, false);
         ObjectSetInteger(m_pProp.GetChartID(), n, OBJPROP_BACK, true);
        }//if (!ObjectCreateRay(n, dtTo, hddata.pcur[i], m_dtFrom, hddata.pcur[i]) )
     }// for (int i = 0; i < l; i++)
   return (hddata.prsize);
  }//int CHDiagDraw::SetData(const HDDATA& hddata)
The first thing the method does is clean up and calculate the scale. It also features the maximum length of the diagram's "horizontal bars" and the maximum horizontal size of the diagram in candles. We can get the proportionality ratio. It is easy to notice, that rounding is enforced as a result since the diagram size "in candles" is an integer.
The array for storing the names of the primitives is prepared next. Additional diagram binding parameters are calculated — candle index and temporary binding in the GetBorders method. The second time binding of the diagram is defined in the loop after that. Thus, all the bindings for creating a graphical primitive are available. We obtain unique names of the primitives and create them sequentially using the received parameters. Names of the primitives are saved in the array and their properties are corrected. The diagram is created. The method returns the number of diagram levels.
Perhaps, the method looks too long. It would be possible to move the code for creating and rendering the primitives into a separate protected method. However, both parts of the method look organically compatible, the second part is a clear continuation of the first one. This consideration, as well as reluctance to create multiple additional calls of the new method with a large number of arguments, led to the fact that the SetData method has been developed in its current form.
Other functions of the CHDiagDraw class are auxiliary and used to integrate with the manager.
Users do not call any method of the CHDiagDraw class directly. Instead, they act exclusively through the horizontal diagrams manager.
The entire code of the above mentioned horizontal diagrams manager class, diagram drawing class, structures and enumerations is available in the attached HDiagsE.mqh file.
Now we can get back to the EA code and see its contents in detail without using a pseudo-code.
Back to the indicator
Declare two objects and variables in the global context:
CHDiags    *pHd;
int         iCurr, iCurr0;
HDDATA      sdata;
These are the pointer to the diagrams manager, diagram indices and the structure for passing data to the diagram.
The manager and both diagrams are created immediately in OnInit() using the indicator inputs:
   pHd         = new CHDiags(HD_CNDLE, hdStyle, HD_LEFTRIGHT, hdHorSize, hdColor, hdWidth, 0, MaxHDcount);
   if(pHd      == NULL) return (INIT_FAILED);
   iCurr       = pHd.AddHDiag(TimeCurrent() );
   if(iCurr  == -1) return (INIT_FAILED);
   iCurr0       = pHd.AddHDiag(TimeCurrent() );
   if(iCurr0  == -1) return (INIT_FAILED);
Below is part of the OnCalculate handler, for which we had to use the pseudo-code recently:
        {
         int br=1;
         while(br<MaxHDcount)
           {
            if(PrepareForBar(br++,sdata))
              {
               sdata.bRemovePrev = false;
               if(iCurr!=-1)
                 {
                  Print(br-1," diag level: ",pHd.SetData(sdata,iCurr));
                 }
              }
           }
         ChartRedraw();
         bCreateHis=true;
        }
Now we only have to consider the function filling the HDDATA type structure with data for a selected bar from the timeframe the distribution (TargetPeriod) is built for:
bool PrepareForBar(int bar, HDDATA& hdta) {

   hdta.prmax  = hdta.prmin  = hdta.prsize  = 0;
   int iSCount;
   datetime dtStart, dtEnd;
   dtEnd = (bar == 0)? TimeCurrent() : iTime(Symbol(), TargetPeriod, bar - 1);
   hdta.dtLastTime = dtStart = iTime(Symbol(), TargetPeriod, bar);

   hdta.prmax = iHigh(Symbol(), TargetPeriod, bar);
   if(hdta.prmax == 0) return (false);
   hdta.prmax      = (int)MathCeil(NormalizeDouble(hdta.prmax, hdDigit) / hdPoint );

   hdta.prmin = iLow(Symbol(), TargetPeriod, bar);
   if(hdta.prmin == 0) return (false);
   hdta.prmin      = (int)MathCeil(NormalizeDouble(hdta.prmin, hdDigit) / hdPoint );

   iSCount = CopyRates(Symbol(), SourcePeriod, dtStart, dtEnd, source);
   if (iSCount < 1) return (false);

   hdta.prsize = (int)hdta.prmax - (int)hdta.prmin + 10;

   ArrayResize(hdta.pcur,  hdta.prsize);
   ArrayResize(hdta.vcur,  hdta.prsize);
   ArrayInitialize(hdta.pcur, 0);
   ArrayInitialize(hdta.vcur, 0);

   double avTick;
   int i, delta;
   hdta.prmax = 0;

   for (i = 0; i < hdta.prsize; i++) hdta.pcur[i] = (hdta.prmin + i) * hdPoint;
   int rs = 0;
   for (i = 1; i < iSCount; i++) {
      if (source[i].tick_volume == 0.0) continue;
      if (!MqlRatesRound(source[i], (int)hdta.prmin) ) continue;
      delta = (int)(source[i].high - source[i].low);
      if (delta == 0) delta = 1;
      avTick = (double)(source[i].tick_volume / delta);
      int j;
      for (j = (int)source[i].low; j <= (int)(source[i].low) + delta; j++) {
         if (j >= hdta.prsize) {
            Print("Internal ERROR. Wait for next source period or switch timeframe");
            return false;
         }
         hdta.vcur[j] += avTick;
         if (hdta.vcur[j] > hdta.prmax) hdta.prmax = (int)hdta.vcur[j];
      }//for (int j = (int)source[i].low; j <= (int)(source[i].low) + delta; j++)
      if (j > rs) rs = j; //real size
   }//for (int i = 1; i < iSCount; i++)
   hdta.prsize = rs + 1;
   return (true);
}
At the very beginning, the method finds out the period it should perform calculation for. The boundaries of the working price range are calculated here as well considering further splitting into levels for drawing.
MqlRates from the timeframe taken as a source data for the newly specified period are read afterwards. For each obtained MqlRates structure, it is considered that tick_volume is evenly distributed within the range from low to high of the structure. Since the boundaries of the price range for the entire future diagram are already known, the tick volume distribution is positioned in the diagram. Thus, the array of tick volumes distribution within the sought-for period is formed.
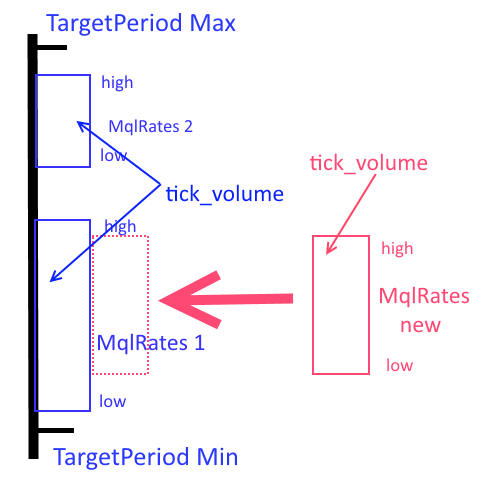
The calculations end with defining the real size of the tick volumes distribution array, and hence the number of graphical primitives in the future diagram.
Thus, the diagram's data structure fields are filled and ready for passing using the SetData(...) method.
In general, working with the described classes looks as follows:
- Connect HDiagsE.mqh.
- Create one manager object per each group of "same-type" diagrams.
- Create the diagrams by calling the AddHDiag manager method. The method returns their index in the array known to the manager.
- Clear the diagram of irrelevant data by calling the RemoveContext manager method. New data is passed to the diagram by calling the SetData manager method and passing the HDDATA type structure with data to it. The responsibility for correctly filling in the fields of this structure is borne by the calling side.
- If necessary, diagrams can be aligned to the left or right side of the terminal window by calling the Align manager method.
- All diagrams are destroyed in the CHDiags manager class destructor.
The full indicator code can be found in the attached VolChart.mq5 file. The library file HDiagsE.mqh is attached below as well.
Names
Almost all objects related to horizontal diagrams have names. They are formed hierarchically as follows:
- The manager features the m_BaseName private field defining the "base name". All the remaining names start from it.
- When creating a manager object, a unique ID is assigned to it. The calling code is responsible for the uniqueness of this parameter. The m_BaseName field and ID form the manager name.
- When creating a diagram objects, it also receives a unique name based on the manager one.
- Finally, the graphical primitives created in the diagram object get their unique names based on the name of the diagram object featuring the primitives.
This allows to easily sort out the necessary objects and manage them.
Yet another indicator
Let's redo the already developed indicator into the one displaying the distribution of tick volumes as a diagram aligned to the right side of the terminal window:
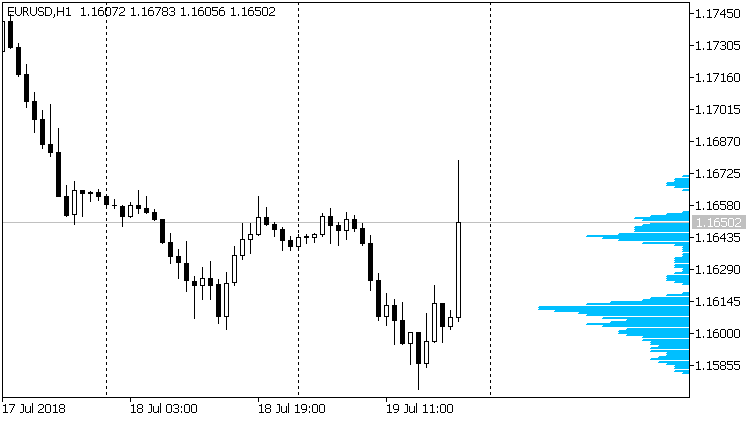
To do this, alter the code a bit:
- The initialization code should be slightly changed
   pHd         = new CHDiags(HD_RIGHT, hdStyle, HD_RIGHTLEFT, hdHorSize, hdColor, hdWidth, 0, MaxHDcount);
   if(pHd      == NULL) return (INIT_FAILED);
   iCurr       = pHd.AddHDiag(TimeCurrent() );
   if(iCurr    == -1) return (INIT_FAILED);
- Remove all the code from the OnCalculate handler.
- Add the OnChartEvent handler
void OnChartEvent(const int id,
                  const long &lparam,
                  const double &dparam,
                  const string &sparam)
  {
      switch (id) {
         case CHARTEVENT_CHART_CHANGE:
            pHd.Align();
            break;
        default:
            break;
      }//switch (id)
  }
Conclusion
Now we can create horizontal diagrams by enabling a single file. The task of the developer will include the preparation of data for construction, which is mainly outside of the current article's topic. The library file code suggests possible improvements thanks to the reserved methods. Other graphical primitives may be added for drawing.
Do not forget that the attached indicators are intended for demonstration and training only. Do not apply them in real trading. In particular, keep in mind that there should be no artifacts on the timeframe used as a data source.
Programs and files used in the article
| # | Name |
Type |
Description |
|---|---|---|---|
| 1 | VolChart.mq5 | Indicator |
Tick volumes distribution indicator. |
| 2 |
HDiagsE.mqh | Library file |
Library file with the horizontal diagrams manager and the horizontal diagram. |
| 3 |
VolChart1.mq5 |
Indicator |
Tick volumes distribution indicator aligned to the right side of the terminal window. |