Testing currency pair patterns: Practical application and real trading perspectives. Part IV
Andrei Novichkov | 29 August, 2018
Introduction
This article concludes studying the testing patterns that arise when trading currency pair baskets that we started here. All we have to do now is consider the remaining pattern — the graph crossing the moving averaging.
Previously, we have already analyzed this pattern but with reference to certain conditions:
- The trader receives an entry signal at the candle closing, when the unified indicator graph for one of the currency pair baskets is crossed by its own moving average. There are two such signals — the moving average crosses the graph downwards (sell) and upwards (buy).
We found out that the positive property of this pattern is a large number of signals. The drawback is the need for additional filtration.
Now, I propose to test this pattern on the graph of the difference between the values of the unified indicator for the two baskets: the base currency and the quoted currency (see the details here). Using two baskets of currency pairs instead of one can serve as a factor for additional filtering.
In addition, in the second half of the article, we will dwell on applying all the acquired knowledge in real trading.
Research pattern
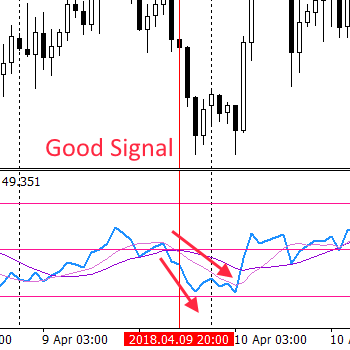
Let's repeat the basic requirement for the pattern: the breakthrough of the unified indicator by the moving average should be clear and noticeable.
| "Good" pattern (signal) we are looking for |
No pattern, "bad" signal |
|
|
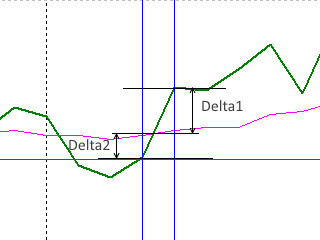
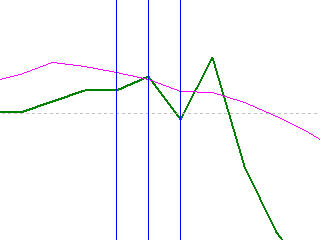
The green line is a unified indicator graph, while the pink one is its moving average.
To accurately identify the pattern, it is necessary that the distance between the unified indicator graph and the moving average before and after the breakthrough is not less than the one (Delta1 and Delta2) specified on the left image. It is obvious that this condition is not met on the right image, in the interval bounded by the blue vertical lines. Thus, there is no pattern there.
In further studies, we will check how to use the patterns similar to the ones on the left image, as entry signals. Arrival of the same but oppositely directed pattern may serve as a market exit signal. However, such tactic implies a permanent presence in the market, and this is unlikely to bring a positive result. Therefore, it is possible to suggest the detection of "bad" patterns as an exit signal. This implies that orders will be closed without opening new ones.
Research tools
We already have all the tools. We developed them earlier, in the past articles. Although the code has not changed much, let's show it here. testEAbasket3.mq5 EA is used as the main one:
//+------------------------------------------------------------------+
//|                                                 testEAbasket.mq5 |
//|                        Copyright 2017, MetaQuotes Software Corp. |
//|                                             https://www.mql5.com |
//+------------------------------------------------------------------+
#property copyright "Copyright 2017, MetaQuotes Software Corp."
#property link      "https://www.mql5.com"
#property version   "1.00"

#include <Trade\\Trade.mqh>


//+------------------------------------------------------------------+
//|                                                                  |
//+------------------------------------------------------------------+
enum BSTATE
  {
   BCLOSE = 0,
   BBUY   = 1,
   BSELL  = 2
  };
//+------------------------------------------------------------------+
//| Expert initialization function                                   |
//+------------------------------------------------------------------+
input int wpr = 20;
input int ma  = 10;
input double lt=0.01;

int h;
ulong  Ticket;

double m[1],ml;
double w[1],wl;

BSTATE g_state;

double g_dMinSize = 2.0;
double g_dMaxSize = 50.0;
//+------------------------------------------------------------------+
//|                                                                  |
//+------------------------------------------------------------------+
int OnInit()
  {
   h=iCustom(NULL,0,"testWPR&MA3",wpr,ma);
   if(h==INVALID_HANDLE)
     {
      Print("Error while creating testWPR&MA3");
      return (INIT_FAILED);
     }

   g_state=BCLOSE;
   EventSetTimer(1);
//---
   return(INIT_SUCCEEDED);
  }
//+------------------------------------------------------------------+
//| Expert deinitialization function                                 |
//+------------------------------------------------------------------+
void OnDeinit(const int reason)
  {
   IndicatorRelease(h);
   EventKillTimer();

  }
//+------------------------------------------------------------------+
//| Expert tick function                                             |
//+------------------------------------------------------------------+
void OnTick()
  {

  }
//+------------------------------------------------------------------+
//| Timer function                                                   |
//+------------------------------------------------------------------+
void OnTimer()
  {
   if(IsNewCandle())
     {
      wl=w[0];
      CopyBuffer(h,0,1,1,w);
      ml=m[0];
      CopyBuffer(h,1,1,1,m);
      double d1 = MathAbs(w[0] - m[0]);
      double d2 = MathAbs(ml - wl);
      if(w[0]>m[0] && wl<ml)
        {
         if(g_state!=BCLOSE) CloseAllPos();
         if(d1 >= g_dMinSize && d2 >= g_dMinSize &&
            d1 <= g_dMaxSize && d2 <= g_dMaxSize)
           {
            EnterBuy(lt);
            g_state=BBUY;
           }
        }
      if(w[0]<m[0] && wl>ml)
        {
         if(g_state!=BCLOSE) CloseAllPos();
         if(d1 >= g_dMinSize && d2 >= g_dMinSize &&
            d1 <= g_dMaxSize && d2 <= g_dMaxSize)
           {
            EnterSell(lt);
            g_state=BSELL;
           }
        }
     }
  }
//+------------------------------------------------------------------+

void CloseAllPos()
  {

   CTrade Trade;
   Trade.LogLevel(LOG_LEVEL_NO);
   Trade.PositionClose(Ticket);
   g_state=BCLOSE;

  }
//+------------------------------------------------------------------+
//|                                                                  |
//+------------------------------------------------------------------+
void EnterBuy(double lot)
  {

   CTrade Trade;
   Trade.LogLevel(LOG_LEVEL_NO);
   Trade.Buy(lot,_Symbol);
   Ticket=Trade.ResultDeal();
   g_state=BBUY;
  }
//+------------------------------------------------------------------+
//|                                                                  |
//+------------------------------------------------------------------+
void EnterSell(double lot)
  {

   CTrade Trade;
   Trade.LogLevel(LOG_LEVEL_NO);
   Trade.Sell(lot,_Symbol);
   Ticket=Trade.ResultDeal();
   g_state=BSELL;
  }
//+------------------------------------------------------------------+
//|                                                                  |
//+------------------------------------------------------------------+
bool IsNewCandle()
  {
   static int candle=-1;
          int t1=0;
   switch(_Period)
     {
      case PERIOD_H1:  t1 = Hour();   break;
      case PERIOD_H4:  t1 = Hour4();  break;
      case PERIOD_D1:  t1 = Day();    break;
     }

   if(t1!=candle) {candle=t1; return(true);}
   return (false);
  }

  int Hour4(){return((int)Hour()/4);}

int Day()
  {
   MqlDateTime tm;
   TimeCurrent(tm);
   return(tm.day);
  }

int Hour()
  {
   MqlDateTime tm;
   TimeCurrent(tm);
   return(tm.hour);
  }
This is a version of testEAbasket.mq5 EA from this article revised for entries on a single currency pair rather than the entire basket. The EA applies data of the testWPR&MA3.mq5 custom indicator, which is the version of the testWPR&MA.mq5 indicator from the same article:
//+------------------------------------------------------------------+
//|                                                      testWPR.mq5 |
//|                                        MetaQuotes Software Corp. |
//|                                               http://fxstill.com |
//+------------------------------------------------------------------+
#property copyright "Copyright 2016, MetaQuotes Software Corp."
#property link      "http://www.mql5.com"
#property version   "1.00"
#property indicator_separate_window
#property indicator_minimum -100
#property indicator_maximum 100


#property indicator_buffers 2
#property indicator_plots   2

input int WPR       = 20; //Period WPR
input int maperiod  = 10; //Period MA
input color   clr   = clrGreen;
input color   clrMA = clrMagenta;


int h,h1;
double ind[],ma[];

//+------------------------------------------------------------------+
//| Custom indicator initialization function                         |
//+------------------------------------------------------------------+
int OnInit()
  {
//--- indicator buffers mapping
      h = iCustom(NULL,0,"testWPReur",WPR);
      if (h == INVALID_HANDLE) {
         Print("Error while creating testWPR");
         return (INIT_FAILED);
      }
      h1 = iCustom(NULL,0,"testWPRusd",WPR);
      if (h1 == INVALID_HANDLE) {
         Print("Error while creating testWPR");
         return (INIT_FAILED);
      }


   IndicatorSetString(INDICATOR_SHORTNAME,"testWPRusd");
   IndicatorSetInteger(INDICATOR_DIGITS,2);
   IndicatorSetInteger(INDICATOR_LEVELS,2);
   IndicatorSetInteger(INDICATOR_LEVELSTYLE,0,STYLE_SOLID);
   IndicatorSetInteger(INDICATOR_LEVELSTYLE,1,STYLE_SOLID);
   IndicatorSetInteger(INDICATOR_LEVELCOLOR,0,clrRed);
   IndicatorSetInteger(INDICATOR_LEVELCOLOR,1,clrRed);
   IndicatorSetInteger(INDICATOR_LEVELWIDTH,0,1);
   IndicatorSetInteger(INDICATOR_LEVELWIDTH,1,1);
   IndicatorSetDouble(INDICATOR_LEVELVALUE,0,-60);
   IndicatorSetDouble(INDICATOR_LEVELVALUE,1,60);

   ArraySetAsSeries(ind,true);
   SetIndexBuffer(0,ind);
   PlotIndexSetInteger(0,PLOT_DRAW_TYPE,DRAW_LINE);
   PlotIndexSetInteger(0,PLOT_LINE_STYLE,STYLE_SOLID);
   PlotIndexSetInteger(0,PLOT_LINE_WIDTH,2);
   PlotIndexSetInteger(0,PLOT_LINE_COLOR,clr);
   PlotIndexSetString(0,PLOT_LABEL,"_tstWPRusd_");

   ArraySetAsSeries(ma,true);
   SetIndexBuffer(1,ma);
   PlotIndexSetInteger(1,PLOT_DRAW_TYPE,DRAW_LINE);
   PlotIndexSetInteger(1,PLOT_LINE_STYLE,STYLE_SOLID);
   PlotIndexSetInteger(1,PLOT_LINE_WIDTH,1);
   PlotIndexSetInteger(1,PLOT_LINE_COLOR,clrMA);
   PlotIndexSetString(1,PLOT_LABEL,"Middle_Basket_line_MA");


//---
   return(INIT_SUCCEEDED);
  }
//+------------------------------------------------------------------+
//|                                                                  |
//+------------------------------------------------------------------+
double GetValue(int shift)
  {
   double dBuf[1], dBuf1[1];
   double res=0.0;
   CopyBuffer(h,0,shift,1,dBuf);
   CopyBuffer(h1,0,shift,1,dBuf1);
   return (NormalizeDouble((dBuf[0] - dBuf1[0])/2, _Digits) );
  }
//+------------------------------------------------------------------+
//| Custom indicator iteration function                              |
//+------------------------------------------------------------------+
int OnCalculate(const int rates_total,
                const int prev_calculated,
                const datetime &time[],
                const double &open[],
                const double &high[],
                const double &low[],
                const double &close[],
                const long &tick_volume[],
                const long &volume[],
                const int &spread[])
  {
//---
   if(prev_calculated==0 || rates_total>prev_calculated+1)
     {
      int rt=rates_total-WPR;
      for(int i=1; i<rt; i++)
        {
         ind[i]=GetValue(i);
        }
      rt-=maperiod;
      for(int i=1; i<rt; i++)
        {
         ma[i]=GetMA(ind,i,maperiod,_Digits);
        }
     }
   else
     {
         ind[0] = GetValue(0);
         ma[0]  = GetMA(ind, 0, maperiod, _Digits);
     }
//--- return value of prev_calculated for next call
   return(rates_total);
  }
//+------------------------------------------------------------------+

void OnDeinit(const int reason)
  {
      if(h!=INVALID_HANDLE) IndicatorRelease(h);
      if(h1!=INVALID_HANDLE) IndicatorRelease(h1);
  }
//+------------------------------------------------------------------+

double GetMA(const double &arr[],int index,int period,int digit)
  {
   double m=0;
   for(int j=0; j<period; j++) m+=arr[index+j];
   m/=period;
   return (NormalizeDouble(m,digit));
  }
//+------------------------------------------------------------------+
The indicator has undergone slight changes to match the pattern identification conditions described above. All used tools can be found in the attached test.zip archive.
Previously, similar studies began with the definition of the potential number of market entries. This is not the case here, since our experience of testing such patterns suggests that the number of transactions will be quite sufficient.
Before testing, let's specify the pattern form. We have already devoted enough time to specific values of Delta1 and Delta2 parameters. These values have been found and strict filtration of market entry signals has been implemented. Here we will somewhat relax the restrictions. This will increase the number of entries without compromising the principle underlying the pattern: Delta1 and Delta2 should be at least 2% and not more than 50%.
Let's choose one of the two testing strategies.
- Constant presence in the market. Traders enter the market by a signal and wait for an entry signal in the opposite direction. Then they close open orders, enter in the opposite direction, etc. We will not adhere to this strategy, since it showed its inefficiency.
- Exiting the market without opening new orders. Traders enter the market by a signal and wait for an exit signal in the form of a "bad" pattern. It does not provide entry signals but it may warn of a possible trend slowing or its reversal. We will use this strategy for testing.
Now, let's define the timeframe. In the previous articles, we tested the pattern on H1, H4 and D1. D1 showed few deals, therefore we will omit it. We will only leave H1 and H4 and start testing from EURUSD.
Testing the pattern
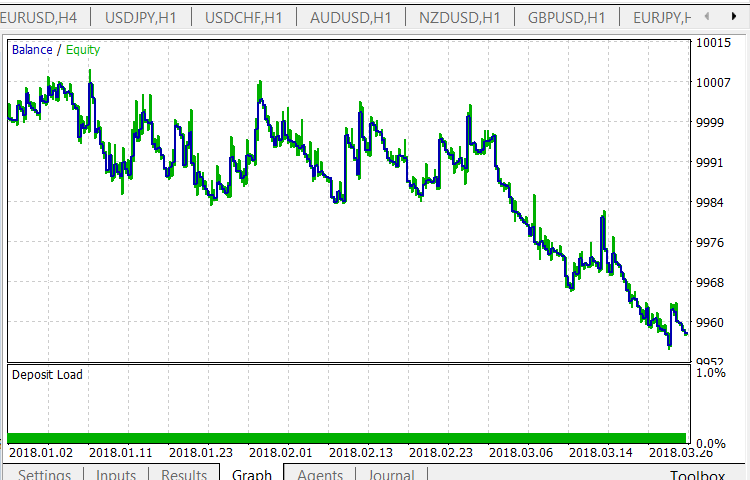
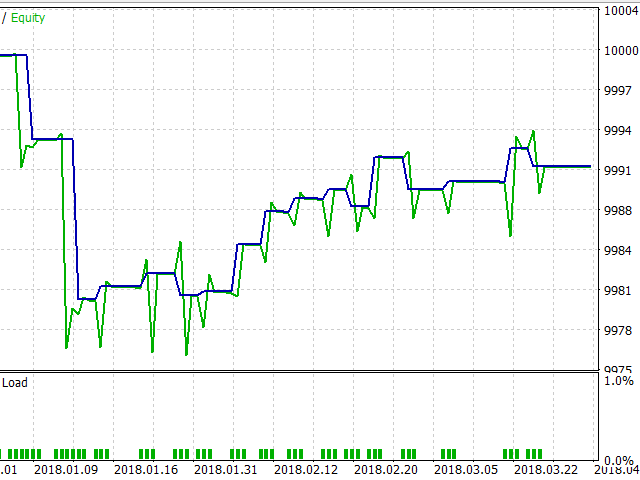
After testing on H1 quotes for the last year, receive the following results:
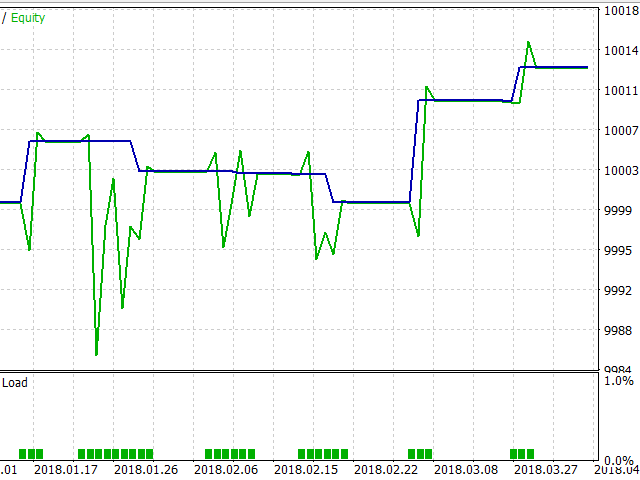
On H4 timeframe:
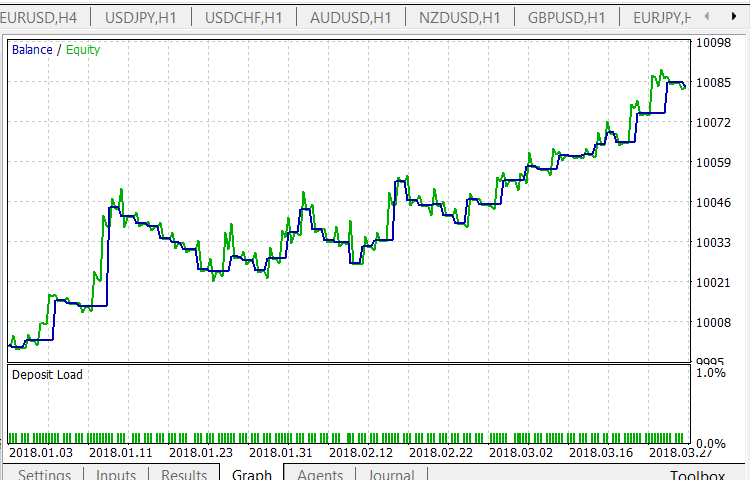
Like in the previous tests, we see the loss on H1 and profit on H4.
Let's test the pattern on the main currency pairs: EURUSD, GBPUSD, AUDUSD, NZDUSD, USDCAD, USDCHF and USDJPY.
The test has not yielded any surprises. The results are similar to the already received data: encouraging on H4 and loss-making on H1. Test reports can be found in the attached testhtml.zip archive.
We already have an experience of increasing profitability by introducing additional sorting of input signals. Use the second filter that was applied in this article:
- Traders do NOT buy if the combined WPR graph touches or breaks through the overbought border upwards.
- Traders do NOT sell if the combined WPR graph touches or breaks through the oversold border downwards.
The corrected EA code is located in the attached test1.zip archive. There is no point in displaying the entire code here, since it is almost identical to the previously displayed one. I will show only the function that directly identifies the pattern:
//+------------------------------------------------------------------+
//| Timer function                                                   |
//+------------------------------------------------------------------+
void OnTimer()
  {
   if(IsNewCandle())
     {
      wl=w[0];
      CopyBuffer(h,0,1,1,w);
      ml=m[0];
      CopyBuffer(h,1,1,1,m);
      double d1 = MathAbs(w[0] - m[0]);
      double d2 = MathAbs(ml - wl);
      if(w[0]>m[0] && wl<ml)
        {
         if(g_state!=BCLOSE) CloseAllPos();
         if(d1 >= g_dMinSize && d2 >= g_dMinSize &&
            d1 <= g_dMaxSize && d2 <= g_dMaxSize && w[0] < 60)
           {
            EnterBuy(lt);
            g_state=BBUY;
           }
        }
      if(w[0]<m[0] && wl>ml)
        {
         if(g_state!=BCLOSE) CloseAllPos();
         if(d1 >= g_dMinSize && d2 >= g_dMinSize &&
            d1 <= g_dMaxSize && d2 <= g_dMaxSize && w[0] > -60)
           {
            EnterSell(lt);
            g_state=BSELL;
           }
        }
     }
  }
//+------------------------------------------------------------------+
Where should we set overbought and oversold levels? In previous articles, we showed that the standard values of the combined indicator based on WPR (+60 for the overbought level and -60 for the oversold level) can be slightly lowered for the tested conditions. In addition to the standard values option, let's test the values of + 50% and -50% for overbought and oversold levels, respectively. Test reports for EURUSD on H1 and H4 are in the testhtml50.zip and testhtml60.zip archives.
As we can see, they do not differ from the first two tests described above. This is consistent with the results of the previous article dedicated to testing this pattern. Back then, such a filtration did not yield any significant results as well. Therefore, we will not test this pattern on the remaining pairs and proceed to the final part — using it as a filter.
Let's briefly recall the case.
- The combined WPR graph breaks through the oversold level upwards. The breakthrough remains at the candle closure. A trader buys only if the moving average is "below" the combined indicator graph.
- For selling, the situation should be opposite.
- The trader exits the market when the combined WPR graph reaches 0%.
testEAbasket5.mq5 EA is used for testing:
//+------------------------------------------------------------------+
//|                                                 testEAbasket.mq5 |
//|                        Copyright 2017, MetaQuotes Software Corp. |
//|                                             https://www.mql5.com |
//+------------------------------------------------------------------+
#property copyright "Copyright 2017, MetaQuotes Software Corp."
#property link      "https://www.mql5.com"
#property version   "1.00"

#include <Trade\\Trade.mqh>


enum BSTATE
  {
   BCLOSE = 0,
   BBUY   = 1,
   BSELL  = 2
  };
//+------------------------------------------------------------------+
//| Expert initialization function                                   |
//+------------------------------------------------------------------+
input int wpr = 20;
input int ma  = 10;
input double lt=0.01; //lot

int SELLPROFIT =   0;
int SELL1LIMIT =  50;
int SELL2FROM  =  40;
int SELL2TO    =  20;
int BUYPROFIT  =   0;
int BUY1LIMIT  = -50;
int BUY2FROM   = -40;
int BUY2TO     = -20;


int h;
ulong  Ticket;

double m[1],ml;
double w[1],wl;

BSTATE g_state;

double g_dMinSize = 2.0;
double g_dMaxSize = 50.0;
//+------------------------------------------------------------------+
//|                                                                  |
//+------------------------------------------------------------------+
int OnInit()
  {
   h=iCustom(NULL,0,"testWPR&MA3",wpr,ma);
   if(h==INVALID_HANDLE)
     {
      Print("Error while creating testWPR&MA3");
      return (INIT_FAILED);
     }

   g_state=BCLOSE;
   EventSetTimer(1);
//---
   return(INIT_SUCCEEDED);
  }
//+------------------------------------------------------------------+
//| Expert deinitialization function                                 |
//+------------------------------------------------------------------+
void OnDeinit(const int reason)
  {
   IndicatorRelease(h);
   EventKillTimer();

  }
//+------------------------------------------------------------------+
//| Expert tick function                                             |
//+------------------------------------------------------------------+
void OnTick()
  {

  }
//+------------------------------------------------------------------+
//| Timer function                                                   |
//+------------------------------------------------------------------+
void OnTimer()
  {
   if(IsNewCandle())
     {
      wl=w[0];
      CopyBuffer(h,0,1,1,w);
      ml=m[0];
      CopyBuffer(h,1,1,1,m);


      if(g_state==BBUY && (w[0]>=BUYPROFIT))
        {
         CloseAllPos();
        }
      if(g_state==BSELL && (w[0]<=SELLPROFIT))
        {
         CloseAllPos();
        }
      if(g_state==BCLOSE && w[0]>=BUY2FROM && w[0]<=BUY2TO && wl<=BUY1LIMIT && w[0] > m[0])
        {
            EnterBuy(lt);
            return;
        }


      if(g_state==BCLOSE && w[0]<=SELL2FROM && w[0]>=SELL2TO && wl>=SELL1LIMIT && w[0] < m[0])
        {
            EnterSell(lt);
            return;
        }
     }
  }
//+------------------------------------------------------------------+

void CloseAllPos()
  {

   CTrade Trade;
   Trade.LogLevel(LOG_LEVEL_NO);
   Trade.PositionClose(Ticket);
   g_state=BCLOSE;

  }
//+------------------------------------------------------------------+
//|                                                                  |
//+------------------------------------------------------------------+
void EnterBuy(double lot)
  {

   CTrade Trade;
   Trade.LogLevel(LOG_LEVEL_NO);
   Trade.Buy(lot,_Symbol);
   Ticket=Trade.ResultDeal();
   g_state=BBUY;
  }
//+------------------------------------------------------------------+
//|                                                                  |
//+------------------------------------------------------------------+
void EnterSell(double lot)
  {

   CTrade Trade;
   Trade.LogLevel(LOG_LEVEL_NO);
   Trade.Sell(lot,_Symbol);
   Ticket=Trade.ResultDeal();
   g_state=BSELL;
  }
//+------------------------------------------------------------------+
//|                                                                  |
//+------------------------------------------------------------------+
bool IsNewCandle()
  {
   static int candle=-1;
          int t1=0;
   switch(_Period)
     {
      case PERIOD_H1:  t1 = Hour();   break;
      case PERIOD_H4:  t1 = Hour4();  break;
      case PERIOD_D1:  t1 = Day();    break;
     }

   if(t1!=candle) {candle=t1; return(true);}
   return (false);
  }

  int Hour4(){return((int)Hour()/4);}

int Day()
  {
   MqlDateTime tm;
   TimeCurrent(tm);
   return(tm.day);
  }

int Hour()
  {
   MqlDateTime tm;
   TimeCurrent(tm);
   return(tm.hour);
  }
As usual, we start the test from EURUSD H1 and H4.
H1 timeframe results:
H4 timeframe results:
As we can see, the number of trades is small. We already discussed this phenomenon and even suggested its causes. The number of trades may be even smaller on the remaining pairs. Therefore, let's finish the test and proceed to the conclusions.
Results
- We have considered the method of using currency pair baskets in trading. Basic principles and concepts, as well as types of basic calculations have been provided.
- Several simple patterns that arise when trading currency pair baskets have been described.
- More complex constructions appearing when using baskets have been considered briefly — simultaneous use of standard technical indicators and indicators specially designed for working with currency pairs; simultaneous use of oscillators and trend-following indicators.
- Efficiency of detected patterns have been checked.
We have obtained a tool allowing us to look at the market in a new, reasonable and logical way. However, testing the patterns have not shown convincing results. Although, it has been impossible to expect something else. After all, trading axioms claim that several signals are needed to make an entry decision, while we made a decision based on a single pattern.
Experience says that trading the simplest patterns (for example, when the chart crosses the moving average) is very risky. However, we used the simple patterns and obtained promising results in some cases. Besides, keep in mind that our goal was not a profitable EA. Instead, we wanted to obtain a feasible signal that can be combined with other signals and used to make a trading decision.
Let's assess perspectives and possible options of applying the described method in everyday practice and automated trading.
Prospects and application in real trade
While working on this subject, one cannot do without test indicators and EAs. Examples of applying reliable tools are needed. The Market features some of them, while others are to be added there soon. In the article, I will give only examples of such programs without specifying their real names.
The subject of using basket patterns is very large. New trading methods appear every day making it impossible to fit them into one article. But it is possible to make additions to it in the form of separate posts, screenshots or templates. Some materials are already present in my blog. I will expand this information in the future.
Entry/exit in details
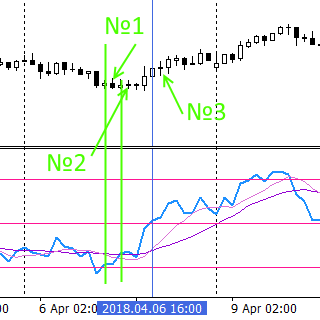
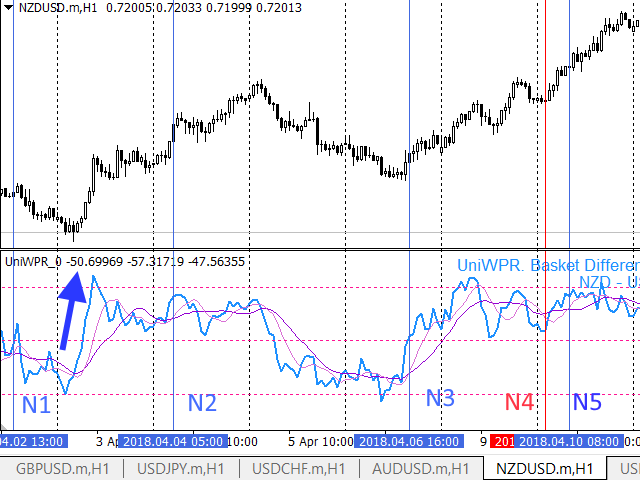
Let's consider the details of entering and exiting the market on NZDUSD H1. The unified indicator has detected a buy signal that turned out to be profitable (vertical blue line):
 |
 |
To the left, we can see the graph of the difference between the values of a unified indicator for the basic currency and quoted currency baskets. The "pseudo equation" of this indicator can be written as follows:
Indicator (NZDUSD) = Indicator (NZD) — Indicator (USD)
Let's assume that this type of display is applied to all unified indicators by default further in the article if not specified otherwise.
The possible entry options are as follows.
- The lower red horizontal line is the oversold level. We can see that the pattern of the indicator graph breaking this level is formed first. This place is marked by a vertical green line, while the pattern itself is identified when the candle 1 is opened. At this point, you can already open a buy order: the downtrend has exhausted its capabilities and starts reversing. A trader captures the very beginning of this movement and has the ability to capture the entire uptrend. We have tested this pattern. It is rather risky (since a downtrend may continue after the correction) and appears infrequently. Potential trader's losses are not too great in this case. A short stop loss can be used here.
- However, on the screenshot, we see that a new uptrend starts gaining momentum. A new pattern is formed — the indicator graph breaks through the moving average. This is a good signal filter after an oversold level has been broken. It reduces the risk a downtrend continues. The pattern is also marked with a green vertical line and can be identified at the opening of the candle 2. You can enter the market here as well. Generally, a stop loss should be greater (defined by the moving average parameters).
- After the uptrend has gained strength, a new pattern appears — the fast moving average breaks through the slow one. This pattern is identified at the opening of candle 3. In comparison to the previous two cases, the risk is minimal. However, a profit level is lower, while a stop loss is larger. Pay attention to how the distance between moving averages is increased after the pattern is detected. This indicates that the trend becomes stronger — a favorable signal for a trader. The decreasing distance indicates a slowdown and weakening (see the left screenshot).
Note that the first two described variants of entering using the patterns are typical for all kinds of oscillators and are well known. The third pattern is not so popular. It will also work in all oscillators, but here it is considered as an example of entering the market using an established, developed trend.
All three entry options are unified by a powerful initial signal — oversold level breakthrough. However, such a signal is quite rare. Let's analyze it briefly once again.
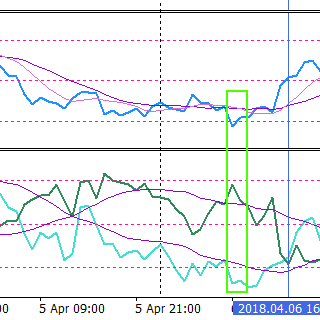
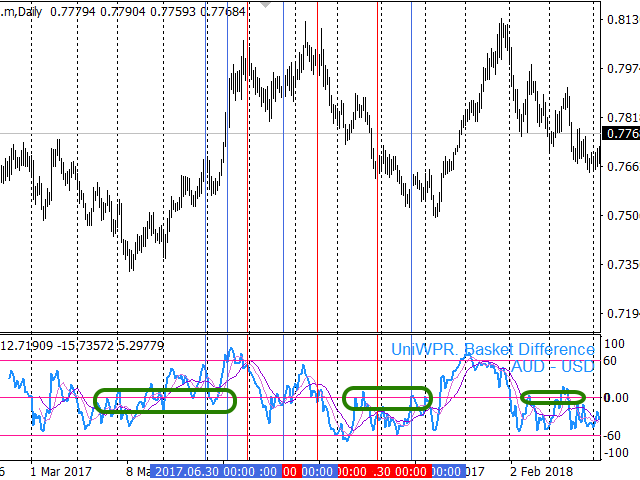
- On the right screenshot, we can see how the indicator graph enters the oversold (or overbought) area. The necessary place is marked by the green rectangle. In the indicator window, the same indicator is displayed in another way — separately for the NZD (light-blue line) and USD (dark-green line) baskets. We can seen that the USD basket became overbought at some point, while the NZD one was oversold for quite a long time. Simultaneous combination of such states of the baskets creates a picture, as in the left screenshot where the combined indicator graph for NZDUSD enters the overbought area with the subsequent breakthrough of the overbought level and trend reversal.
However, such favorable combinations of events occur rarely. Does this mean that we should wait for a signal for weeks? Not necessarily. It can be assumed that overbought/oversold levels are located on slightly lower levels. The value can be different for each pair and each timeframe. But it seems that in most cases, the levels of + 50% and -50% are sufficient. This undoubtedly increases the risk. Let's have a look at the right screenshot again. A new layout of the levels means that one of the two baskets (or even both!) has not yet exhausted its movement. So, it can continue, and a trader risks entering against a trend. Therefore, the pattern 3 is of particular importance, since it implies an entry by trend. However, there is a pitfall here as well in the form of a divergence:
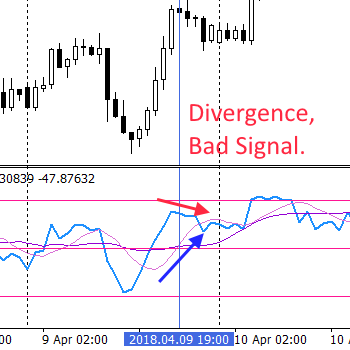 |
 |
On the right screenshot, we see how the upward fast MA breaks through the slow one, while the indicator itself moves upwards as well. On the left screenshot to the left, we observe a divergence: the indicator and MA graphs move in different directions. Of course, the signal with divergence should be skipped! My news line features other examples of various patterns with and without divergence.
Now, let's consider possible ways to exit the market (close the orders).
Suppose that a trader entered the market in one of the three described ways. An opposite signal can be used to close a position fully or partially or move it to a breakeven.
1. For example, the indicator enters the oversold area — this is a significant reason to close buy orders or move them to a breakeven (the opposite is true for sell orders).
2. A trader having open orders may detect the MA breakthrough by the indicator graph in the direction opposite to the previously opened orders.
3. A trader may detect that a trend is slowing down by a decreasing distance between the fast and slow moving averages.
4. Finally, reaching the values that are NOT overbought/oversold levels by the indicator may be used as a signal to close/move to a breakeven. For example, this may be level 0%. This level means the "equality" of both currency baskets. The indicator tends to "stumble" on such a level. Hence, this level is a resistance:
Fibo levels can also be used for that in unified indicators.
5. And the last thing: a trader can assign a stop loss and take profit based on their own considerations or a standard technical analysis.
We have considered ways of opening and closing orders. Now, let's search for patterns on the chart and analyze them.
Working with unified indicators
To identify detected patterns, place the unified indicator on the chart and look at the results. Here is a recent example for NZDUSD H1 (the chart is divided into two images due to size limitations):
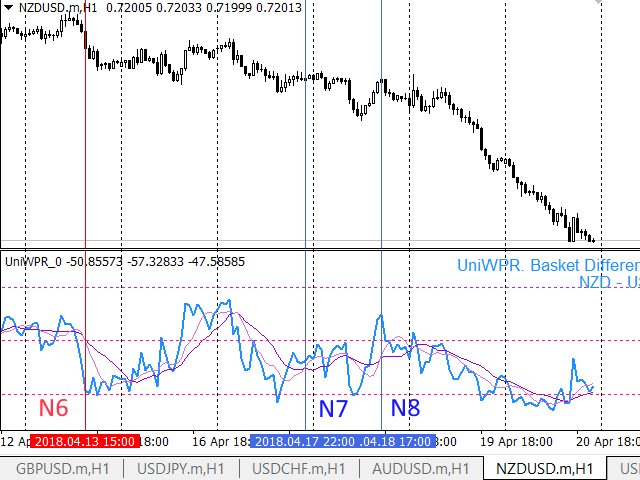
Note that patterns 3 and 7 are detected near the exit from overbought/oversold areas. There is no divergence here, while the price moves strongly upwards passing the zero level in the pattern 3. On the other hand, the movements in the pattern 7 area are relatively weak. The strong movement slows down and rolls back. The graph has not crossed the zero level yet and is capable of bouncing off from it (which is exactly what we see).
The pattern 8 shows a rebound from the oversold level. The graph touched it, reversed and went strongly upwards forming the pattern. The zero level is passed making it possible to go long. However, the indicator graph and the price reverse and move in the opposite direction. A bit later, a trader will be able to close the order with a minimum loss, otherwise, the loss may become quite palpable.
The pattern 6 is not very promising: the selling potential is almost exhausted and the oversold level is reached. The risk of a reversal is high. In practice, we see a prolonged flat movement, which is not profitable. The downward movement starts again, although much later: the pattern can be considered long-established there.
Under conditions similar to the pattern 6, the pattern 5 is very promising. Therefore, we should not unequivocally discard the patterns detected by the indicator near the overbought/oversold areas, since the trend can still continue at the time of their detection.
The pattern 4 also moves around the zero level without breaking it. There is no divergence, the indicator graph is moving horizontally.
The pattern 2 is promising. The downward movement slows down and reverses without reaching the zero level. There is no divergence, since the graph has not yet reached the oversold level. Although the indicator then moves flat, the pattern still brings a good profit.
We will not consider the pattern 1: we do not know what happened before it was formed.
In addition to the found patterns, it is worth paying attention to the areas similar to the one marked with a blue arrow. This is a powerful and steady movement from the oversold level with breaking through the zero level and exiting to the overbought area. The indicator did not find the pattern, although both MAs are broken. There are no divergences. Consider entering the market if the indicator breaks through the zero level, especially since this breakthrough coincides with the breakthrough of the fast MA by the slow one.
Please note that our method of analysis is not simple. It contains much ambiguity, since we could end up with a loss at least once. To increase the possibilities of analysis with the help of combined indicators, we should resort to the next stage — "advanced" analysis.
Advanced work with combined indicators
The first thing we should talk about is the use of two copies of one combined indicator on a single chart. Indirectly, this possibility has already been mentioned in the previous section. Now, we will consider it in more detail.
- The chart contains two instances of one combined indicator with similar settings but different display methods:
- The default is the V1 window.
- Two separate charts for the base and quoted currency baskets (V2 window).
- The default is the V1 window.
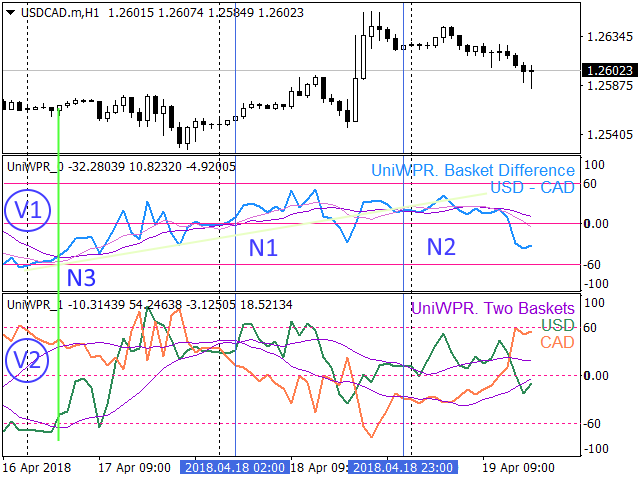
Indicators on USDCAD are displayed here. In the V2 window, the state of the USD basket of currency pairs is displayed as the dark-green line, while the CAD one is displayed as the orange line.
In the V1 window, the indicator detected two entry patterns (1 and 2). There is no divergence in both cases and the market entry may be profitable.
Let's have a look at the window V2, pattern 1. Here we can see that the CAD basket was overbought and is now weakening approaching the zero level. The USD basket was weakening as well, while exiting the overbought area. However, the weakening eventually stopped turning into a horizontal movement. At the moment of the pattern detection, the movement tended to go upward. Thus, the buy entry is justified.
Let's have a look at point 2. Here the situation is more risky, since both baskets pass the horizontal segment in the V2 window. Therefore, any of them can go in any direction causing a possible loss.
Besides, a trader can pay attention to point 3. There is no pattern there, but in the V2 window, we clearly see that both baskets go beyond overbought and oversold areas towards each other. This means that a trader may capture the beginning of a trend that has just reversed.
In this case, a trader looks for patterns on the indicator graph "by default", and then refines the picture using another way of displaying the data with the second instance of the same indicator.
The second interesting way of working with the combined indicators is to use them together with standard indicators. Here is an example of using a combined indicator based on WPR with the usual standard WPR:
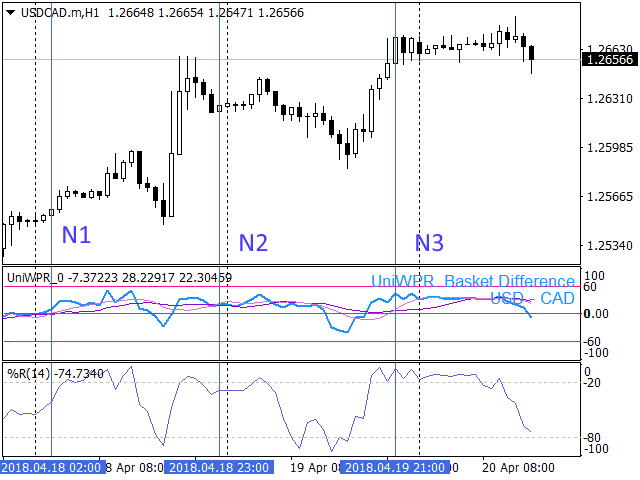
This is almost the same segment from the USDCAD chart. Previously, we have already found out that the pattern 1 is suitable for entering the market, while the pattern 2 carries greater risk. Now look at the pattern 3, which is also unsuccessful. There is no divergence on it, but it does not bring profit either. In the standard WPR window, it becomes clear why this happens: WPR is in the overbought area. As a result, the pair goes flat, which may be followed by either correction or even a trend reversal. The pattern 2 demonstrates flat movement with subsequent correction here as well. The pattern 1 is still goes strong. In case of a trend-following entry, the WPR indicator still has enough range till the overbought area, while the zero line has already been passed. This implies the pattern's potential profitability, which is subsequently confirmed.
Now we will provide an example of a less impressive "cooperation". We will use the same USDCAD pair. The segment and the timeframe are the same as well. The window contains combined STOCH and standard WPR. The vertical lines indicating the previously detected patterns are left for reference:
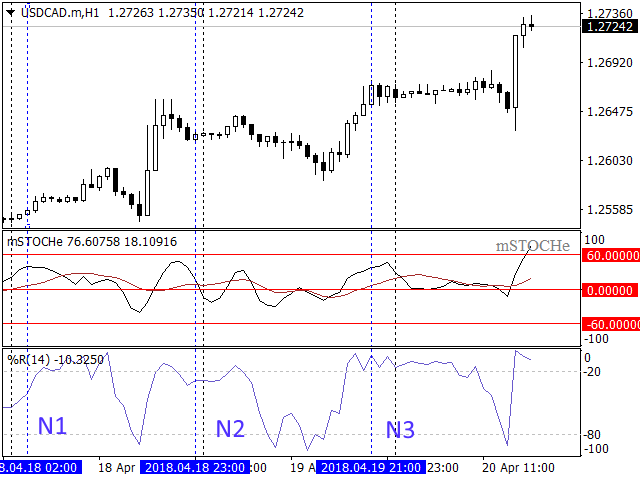
Directly combined STOCH did not yield any significant patterns. Like combined WPR, it assumes that the patterns 1 and 3 are suitable for entry. The pattern 2 demonstrates divergence, which means we cannot use it for entering the market. Please note that the areas considered to be overbought zones by WPR are regarded mostly as flat areas by the combined STOCH. This is yet another example of combining the indicators.
The methods of working with combined indicators described above are not the only possible ones, but they are quite recognizable, obvious and efficient.
Conclusion
In our article series, we considered working with the patterns that arise when trading currency baskets. We described the method of entering and exiting the market, as well as important principles of applying it.
Most examples have been implemented using the combined WPR. However, there are other combined indicators, like STOCH, RSI, TDI, etc. Together they constitute the indicator strategy for trading currency baskets. This strategy is not easy and can only be mastered by an experienced and thoughtful trader.
Are there any further development opportunities? Of course, they are. We will surely describe them later.
Programs used in the article
| # | Name |
Type |
Description |
|---|---|---|---|
| 1 | test.zip | Archive |
The pattern testing tools |
| 2 |
testhtml.zip | Archive | Results of testing using tools from the test.zip archive |
| 3 | test1.zip | Archive | EA code for testing with the filter |
| 4 | testhtml50.zip | Archive | Results of testing using tools from the test1.zip archive |
| 5 |
testhtml60.zip | Archive |
Results of testing using tools from the test1.zip archive |
| 6 | testEAbasket5.mq5 | EA | Test EA |