
Developing the oscillator-based ZigZag indicator. Example of executing a requirements specification

Contents
- Introduction
- General specification analysis
- Stage 1 — developing ZigZag
- Stage 2 — detecting the pattern and coloring
- Stage 3 — adding oscillators
- Stage 4 — developing the graphical interface
- Conclusion
- Attachments
Introduction
The article "How to prepare Requirements Specification when ordering an indicator" features a sample Requirements Specification for the development of a ZigZag indicator based on various oscillators. In this article, I will show you how to execute this task step by step.

Before you continue reading, be sure to study the specification by clicking the above link.
General specification analysis
The main requirements for the developed indicator can be seen during the first reading.
- The development is carried out in stages.
- Make sure to implement the maximum possible indicator performance.
- The indicator has the graphical interface.
ZigZag algorithm. ZigZag construction algorithm is different from the standard one.
- The ZigZag changes its direction not when a local extremum is formed, but when the oscillator value goes beyond the overbought/oversold level.
- The ZigZag is based on the price chart. Accordingly, a new extremum is determined by the price data.
Hence, it will be necessary to pay attention to certain features that follow from this.
- The indicator High/Low may not correspond to the price High/Low. Therefore, when changing the ZigZag direction, it is necessary to check if the new price High/Low has appeared a bit earlier than the oscillator's entry to the overbought/oversold area (Fig. 1).
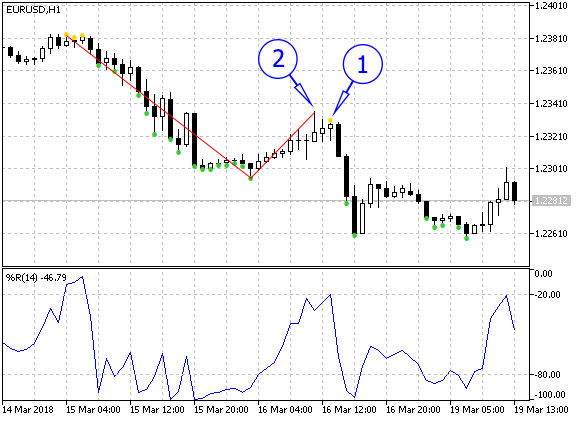
Fig. 1. WPR exit to the overbought area has occurred in a bar marked with the arrow 1,
however, the new ZigZag segment should be drawn up to the bar marked by the arrow 2 - Since the ZigZag direction change is defined by the oscillator, its value changes as the bar forms. Thus, ZigZag is able to change direction, but while the bar is formed, the direction change may be canceled. It is necessary to ensure the correct operation of the indicator in such cases.
- Since the new extremum is defined by a price chart (by High/Low prices), formation of the new High/Low cannot be canceled while the bar is formed. However, ZigZag may reverse on a bar with a new extremum. In this case, the new High/Low is canceled (Fig. 2).
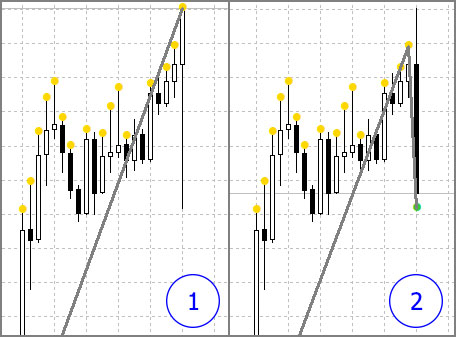
Fig. 2. 1 — ZigZag top is at the price High formed by the emerging bar.
2 — ZigZag reverses, while the previously detected High is canceledOf course, the case is ambiguous since MetaTrader 5 has Color ZigZag drawing style. It allows drawing the ZigZag segment vertically without moving its top to the left (for a predetermined maximum). However, such drawing does not provide us with an ability to paint two ZigZag segments (the vertical and the adjacent sloping one) independently. In addition, this way of drawing ZigZag is not very common, and the specification does not explicitly requires to apply this method. Thus, the most common option is selected by default.
Display. ZigZag display has its own features.
- Apart from displaying the indicator itself, the price chart should also mark bars, at which the indicator entered the overbought (yellow points at the bar's High) and oversold (green points at the bar's Low) areas.
- The pattern is revealed based on the mutual location of ZigZag tops and bottoms. The ZigZag segment that forms a pattern should have a different color. This turns out to be the greatest issue. First, we not only need to mark the bar, at which the pattern is detected, but also change colors of several ZigZag segments on history. Second, ZigZag reversal and new extremum may be canceled as the bar is formed. Therefore, before calculating the bar, we need to clear the ZigZag segment the pattern could be marked on (neutral color should be returned). Third, the patterns (including oppositely directed ones) may overlap. Thus, we should not disrupt the color of the previously detected pattern when clearing and painting a ZigZag segment (Fig. 3).
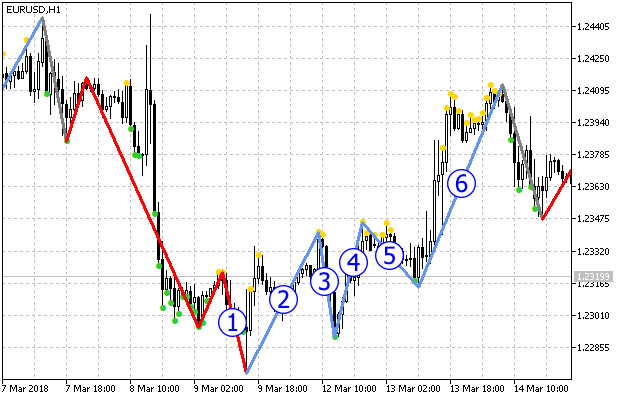
Fig. 3. Overlapping patternsLet's consider the ZigZag segment displayed on Fig. 3. Segments 1-4 constitute the uptrend pattern. This means, the segment 1 should be colored blue. But it has already been included into the downward pattern, therefore, it is painted in red. When the segment 6 appears, yet another upward pattern (segments 3-6) is formed. Since ZigZag segments should receive their initial color before each bar calculation, in this case, we only need to clear the segments 5 and 6, because the segments 3 and 4 already refer to another pattern.
The alternative solution is changing colors of all segments in each new pattern. However, this makes the indicator less informative on history. Therefore, we have selected the first option, although it is much more complicated.
Graphical interface. The requirements for the graphical interface are relatively simple. The set of controls is constant, it does not need to be changed depending on the selected oscillator. Only two numeric parameters are applied (overbought/oversold levels), and their set is identical for all oscillators.
After understanding all the features of the task, we can start developing the indicator. At the end of each development stage, we set the appropriate file name from the attachment. If you face any difficulties in understanding the order of adding the code during further reading, we recommend that you open the file of the corresponding stage in the editor and check it.
Stage 1 — developing ZigZag
Let us create the new OscZigZagStep1 custom indicator in MetaEditor. Add one external variable to mark the place in the code for variables. In the event handlers selection window, select the first option — OnCalculate(...,open,high,low,close), other handlers are not needed. Create two buffers in the display parameters window. Let's name the first buffer "HighLow", type — Color Arrow and two colors: Golg and LimeGreen. The second one is named "ZigZag", type — Color Section and three colors: Gray, CornflowerBlue and Red (Fig. 4).
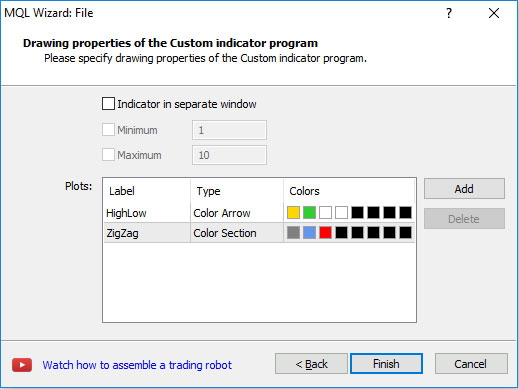
Fig. 4. Selecting the display parameters in the indicator development wizard window
Since color points are related to bars, it is more logical to first draw them (closer to bars), and then draw Zigzag. Therefore, the buffers are located in this order.
After clicking Finish, the indicator file appears in the editor. First, we should adjust the indicator_color1 properties values in it by deleting excessive color samples. The line with the indicator_color1 property should have the following look:
#property indicator_color1 clrGold,clrLimeGreen
The indicator_color2 property should be adjusted the same way (three colors should be left).
Find the string with the automatically created external parameter:
input int Input1;
Delete it and declare the variables for the WPR indicator parameters instead:
input int         WPRperiod   =  14;
input double      WPRmax      =  -20;
input double      WPRmin      =  -80;
Below, we declare the variable for the handle:
int h; Download the indicator at the very start of the OnInit() function:
h=iWPR(Symbol(),Period(),WPRperiod);
if(h==INVALID_HANDLE){
   Print("Can't load indicator");
   return(INIT_FAILED);
}
Release the handle in the OnDeinit() function:
void OnDeinit(const int reason){
   if(h!=INVALID_HANDLE){
      IndicatorRelease(h);
   }
}
When using the indicator development wizard, we have created the displayed buffers, but we also need auxiliary ones. For example, we need the buffer for the oscillator values at the moment. Increase indicator_buffers by one (set 5 instead of 4):
#property indicator_buffers 5
Declare yet another array for the buffer with the oscillator values where the arrays for buffers have already been declared:
double wpr[]; Indicate that the array is used as an indicator buffer for intermediary calculations in the OnInit() function. The code is added at the very end of the OnInit() function:
SetIndexBuffer(4,wpr,INDICATOR_CALCULATIONS);
Go to the OnCalculate() function, write the standard code for calculating the bars counting range and copying the WPR oscillator values to the buffer:
int start;

if(prev_calculated==0){
   start=0;
}
else{
   start=prev_calculated-1;
}

if(CopyBuffer(h,0,0,rates_total-start,wpr)==-1){
   return(0);
}
Now, we can write the standard indicator cycle and display the points where the oscillator enters overbought/oversold areas:
for(int i=start;i<rates_total;i++){
   HighLowBuffer[i]=EMPTY_VALUE;
   if(wpr[i]>WPRmax){
      HighLowBuffer[i]=high[i];
      HighLowColors[i]=0;
   }
   else if(wpr[i]<WPRmin){
      HighLowBuffer[i]=low[i];
      HighLowColors[i]=1;
   }
}
At this stage, the indicator can be attached to a chart. Let's attach the standard WPR as well to make sure all is well (Fig. 5).
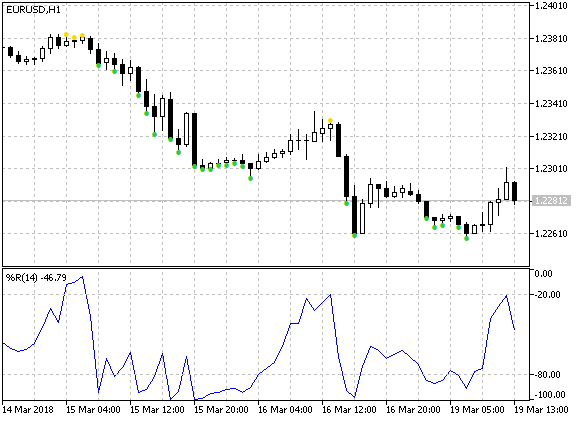
Fig. 5. Displaying the overbought/oversold areas on the price chart
Let's continue developing ZigZag. We will need several auxiliary buffers: one is for the current indicator direction, while other two ones are for the indices of the bars that indicate the ZigZag's last top and bottom:
double         dir[]; // for direction
double         lhb[]; // last top bar index
double         llb[]; // last bottom bar index
Since we add three buffers, we need to increase the property defining the number of the indicator buffers:
#property indicator_buffers 8
Apply the SetIndexBuffer() function to the newly declared arrays in the OnInit() function:
SetIndexBuffer(5,dir,INDICATOR_CALCULATIONS);
SetIndexBuffer(6,lhb,INDICATOR_CALCULATIONS);
SetIndexBuffer(7,llb,INDICATOR_CALCULATIONS);
This code is located right after the last call of the SetIndexBuffer() function already present in the OnInit() function.
Now, let's consider an important point. To let Color Section type buffer work correctly, make sure to set the empty value 0 for it. Otherwise, the lines shown below are displayed instead of ZigZag:
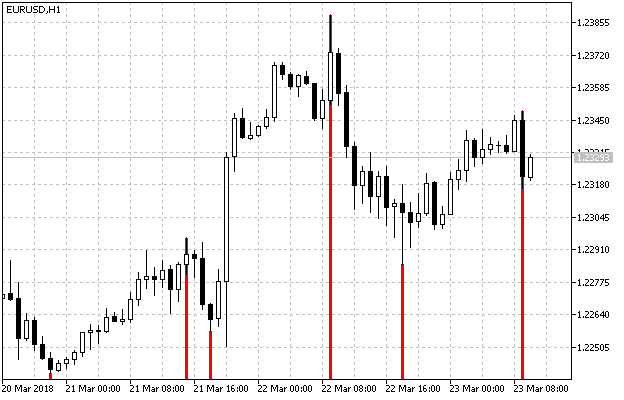
Fig. 6. ZigZag is displayed incorrectly if the value of the Color Section type buffer is not empty
To set an empty value, add the following string at the very end of the OnInit() function before the 'return' string:
PlotIndexSetDouble(1,PLOT_EMPTY_VALUE,0);
Please note that the first parameter is equal to 1. In this case, this is the index in the group of displayed buffers, i.e. 1 corresponds to the ZigZagBuffer[] buffer.
The OnInit() function is ready. Now, let's focus on the OnCalculate() function and continue writing the code in the standard indicator cycle.
At the start of the indicator cycle, move data along the auxiliary buffers after the first string with clearing the HighLowBudder buffer:
lhb[i]=lhb[i-1];
llb[i]=llb[i-1];
dir[i]=dir[i-1];
Let's add setting the direction to the dir[] buffer to our code where the oscillator entry to the overbought/oversold area is defined:
if(wpr[i]>WPRmax){
   HighLowBuffer[i]=high[i];
   HighLowColors[i]=0;
   dir[i]=1;
}
else if(wpr[i]<WPRmin){
   HighLowBuffer[i]=low[i];
   HighLowColors[i]=1;
   dir[i]=-1;
}
Now, the most exciting thing at the first stage is constructing ZigZag. ZigZag direction is defined. The dir[] buffer contains the value of 1 when heading upwards and -1 when heading downwards. Besides, we need to define the bars, on which the direction changes. The ZigZag base is comprised from the following code divided into 4 branches:
if(dir[i]==1){
   if(dir[i-1]==-1){
      // change direction upwards
   }
   else{
      // continue upward movement
   }
}
else if(dir[i]==-1){
   if(dir[i-1]==1){
      // change direction downwards
   }
   else{
      // continue downward movement
   }
}
Let's consider ZigZag direction change upwards and its subsequent upward movement. The other two branches are symmetrical.
Changing the upward direction
1. We search for the maximum price value on the bar range from the last bottom up to the calculated bar (the bottoms bar is not included in the range):
if(dir[i]==1){
   if(dir[i-1]==-1){
      // change direction upwards
      // search for maximum
      int hb=i;
      for(int j=i;j>llb[i];j--){
         if(high[j]>high[hb]){
            hb=j;
         }
      }
      //...
   }
   else{
      // continue upward movement
   }
}
2. On the detected bar, set the ZigZag point, set the bar index in the lhb[] buffer and define the neutral color via the ZigZagColor buffer:
ZigZagBuffer[hb]=high[hb];
lhb[i]=hb;
ZigZagColors[hb]=0;
3. When you re-calculate this bar, it may turn out that the value of the oscillator has changed and there should not be a point on it. Therefore, we need to remove it. This is usually done by clearing the buffer at the beginning of the indicator cycle:
ZigZagBuffer[i]=0; But in this case, the formed ZigZag top is separated from the calculated bar by an unknown number of bars (Fig. 1). Therefore, we need to save an index of the bar the new top is located at and time of the calculated bar:
NewDotTime=time[i];
NewDotBar=hb;
The NewDotTime and NewDotBar variables are declared on the indicator global level.
4. Check if the NewDotTime variable value matches the calculated bar at the beginning of the indicator cycle. If there is a match, remove the new ZigZag point:
if(NewDotTime==time[i]){
   ZigZagBuffer[NewDotBar]=0;
}
Upward movement
Let's consider the code segment that defines the continuation of the upward movement. If a high price of a bar exceeds the previously fixed ZigZag value, remove the old point and set the new one:
if(high[i]>ZigZagBuffer[(int)lhb[i]]){
   // remove the old point
   ZigZagBuffer[(int)lhb[i]]=0;
   // set the new one
   ZigZagBuffer[i]=high[i];
   ZigZagColors[i]=0;
   lhb[i]=i;
}
Return the indicator to its original state (get back the removed point) before re-calculating the bar at the beginning of the indicator cycle:
ZigZagBuffer[(int)lhb[i]]=high[(int)lhb[i]];
ZigZagBuffer[(int)llb[i]]=low[(int)llb[i]];
Make sure to initialize the lhb[] and llb[] buffers with zero values to avoid array out of range errors at the beginning of the indicator operation. Besides, we need to set the NewDotTime and NewDotBar variables to zero. This is done when calculating the count range:
if(prev_calculated==0){
   start=1;
   lhb[0]=0;
   llb[0]=0;
   NewDotTime=0;
}
else{
   start=prev_calculated-1;
}
At this point, the first stage of the indicator development is over. In the below attachment, the indicator at this stage is named OscZigZagStep1.mq5.
Stage 2 — detecting the pattern and coloring
To detect the pattern, we need to compare 5 ZigZag extreme points. It is not recommended to search for these tops each time all over the indicator in a loop, since this slows the indicator down (fast indicator operation is the main specification requirement). It is much better to save newly appearing extremums in a separate array providing direct and fast access to them.
Data on ZigZag extreme points are to be saved in the structures array. The structure should contain fields for bar index, value, direction and one more fields of the bool type. It saves 'true' if an extreme value is the last one in the pattern (to limit ZigZag coloring down to the previously recognized pattern). Describe the structure and declare the array:
struct SZZDot{
   int bar;
   double val;
   int dir;
   bool pat;
};

SZZDot ZZDot[];
Then, add the call of the AddZZDot() function to the end of each of the four code parts. The function adds new extreme values to the ZZDot[] array:
if(dir[i]==1){
   if(dir[i-1]==-1){
      //...
      AddZZDot(1,high[hb],hb,i);
   }
   else{
      if(high[i]>ZigZagBuffer[(int)lhb[i]]){
         //...
         AddZZDot(1,high[i],i,i);
      }
   }
}
else if(dir[i]==-1){
   if(dir[i-1]==1){
      //...
      AddZZDot(-1,low[lb],lb,i);
   }
   else{
      if(low[i]<ZigZagBuffer[(int)llb[i]]){
         //...
         AddZZDot(-1,low[i],i,i);
      }
   }
}
Pass the four parameters (direction, value, index of the bar with an extremum and calculated bar index) to the AddZdot() function. We will consider the function itself a bit later. Use the cnt[] indicator buffer for the number of detected extremums (occupied elements in the AADot[] array). Declare the cnt[] array:
double cnt[]; In the OnInit() function, call the SetIndexBuffer() function for it:
SetIndexBuffer(8,cnt,INDICATOR_CALCULATIONS);
Change the value of the property defining the number of buffers:
#property indicator_buffers 9
At the beginning of the indicator cycle, move the last value along the buffer:
cnt[i]=cnt[i-1]; We have already mentioned that ZigZag reversal detected during a bar calculation may disappear during the next calculation of the same bar. Therefore, an extremum saved in the array should be deleted. However, this deletion is performed not by reducing the array but rather by decreasing the counter that counts the number of the occupied array elements (cnt[] buffer). This significantly increases the speed of the indicator.
Let's have a look at the AddZdot() function:
void AddZZDot(int d,double v,int b,int i){

   int c=(int)cnt[i];

   if(c==0){
      // during the indicator launch or its complete recalculation
      ArrayResize(ZZDot,1024);
      ZZDot[c].dir=d;
      ZZDot[c].val=v;
      ZZDot[c].bar=b;
      ZZDot[c].pat=false;
      cnt[i]=1;
   }
   else{
      if(ZZDot[c-1].dir==d){
         // update the same-direction extremum
         ZZDot[c-1].val=v;
         ZZDot[c-1].bar=b;
      }
      else{
         // add the new extremum
         // increase the array by 1024 elements blocks when necessary
         if(c>=ArraySize(ZZDot)){
            ArrayResize(ZZDot,c+1024);
         }
         // add the new extremum
         ZZDot[c].dir=d;
         ZZDot[c].val=v;
         ZZDot[c].bar=b;
         ZZDot[c].pat=false;
         cnt[i]=c+1;
      }
   }
}
During the indicator launch or its complete recalculation, the array size is set to 1024. Its initial element has the extremum parameters, while the extremum counter is increased by 1. During subsequent function calls, direction of the last extremum in the array is checked. If it corresponds to the parameters, with which the function is called, then the data on the last extremum is updated. In case of an opposite direction, a new extremum is added.
When analyzing the task, I have already explained that during a ZigZag reversal, the last extremum of an opposite direction can be moved to an earlier bar (Fig. 2). Therefore, before executing the main ZigZag code, set the extremum value (known in advance) to the last occupied element of the ZZDot array. This is done at the end of the indicator cycle:
if(cnt[i]>0){
   int ub=(int)cnt[i]-1;
   if(ZZDot[ub].dir==1){
      ZZDot[ub].bar=(int)lhb[i];
      ZZDot[ub].val=high[(int)lhb[i]];
   }
   else{
      ZZDot[ub].bar=(int)llb[i];
      ZZDot[ub].val=low[(int)llb[i]];
   }
}
Now, if a new extremum is detected on a calculated bar, its value is updated in the ZZDot array. In case of a reversal, the previously known extremum value remains.
Before the first indicator calculation and when executing its full recalculation, initialize the initial element of the cnt[] array:
if(prev_calculated==0){
   //...
   cnt[0]=0;
}
else{
   start=prev_calculated-1;
}
Now that we have data on all ZigZag extremums and are able to access them easily, let's focus on detecting the pattern and its coloring. This is possible if there are at least 5 Zigzag extremums:
if(cnt[i]>=5)
Calculate the index of the last element in the extremum array:
int li=(int)cnt[i]-1;
Let's set that the pattern is not detected on this extremum. We need this to return neutral color to ZigZag:
ZZDot[li].pat=false;
Return the initial color to the part of ZigZag:
for(int j=0;j<4;j++){
   if(ZZDot[li-j].pat){
      break;
   }
   ZigZagColors[ZZDot[li-j].bar]=0;
}
Note: As soon as an extremum with the pattern is found, the cycle is over.
Check the pattern conditions:
if(ZZDot[li].dir==1){ // up
   if(
      ZZDot[li].val>ZZDot[li-2].val &&
      ZZDot[li-2].val>ZZDot[li-4].val &&
      ZZDot[li-1].val>ZZDot[li-3].val
   ){
      ZZDot[li].pat=true;
      // coloring
   }
}
else{ // down
   if(
      ZZDot[li].val<ZZDot[li-2].val &&
      ZZDot[li-2].val<ZZDot[li-4].val &&
      ZZDot[li-1].val<ZZDot[li-3].val
   ){
      ZZDot[li].pat=true;
      // coloring
   }
}
Now, we only have to write the coloring code. It is similar to the clearing one. For the upward direction:
for(int j=0;j<4;j++){
   if(j!=0 && ZZDot[li-j].pat){
      break;
   }
   ZigZagColors[ZZDot[li-j].bar]=1;
}
A slight difference from the clearing code is that exiting the cycle is not performed when j=0.
The second stage of the indicator development is complete. The indicator looks as follows:
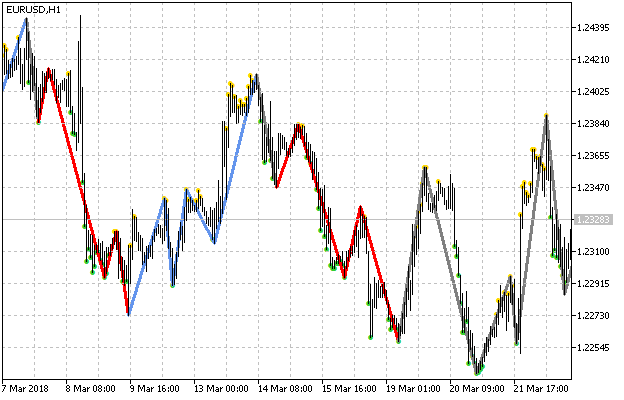
Fig. 7. The indicator at the end of the stage 2
In the below attachment, the indicator at this stage is named OscZigZagStep2.mq5.
Stage 3 — adding oscillators
Let's describe the enumeration:
enum EIType{
   WPR,
   CCI,
   Chaikin,
   RSI,
   Stochastic
};
Declare the external variable for selecting an oscillator:
input EIType Type = WPR; Add the parameters of the remaining oscillators:
// CCI
input int                  CCIperiod   =  14;
input ENUM_APPLIED_PRICE   CCIprice    =  PRICE_TYPICAL;
input double               CCImax      =  100;
input double               CCImin      =  -100;
// Chaikin
input int                  CHfperiod   =  3;
input int                  CHsperiod   =  10;
input ENUM_MA_METHOD       CHmethod    =  MODE_EMA;
input ENUM_APPLIED_VOLUME  CHvolume    =  VOLUME_TICK;
input double               CHmax       =  1000;
input double               CHmin       =  -1000;
// RSI
input int                  RSIperiod   =  14;
input ENUM_APPLIED_PRICE   RSIprice    =  PRICE_CLOSE;
input double               RSImax      =  70;
input double               RSImin      =  30;
// Stochastic
input int                  STperiodK   =  5;
input int                  STperiodD   =  3;
input int                  STperiodS   =  3;
input ENUM_MA_METHOD       STmethod    =  MODE_EMA;
input ENUM_STO_PRICE       STprice     =  STO_LOWHIGH;
input double               STmax       =  80;
input double               STmin       =  20;
Declare variables for the levels:
double max,min; Select an oscillator at the beginning of the OnStart function:
switch(Type){
   case WPR:
      max=WPRmax;
      min=WPRmin;
      h=iWPR(Symbol(),Period(),WPRperiod);
   break;
   case CCI:
      max=CCImax;
      min=CCImin;
      h=iCCI(Symbol(),Period(),CCIperiod,CCIprice);
   break;
   case Chaikin:
      max=CHmax;
      min=CHmin;
      h=iChaikin(Symbol(),Period(),CHfperiod,CHsperiod,CHmethod,CHvolume);
   break;
   case RSI:
      max=RSImax;
      min=RSImin;
      h=iRSI(Symbol(),Period(),RSIperiod,RSIprice);
   break;
   case Stochastic:
      max=STmax;
      min=STmin;
      h=iStochastic(Symbol(),Period(),STperiodK,STperiodD,STperiodS,STmethod,STprice);
   break;
}

if(h==INVALID_HANDLE){
   Print("Can't load indicator");
   return(INIT_FAILED);
}
Replace the WPRmax and WPmin variables with the max and min variables in the OnCalculate() function.
This completes the third stage of developing the indicator. Now, we can choose an oscillator in the indicator properties window. In the below attachment, the indicator at this stage is named OscZigZagStep3.mq5.
Stage 4 — developing the graphical interface
The IncGUI library is used to develop the graphical interface. This library is devoted to the series of articles "Custom Graphical Controls" consisting of three parts (part 1, part 2 and part 3). The latest revised version of the library (IncGUI_v4.mqh) is attached to the article "Universal oscillator with a GUI". It is also attached here. Before starting the graphical interface development, copy IncGUI_v4.mqh file to MQL5/Includes directory of the terminal data folder.
Let's consider developing the graphical interface in steps.
Including the library. Make a copy of the OscZigZagStep3 indicator named OscZigZagStep3 and include the library to it:
#include <IncGUI_v4.mqh> The form class. IncGUI_v4.mqh file contains the CFormTemplate class, which is a kind of a template for developing forms. Copy it and paste to the indicator file immediately after including the library. Then rename it from CFormTemplate into CForm.
The form properties. Set the main form properties in the MainProperties() method:
m_Name         =  "Form";
m_Width        =  200;
m_Height       =  150;
m_Type         =  2;
m_Caption      =  "ZigZag on Oscillator";
m_Movable      =  true;
m_Resizable    =  true;
m_CloseButton  =  true;
- The m_Name variable is a form name (prefix of all graphical objects making up the form).
- The m_Width and m_Height variables are the width and height of a form in pixels.
- The m_Type variable is a form type. If the value is 2, the bottom part of the form features the closing button.
- The m_Caption variable is a form header.
- The m_Movable variable is a movable form. The button for moving is located in the upper left corner of the form.
- The m_Resizable variable — the form can be expanded/collapsed. The appropriate button is located in the upper right corner.
- The m_CloseButton variable — the form can be closed. The appropriate button is located in the upper right corner.
Controls. Creating form controls. The form will have two frames. One frame will have a group of radio buttons, while another one will feature two input fields. Enter the following code in the 'public' section of the form class:
CFrame m_frm1; // frame 1
CFrame m_frm2; // frame 2
CRadioGroup m_rg; // group of radio buttons
CInputBox m_txt_max; // text field for the upper level
CInputBox m_txt_min; // text field for the lower level
Initialization of controls. Initialize the controls in the OnInitEvent() method.
Initialize the first frame having width/height of 85/97 pixels, "Osc Type" header and a place for a header with a width of 44 pixels:
m_frm1.Init("frame1",85,97,"Osc Type",44);
A group of radio buttons is to be located in this frame.
The second frame with the same dimensions, "Levels" header and a place for a header with a width of 32 pixels:
m_frm2.Init("frame2",85,97,"Levels",32);
The fields for entering levels are to be located in this frame.
Initialize the group of radio buttons:
m_rg.Init();
Add radio buttons to the group:
m_rg.AddButton(" WPR",0,0);
m_rg.AddButton(" CCI",0,16);
m_rg.AddButton(" Chaikin",0,32);
m_rg.AddButton(" RSI",0,48);
m_rg.AddButton(" Stochastik",0,64);
Initialize text fields for entering upper and lower levels:
m_txt_max.Init("max",45,-1," Max");
m_txt_min.Init("min",45,-1," Min");
Both fields have a width of 45 pixels and allow text entry (the third parameter is -1), one of them has the label "Max", while the second one — "Min".
Displaying controls. In the OnShowEvent() method, call the Show() methods of all controls and set their coordinates in the form:
m_frm1.Show(aLeft+10,aTop+10);
m_frm2.Show(aLeft+105,aTop+10);
m_rg.Show(aLeft+17,aTop+20);
m_txt_max.Show(aLeft+115,aTop+30);
m_txt_min.Show(aLeft+115,aTop+50);
Hiding controls. Hide all controls in the OnHideEvent() method:
m_frm1.Hide();
m_frm2.Hide();
m_rg.Hide();
m_txt_max.Hide();
m_txt_min.Hide();
Form header. When choosing different oscillators, it would be good to display their names in the form header, so in the 'public' section of the form class, we add a method for changing the text in the header:
void SetCaption(string str){
   m_Caption="ZigZag on "+str;
   ObjectSetString(0,m_Name+"_Caption",OBJPROP_TEXT,m_Caption);
}
Creating the form object. Create the CForm class object:
CForm form;
Form events. In order for the form and controls to respond to user actions, the Event() method should be called from the OnChartEvent() function of the indicator. Depending on the type of event, the method returns different values. Form closing corresponds to 1. The indicator should be removed from the chart:
if(form.Event(id,lparam,dparam,sparam)==1){
   ChartIndicatorDelete(0,0,MQLInfoString(MQL_PROGRAM_NAME));
   ChartRedraw();
}
Control events. Radio button group event should change the indicator, while events of changing entry field values should alter overbought/oversold levels. In both cases, the indicator is fully recalculated.
Part of the code, in which the indicator is selected in the OnInit() function, is sent into a separate function:
bool LoadIndicator(int aType){
   switch(aType){
      case WPR:
         max=WPRmax;
         min=WPRmin;
         h=iWPR(Symbol(),Period(),WPRperiod);
      break;
      case CCI:
         max=CCImax;
         min=CCImin;
         h=iCCI(Symbol(),Period(),CCIperiod,CCIprice);
      break;
      case Chaikin:
         max=CHmax;
         min=CHmin;
         h=iChaikin(Symbol(),Period(),CHfperiod,CHsperiod,CHmethod,CHvolume);
      break;
      case RSI:
         max=RSImax;
         min=RSImin;
         h=iRSI(Symbol(),Period(),RSIperiod,RSIprice);
      break;
      case Stochastic:
         max=STmax;
         min=STmin;
         h=iStochastic(Symbol(),Period(),STperiodK,STperiodD,STperiodS,STmethod,STprice);
      break;
   }

   if(h==INVALID_HANDLE){
      Print("Can't load indicator");
      return(false);
   }

   return(true);

}
It is called from the OnInit() indicator function (at its very beginning) and by a radio button event. Immediately after selecting the indicator in the OnInit() function, initialize the form, set the values for the controls and display the form:
if(!LoadIndicator(Type)){
   return(INIT_FAILED);
}

form.Init(1);
form.m_rg.SetValue(Type);
form.m_txt_max.SetValue(max);
form.m_txt_min.SetValue(min);
form.SetCaption(EnumToString(Type));
form.Show(5,20);
Process control events in the OnChartEvent() function. Radio button event for changing the indicator:
if(form.m_rg.Event(id,lparam,dparam,sparam)==1){

   if(h!=INVALID_HANDLE){
      IndicatorRelease(h);
      h=INVALID_HANDLE;
   }

   if(!LoadIndicator(form.m_rg.Value())){
      Alert("Can't load indicator");
   }

   form.m_txt_max.SetValue(max);
   form.m_txt_min.SetValue(min);

   EventSetMillisecondTimer(100);
}
First, release the indicator handle by the IndicatorRelease() function, then select the new indicator, set new values for input fields and launch the timer. Using the timer is necessary since data update errors are possible when recalculating the indicator. In such cases, you will need to repeat recalculation attempt until it succeeds.
Changing the levels:
if(form.m_txt_max.Event(id,lparam,dparam,sparam)==1 ||
   form.m_txt_min.Event(id,lparam,dparam,sparam)==1
){
   max=form.m_txt_max.ValueDouble();
   min=form.m_txt_min.ValueDouble();
   EventSetMillisecondTimer(100);
}
New values are assigned and the timer is launched by input fields events, as well as 'min' and 'max' variables.
The indicator is recalculated in the OnTimer() function. If successful, the timer turns off and the indicator continues its work as usual — by ticks. All actions necessary for the indicator recalculation were considered in detail in the above-mentioned article "Universal oscillator with a GUI". Therefore, we will consider only fundamental differences here. The universal oscillator was calculated in a class method that does not require price data. Here we need to call the OnCalculate() function and pass arrays with prices in it. Declare the arrays:
datetime time[];
double open[];
double high[];
double low[];
double close[];
long tick_volume[];
long volume[];
int spread[];
Obtain the number of bars:
int bars=Bars(Symbol(),Period());

if(bars<=0){
   return;
}
We do not need all price data to build ZigZag. Only three arrays are necessary: 'time', 'high' and 'low'. These are the arrays we copy:
if(CopyTime(Symbol(),Period(),0,bars,time)==-1){
   return;
}

if(CopyHigh(Symbol(),Period(),0,bars,high)==-1){
   return;
}

if(CopyLow(Symbol(),Period(),0,bars,low)==-1){
   return;
}
When testing the indicator, we have faced an issue: the amount of copied data is sometimes less than the number of bars obtained by the Bars() function. The size of the indicator buffers corresponds to the Bars() function value. Therefore, for correct display of the indicator, it is necessary to increase the arrays with the copied data, while moving the data to their end:
if(ArraySize(time)<bars){
   int sz=ArraySize(time);
   ArrayResize(time,bars);
   for(int i=sz-1,j=bars-1;i>=0;i--,j--){
      time[j]=time[i];
   }
}

if(ArraySize(high)<bars){
   int sz=ArraySize(high);
   ArrayResize(high,bars);
   for(int i=sz-1,j=bars-1;i>=0;i--,j--){
      high[j]=high[i];
   }
}

if(ArraySize(low)<bars){
   int sz=ArraySize(low);
   ArrayResize(low,bars);
   for(int i=sz-1,j=bars-1;i>=0;i--,j--){
      low[j]=low[i];
   }
}
Now, we only have to call the OnCalculate() function:
int rv=OnCalculate(
            bars,
            0,
            time,
            open,
            high,
            low,
            close,
            tick_volume,
            volume,
            spread
);
Disable the timer if the OnCalculte() function has worked with no errors:
if(rv!=0){
   ChartRedraw();
   EventKillTimer();
   form.SetCaption(EnumToString((EIType)form.m_rg.Value()));
}
The full code of the OnTimer() function, as well as the fully completed indicator can be seen in the attached OscZigZagStep4.mq5 file.
When launching the indicator on the chart, the form with controls should be displayed in the upper left corner (Fig. 8).
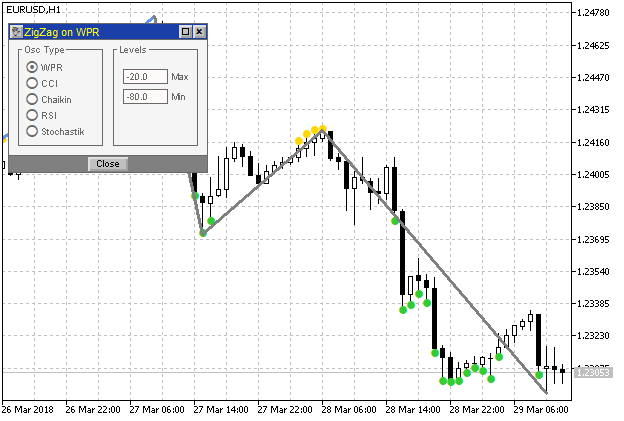
Fig. 8. Graphical interface at step 4
Conclusion
I have demonstrated the development of the indicator exactly according to the proposed requirements specification. However, the accuracy of execution does not define the entire work. In our case, the task was prepared by a technically experienced person who is obviously well aware of the terminal capabilities and indicator features. However, some requirements still need clarification and should be discussed with the customer. This refers in particular to ZigZag coloring.
When the pattern is detected, several previous ZigZag segments are repainted, which may disrupt our analysis of the indicator on history. The fact that new details can be added to the pattern complicates the visual analysis even further. In practice, the pattern is needed in order to make a trading decision. It can be made when the pattern appears or later, but not earlier. Therefore, instead of coloring ZigZag, one could suggest drawing arrows on the bar the pattern is detected on. Another solution is drawing horizontal lines on a number of bars, while the pattern exists, from the moment it is detected to the future.
Besides, while developing the indicator, its unexpected and unobvious feature has been revealed, which it is impossible to think about even at the first reading of the task, and even more so when it is compiled. I mean some cases where it is necessary to delete the last ZigZag maximum/minimum when it is reversed. As mentioned in the article, you could use the Color ZigZag buffer, but in this case, there would be difficulties in coloring it because the Color ZigZag buffer set has two data buffers and only one buffer for color. If both data buffers have values on a single bar (a vertical line runs along the bar), the color specified in the color buffer is assigned to two ZigZag segments at once. It is possible to use ZigZag, rather than the Color ZigZag buffer, and repaint ZigZag segments using graphical objects, or simply set arrows or dots. In general, any task requires very careful analysis and preliminary discussion.
Attachments
The files are placed in right folders. They should be saved to the same folders of the terminal. In MQL5/Indicators, there are the files corresponding to the indicator development stages: OscZigZagStep1.mq5, OscZigZagStep2.mq5, ОscZigZagStep3.mq5 and OscZigZagStep4.mq5.
In MQL5/Includes, there is IncGUI_v4.mqh file for developing the graphical interface in the OscZigZagStep4 indicator.
Translated from Russian by MetaQuotes Ltd.
Original article: https://www.mql5.com/ru/articles/4502
 Visual strategy builder. Creating trading robots without programming
 Processing optimization results using the graphical interface
 Random Decision Forest in Reinforcement learning
- Free trading apps
- Over 8,000 signals for copying
- Economic news for exploring financial markets
You agree to website policy and terms of use