Trading DiNapoli levels
Dmitriy Zabudskiy | 22 December, 2017
Introduction
Just like our real life, the market is constantly evolving. Something which did perfrectly yesterday, shows discouraging results today. However, there remain some fundamental strategies which experience some minor corrections over time, but do not change their ideological basis. One of them is “DiNapoli levels”, a strategy named after its founder. It represents stripped down realization of Fibonacci retracements.
Initial points of the strategy - Fibonacci levels are 38.2% and 61.8%. For take profit points, the following are accepted: COP (Contracted Objective Point) — 61.8%, OP (Objective Point) — 100%, XOP (Expanded Objective Point) — 161.8%. All the distances are specified in per cents from trend length (see fig. 1).

Fig. 1. DiNapoli levels on currency pair EURUSD H4
At figure 1, levels are set using Fibonacci tools which are part of standard MetaTrader 5 package - Fibonacci retracements (of red color) and expansions (of blue color). Besides, the figure demonstrates how levels are set up. The vertical line marked with two arrows shows the level of 61.8%, which is taken from trend (red downward line) and is set downward from maximal rollback price, forming COP level.
There are four variants for market entering: “Bushes”, “Bonsai”, “Minesweeper A” and “Minesweeper B”. The first two are the most aggressive. Market entry by them takes place on the first correction. The last two scenarios imply opening a position on the second correction. Other differences between these variants are in placing Stop Loss level. These methods are detailed in article "DiNapoli trading system" therefore, here we will not go into details.
On the above provided figure, we just wanted to show classical picture of DiNapoli levels, the said strategy foundation. As you see, the best option to enter the market is at level 61.8% (and here you can see a red price mark), however, this level is not always reached. Therefore, some traders started to actively sell at 38.2%: this is evidenced by downward candle at 20:00. Such entries are more characteristic to agressive trading according to “Bushes” method. Following it, a trader places stop at a higher level than that, at which the position is opened. Deal closing took place at COP level (61.8%). It is marked at the figure with the blue price mark.
It looks rather simple, but in practice the described levels are not always triggered due to frequent trend variation. In order to determine the trend more definitely, the strategy author offers to use indicators in addition to levels: moving average (MA) and oscillator Stochastic. It is on this foundation, that I offer to develop a profitable strategy and to implement it in the Expert Advisor.
Forming a strategy on standard MetaTrader 5 tools
Effective DiNapoli levels trading strategy implies joint functioning of a big number of factors. Therefore, its programming realization is rather complex and interesting. Also, there are difficulties in trading organization: according to this strategy, sometimes you have to wait for a long time for an appropriate moment to enter the market. Continuous manual monitoring is a difficult task for a trader, thus, in such trading machine factor will prevail.
I will try to maximally simply and comprehensibly explain the strategy which will serve as the basis for our Expert Advisor.
")
Fig. 2. DiNapoli levels with auxiliary indicators EURUSD H4 (upward trend)
Figure 2 shows the chart of currency pair EURUSD H4. The following are marked on it: DiNapoli levels, indicator Stochastic (8,3,3) and two moving averages with the shift of 5 and periods of 25 (red) and 7 (blue).
Let’s start one by one. In the chart we can see an upward trend with the Grid of Fibonacci superposed over it, with levels 23.6%, 38.2%, 50%, 61.8%. Here, there are more levels than with the classical realization: practice showed that price could repel from each of them.
On rollback (correction) Fibonacci expansion is superposed: this is the way COP and OP levels occur. However, both in this case and in the strategy in general, these levels are insignificant. Here, they are calculated exclusively for setting up Take Profit (later we will see it in the code).
The net result is that the entry is possible in four points. The figure demonstrates that if catching the trend reverse in the very beginning and opening a position in point 23.6%, it will get profit; however, the drawdown will be very significant. Certainly, this will not satisfy us, therefore we will continue searching for a more reliable entry point.
- Rule one: DiNapoli level entry is possible from 23.6% to 61.8%. This is a rather wide range, that is why we should proceed to the second stage of analysis.
The following signal filter is Stochastic indicator (with parameters 8,3,3) with two levels - 30 and 70.
- Rule two: buy when the signal and main lines of Stochastic are under the level of 30; and sell when they are above the level of 70.
Now, let’s determine the trend. For doing this, use moving average (shift 5, period 25). It turns out, that buying is possible when the price is higher than trend line, while sale is possible when it is lower. But this is a quite wide range and to reduce it, let’s introduce one more moving average (shift 5, period 7). But even when using it, the range may remain too wide. In such cases its additional reduction is introduced: it is allowed to open deals only on the “upper half” of divergences, closer to the line with the period of 25.
- Rule three: buy in the second half of time interval, closer to the line with the period of 25; whereas, the line with a less time interval is placed above.
- Rule four: sell in the second half of time interval, closer to the line with the period of 25; whereas, the line with a less time interval is placed under.
Suppose, that the above listed conditions worked out and we have opened a position. Now, let’s arrange rules for its closing. For doing this, we will use the levels formed by Fibonacci expansion, as well as Stochastic indicator.
- Rule five: close a deal if the price reaches one of target DiNapoli levels (COP, OP, XOP), or Stochastic indicator will give closing signal.
In figure 2 and 3, the areas fitting these rules are shown in yellow rectangles.
")
Fig.3. DiNapoli levels with auxiliary indicators EURUSD H4 (downward trend)
As you can see, the resulted rules are logical and clear. Placing Take Profit or Stop Loss and minor trailing for transferring to breakeven have not yet been stipulated in them. All this will be considered below.
Coding the Strategy
Input parameters
First, connect class CTrade (Trade.mqh). Then, establish parameters of DiNapoli levels - minimal and maximal entry level. By default, they are set as specified above: from 23.6% to 61.8%. But for different currency pairs, they may vary and be in different limits.
The following parameters are Take Profit and Stop Loss. Stop Loss is placed by levels from the peak price. In figures 2 and 3, they are shown in red. Take Profit is placed from order placing price.
That is, suppose that buy level is 50%, Stop Loss is set to 70%, Take Profit - to 70%. It means that, if assuming that 100% is 100 points, Stop Loss will be placed lower than buy price by 20 points, while Take Profit - by as much as 70 points. This must be considered when optimizing the EA.
Further, we must define trailing or passing to breakeven. According to current parameters in the code, when the price passes by 400 points, Stop Loss will shift to the profit side by 10 points.
The rest of parameters require no comments.
//+------------------------------------------------------------------+
//|                                               Dinapoli_v1.01.mq5 |
//|                                                          Aktiniy |
//|                                            https://www.mql5.com/ |
//+------------------------------------------------------------------+
#property copyright "Aktiniy"
#property link      "https://www.mql5.com/"
#property version   "1.01"
#include<Trade\Trade.mqh>
//--- input parameters
//--- Fibo number
input double   percent_min_enter=23.6;      // Minimal entry per cent
input double   percent_max_enter=61.8;      // Maximal entry per cent
input double   percent_for_tp=60;           // Per cent of possible Take Profit
input double   percent_for_sl=70;           // Per cent of possible Stop Loss
input int      trailing_sl=400;             // Switch to breakeven at passing through points
input int      trailing_profit=10;          // Breakeven level in points
//--- order
input long     magic_number=65758473787389; // Magic number
input double   order_volume=0.01;           // Lot size
input int      order_deviation=100;         // Deviation on position opening
//--- Stochastic
input int      stochastic_k=8;              // Indicator Stochastic “Period %К"
input int      stochastic_d=3;              // Indicator Stochastic “Slowing"
input int      stochastic_slowing=3;        // Indicator Stochastic “Period %D"
input double   stochastic_up_level=70;      // Indicator Stochastic “Signal level from top"
input double   stochastic_down_level=30;    // Indicator Stochastic "Signal level from bottom"
//--- MA RED 25 5
input int      ma_red_period=25;            // Indicator MA RED “Period"
input int      ma_red_shift=5;              // Indicator MA RED “Shift"
//--- MA BLUE 7 5
input int      ma_blue_period=7;            // Indicator MA BLUE “Period"
input int      ma_blue_shift=5;             // Indicator MA BLUE “Shift"
//--- Variable
CTrade trade;
int stochastic_handle=0;
char answer_stochastic=0;
int ma_red_handle=0;
int ma_blue_handle=0;
char answer_ma=0;
int fractals_handle=0;
In conclusion, there are determined the variables storing indicator handles and answers of signal functions to them.
Initialization
Below is a small initialization function. Here, we set up CTrade and receive indicator handles.
//+------------------------------------------------------------------+
//| Expert initialization function                                   |
//+------------------------------------------------------------------+
int OnInit()
  {
//---
   trade.SetExpertMagicNumber(magic_number);
   trade.SetDeviationInPoints(order_deviation);
   trade.SetTypeFilling(ORDER_FILLING_FOK);
   trade.SetAsyncMode(false);

   stochastic_handle=iStochastic(_Symbol,_Period,stochastic_k,stochastic_d,stochastic_slowing,MODE_SMA,STO_LOWHIGH);
   ma_red_handle=iMA(_Symbol,_Period,ma_red_period,ma_red_shift,MODE_SMA,PRICE_CLOSE);
   ma_blue_handle=iMA(_Symbol,_Period,ma_blue_period,ma_blue_shift,MODE_SMA,PRICE_CLOSE);
   fractals_handle=iFractals(_Symbol,_Period);
//---
   return(INIT_SUCCEEDED);
  }
Prior to proceeding to the main function, let us study the principle of signal functions.
Getting signal from Stochastic
//+------------------------------------------------------------------+
//| Getting signal from Stochastic                                   |
//+------------------------------------------------------------------+
void Stochastic(char &answer)                                                                          // 0 - no signal; 1 - signal upwards; 2 - signal downwards
  {
   answer=0;                                                                                           // answer
   double stochastic_line_main[3];
   double stochastic_line_signal[3];
   int line_main=CopyBuffer(stochastic_handle,0,0,3,stochastic_line_main);
   int line_signal=CopyBuffer(stochastic_handle,1,0,3,stochastic_line_signal);
   if(line_main!=3 || line_signal!=3)
     {Alert("Error of copy iStochastic: main line=",line_main,", signal line=",line_signal);}          // checking copied data Stochastic

   if(stochastic_line_main[1]>stochastic_up_level && stochastic_line_signal[1]>stochastic_up_level)
     {answer=2;}                                                                                       // sale beneficial
   if(stochastic_line_main[1]<stochastic_down_level && stochastic_line_signal[1]<stochastic_down_level)
     {answer=1;}                                                                                       // buy beneficial
  }
This is ultimately simple: three last values of indicator are copied, the last one of them is compared with the levels preset in settings. The function passes answer in a variable.
Getting signal from indicators MA
//+------------------------------------------------------------------+
//| Getting signal from indicators MA                                |
//+------------------------------------------------------------------+
void MA(char &answer,                                               // 0 - no signal; 1 - signal upwards; 2 - signal downwards
        double &line_blue,
        double &line_red,
        double ask,
        double bid)
  {
   answer=0;                                                        // answer
   double ma_red[3];
   double ma_blue[3];
   int red=CopyBuffer(ma_red_handle,0,0,3,ma_red);
   int blue=CopyBuffer(ma_blue_handle,0,0,3,ma_blue);
   if(red!=3 || blue!=3)
     {Alert("Error of copy iMA: MA red=",red,", MA blue=",blue);}   // check copied data MA red and blue

   line_blue=ma_blue[2];
   line_red=ma_red[2];

   if(ma_blue[2]>ma_red[2])                                         // supposedly the trend is directed upwards
      if(ask<ma_blue[2])                                            // supposedly the price is in rollback position
         if(ask>ma_red[2])
           {answer=1;}                                              // soon movement to trend direction (upwards) possible

   if(ma_blue[2]<ma_red[2])                                         // supposedly the trend is directed downwards
      if(bid>ma_blue[2])                                            // supposedly the price is in rollback position
         if(bid<ma_red[2])
           {answer=2;}                                              // soon movement to trend direction (downwards) possible
  }
Here, three last values are also copied into buffers; then, by way of comparison it is defined whether the price is between two indicator lines. Earlier, we have discussed that often the interval within which trading is possible, should be narrowed. It is due to this reason the function passes not only the answer, but also last values of two moving averages. The mechanism of trading interval narrowing will be considered later.
Receiving data from indicator Fractals
Function of trend size establishment is more complex. It is implemented on Fractals data. In the beginning of function 100 last data are copied, then checkup of upper and lower signals is performed in two cycles. Here, a test on fractal availability is realized: all the values over 10 000 are filtered off, then neighboring ones are compared searching for the biggest and the smallest first fractal from the end.
//+------------------------------------------------------------------+
//| Receiving data from indicator Fractals                           |
//+------------------------------------------------------------------+
void Fractals(double &price_up,
              double &price_down)
  {
   price_up=0;
   price_down=0;
   double fractals_up[100];
   double fractals_down[100];
   int up=CopyBuffer(fractals_handle,0,0,100,fractals_up);
   int down=CopyBuffer(fractals_handle,1,0,100,fractals_down);
   if(up!=100 || down!=100)
     {Alert("Error of copy iFractals: Fractals up=",up,", Fractals down=",down);} // checking copied data Fractals up and down

   double price_high=0;
   double price_low=0;

   for(int x=99; x>0; x--)                                                        // cycle for upper fractal
     {
      if(fractals_up[x]<10000)                                                    // checking fractal availability
        {
         if(price_high==0){price_high=fractals_up[x];}                            // initial checkup
         if(price_high>fractals_up[x]){break;}                                    // if fractals are going downward stop cycle
         else{price_high=fractals_up[x];}                                         // if fractals are going upward, copying
        }
     }

   for(int x=99; x>0; x--)                                                        // repeating cycle for lower fractal
     {
      if(fractals_down[x]<10000)                                                  // checking fractal availability
        {
         if(price_low==0){price_low=fractals_down[x];}                            // initial checkup
         if(price_low<fractals_down[x]){break;}                                   // if fractals are going upward, stopping cycle
         else{price_low=fractals_down[x];}                                        // if fractals are going downward, copying
        }
     }

   double price_ask=SymbolInfoDouble(_Symbol,SYMBOL_ASK);                         // buy price request
   double price_bid=SymbolInfoDouble(_Symbol,SYMBOL_BID);                         // sell price request

   if(price_high>price_ask && price_high>price_bid)                               // checking whether ask and bid prices are between the up and down price
      if(price_low<price_ask && price_low<price_bid)
        {
         price_up=price_high;                                                     // assigning values on answer
         price_down=price_low;
        }
  }
//+------------------------------------------------------------------+
To make sure the signal is reliable, before the answer it is checked whether the price is within the found range. This is done because the last and probably the key fractal is formed after creation of two last candles (according to fractal formation rules).
Calculation of position opening price
The most important function is responsible for calculation of DiNapoli levels. Earlier received price maximum and minimum, as well as data on direction of the supposed trend and the last values from moving averages are passed into it. At first, all the obtained distances are transformed into points; and out of them on the basis of per cents preset in parameters sections are calculated. The sections are fractional, therefore we will normalize them.
//+------------------------------------------------------------------+
//| Calculation of position opening price                            |
//+------------------------------------------------------------------+
void Price_for_order(double high_price,
                     double low_price,
                     double &p_enter_min,
                     double &p_enter_max,
                     double &p_tp,
                     double &p_sl,
                     char trend,                                      // 1 - upward; 2 - downward
                     double blue_line,
                     double red_line
                     )
  {
   double point_price=(high_price-low_price);
   double point_enter_min=point_price*percent_min_enter/100;
   double point_enter_max=point_price*percent_max_enter/100;
   double point_tp=point_price*percent_for_tp/100;
   double point_sl=point_price*percent_for_sl/100;
   double point_ma_line=MathAbs(blue_line-red_line)/2;

   point_enter_min=NormalizeDouble(point_enter_min,_Digits);
   point_enter_max=NormalizeDouble(point_enter_max,_Digits);
   point_ma_line=NormalizeDouble(point_ma_line,_Digits);

   point_tp=NormalizeDouble(point_tp,_Digits);
   point_sl=NormalizeDouble(point_sl,_Digits);

   if(trend==1)                                                       // upward
     {
      p_enter_min=high_price-point_enter_min;
      double p_ma_min=red_line+point_ma_line;
      if(p_enter_min>p_ma_min)
        {p_enter_min=p_ma_min;}
      p_enter_max=high_price-point_enter_max;
      if(p_enter_max>p_enter_min)
        {p_enter_max=red_line;}

      p_tp=p_enter_min+point_tp;
      p_sl=high_price-point_sl;
     }

   if(trend==2)                                                       // downward
     {
      p_enter_min=low_price+point_enter_min;
      double p_ma_min=red_line-point_ma_line;
      if(p_enter_min<p_ma_min)
        {p_enter_min=p_ma_min;}
      p_enter_max=low_price+point_enter_max;
      if(p_enter_max<p_enter_min)
        {p_enter_max=red_line;}

      p_tp=p_enter_min-point_tp;
      p_sl=low_price+point_sl;
     }
  }
Further, depending on trend direction, prices are calculated and the function returns the answer.
Modification and closing of position
First, get all the data on the last position. Further, depending on order type, it gets upgraded (moves to breakeven) or closed, if Stochastic provides an opposite signal.
//+------------------------------------------------------------------+
//| Modification and closing of position                             |
//+------------------------------------------------------------------+
void Position_mod(double ask,
                  double bid,
                  int point,
                  int profit,
                  char stochastic)
  {
   double price=trade.RequestPrice();
   double tp=trade.RequestTP();
   double sl=trade.RequestSL();
   double sl_point=point*_Point;
   double sl_profit=profit*_Point;
   double tp_point=(MathAbs(tp-price))/2;

   if(trade.RequestType()==ORDER_TYPE_BUY)              // buy order
     {
      if(sl<price && bid>(price+sl_point))
        {
         sl_profit=sl_profit+price;
         trade.PositionModify(_Symbol,sl_profit,tp);
        }
      if(stochastic==2)                                 // move downward is expected
        {
         trade.PositionClose(_Symbol,order_deviation);
        }
     }
   if(trade.RequestType()==ORDER_TYPE_SELL)             // sell order
     {
      if(sl>price && ask<(price-sl_point))
        {
         sl_profit=sl_profit-price;
         trade.PositionModify(_Symbol,sl_profit,tp);
        }
      if(stochastic==1)                                 // move upward is expected
        {
         trade.PositionClose(_Symbol,order_deviation);
        }

     }
  }
Consolidating function
The last function consolidates all the earlier considered functions. In the beginning, all the reconciling variables are declared. Then, through indicator functions current main values of “upper strategy rules” are received. Further, division takes place depending on received answers on “upper rules”. Size of trend and prices which provide for beneficial entry to the market, are calculated. If earlier opened positions are not discovered and the price is within the calculated range, the position opens.
//+------------------------------------------------------------------+
//| Expert tick function                                             |
//+------------------------------------------------------------------+
void OnTick()
  {
//---
   double price_high=0;                                           // high price for calculation on fractals
   double price_low=0;                                            // low price for calculation on fractals

   double price_enter_min=0;                                      // minimal entry price
   double price_enter_max=0;                                      // maximal entry price
   double price_tp=0;                                             // Take Profit level
   double price_sl=0;                                             // Stop Loss level

   double price_ask=SymbolInfoDouble(_Symbol,SYMBOL_ASK);         // buy price request
   double price_bid=SymbolInfoDouble(_Symbol,SYMBOL_BID);         // sell price request

   double ma_blue_line=0;                                         // value of few-period МА BLUE
   double ma_red_line=0;                                          // value of multi-period МА RED

   Stochastic(answer_stochastic);
   MA(answer_ma,ma_blue_line,ma_red_line,price_ask,price_bid);

   if(answer_stochastic==1)                                       // move upward is expected
     {
      if(answer_ma==1)                                            // we are in buy-trade range
        {
         Fractals(price_high,price_low);
         Price_for_order(price_high,price_low,price_enter_min,price_enter_max,price_tp,price_sl,1,ma_blue_line,ma_red_line);

         if(price_ask<price_enter_min && price_ask>price_enter_max)
           {
            if(PositionsTotal()==0)
              {
               trade.Buy(order_volume,_Symbol,price_ask,price_sl,price_tp,"Buy");
              }
           }
        }
     }

   if(answer_stochastic==2)                                        // we are in sell-trade range
     {
      if(answer_ma==2)                                             // move downward is expected
        {
         Fractals(price_high,price_low);
         Price_for_order(price_high,price_low,price_enter_min,price_enter_max,price_tp,price_sl,2,ma_blue_line,ma_red_line);

         if(price_bid>price_enter_min && price_bid<price_enter_max)
            if(PositionsTotal()==0)
              {
               trade.Sell(order_volume,_Symbol,price_bid,price_sl,price_tp,"Sell");
              }
        }
     }

   if(PositionsTotal()!=0)
     {
      Position_mod(price_ask,price_bid,trailing_sl,trailing_profit,answer_stochastic);
     }

  }
In case, if open positions are already available, call position upgrade/delete function. This is the end of the code. Now, it is time we test the Expert Advisor.
Test results
Expert Advisor Dinapoli_v1.01 was tested on various currency pairs, on timeframe H4. We used history from 2017.01.01 to 2017.11.12.
Symbol: EURUSD
| Parameters: | ||
|---|---|---|
| percent_min_enter=33.6 | magic_number=65758473787389 | stochastic_up_level=70 |
| percent_max_enter=56 | order_volume=0.01 | stochastic_down_level=30 |
| percent_for_tp=145 | order_deviation=100 | ma_red_period=25 |
| percent_for_sl=100 | stochastic_k=8 | ma_red_shift=5 |
| trailing_sl=675 | stochastic_d=3 | ma_blue_period=7 |
| trailing_profit=40 | stochastic_slowing=3 | ma_blue_shift=5 |
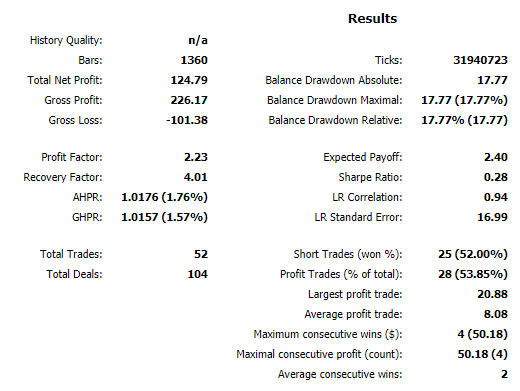
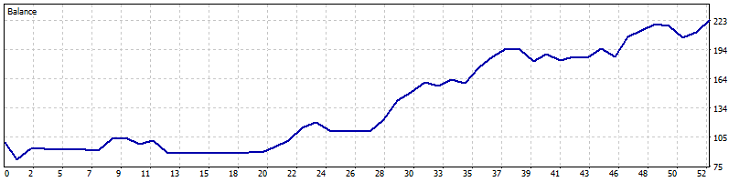
Fig.4. Testing results EURUSD H4 (2017.01.01 - 2017.11.12)
Symbol: GBPUSD
| Parameters: | ||
|---|---|---|
| percent_min_enter=23.6 | magic_number=65758473787389 | stochastic_up_level=90 |
| percent_max_enter=50 | order_volume=0.01 | stochastic_down_level=30 |
| percent_for_tp=335 | order_deviation=100 | ma_red_period=15 |
| percent_for_sl=63 | stochastic_k=3 | ma_red_shift=5 |
| trailing_sl=425 | stochastic_d=1 | ma_blue_period=4 |
| trailing_profit=20 | stochastic_slowing=4 | ma_blue_shift=5 |
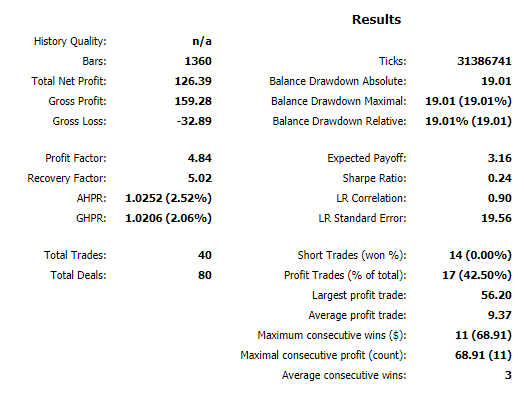
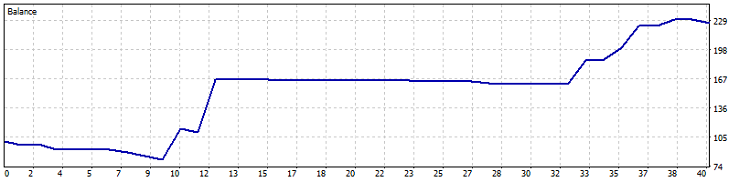
Fig. 5. Testing results GBPUSD H4 (2017.01.01 - 2017.11.12)
Symbol: NZDUSD
| Parameters: | ||
|---|---|---|
| percent_min_enter=31.6 | magic_number=65758473787389 | stochastic_up_level=60 |
| percent_max_enter=88 | order_volume=0.01 | stochastic_down_level=30 |
| percent_for_tp=45 | order_deviation=100 | ma_red_period=24 |
| percent_for_sl=95 | stochastic_k=10 | ma_red_shift=5 |
| trailing_sl=550 | stochastic_d=2 | ma_blue_period=4 |
| trailing_profit=100 | stochastic_slowing=1 | ma_blue_shift=5 |
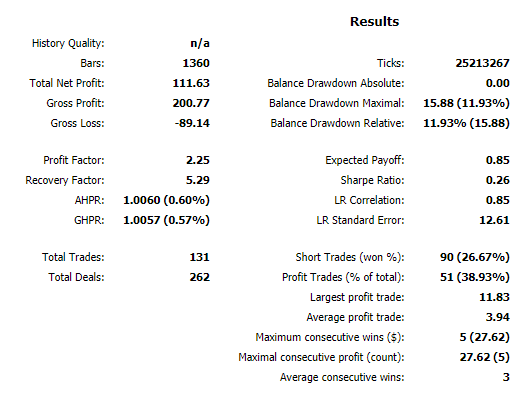
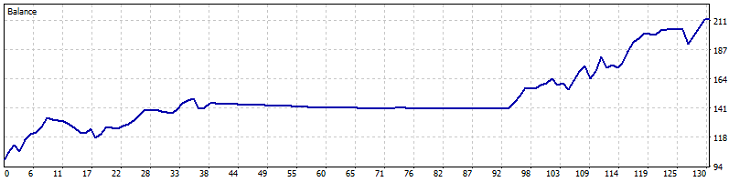
Fig. 6. Testing results NZDUSD H4 (2017.01.01 - 2017.11.12)
Symbol: USDCAD
| Parameters: | ||
|---|---|---|
| percent_min_enter=23.6 | magic_number=65758473787389 | stochastic_up_level=60 |
| percent_max_enter=73 | order_volume=0.01 | stochastic_down_level=20 |
| percent_for_tp=315 | order_deviation=100 | ma_red_period=25 |
| percent_for_sl=69 | stochastic_k=10 | ma_red_shift=5 |
| trailing_sl=325 | stochastic_d=1 | ma_blue_period=3 |
| trailing_profit=10 | stochastic_slowing=1 | ma_blue_shift=5 |
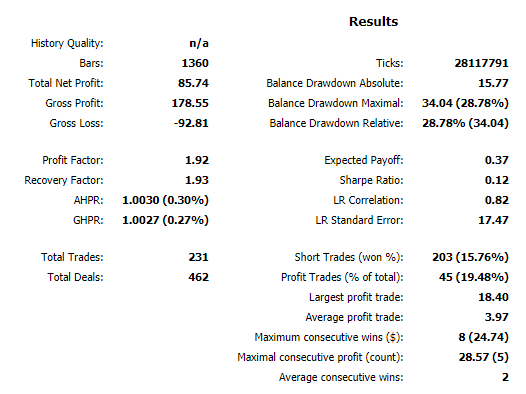
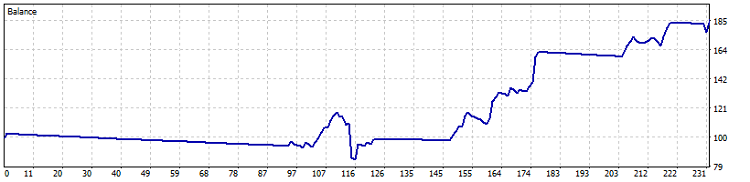
Fig. 7. Testing results USDCAD H4 (2017.01.01 - 2017.11.12)
Symbol: USDCHF
| Parameters: | ||
|---|---|---|
| percent_min_enter=49.6 | magic_number=65758473787389 | stochastic_up_level=70 |
| percent_max_enter=69 | order_volume=0.01 | stochastic_down_level=40 |
| percent_for_tp=55 | order_deviation=100 | ma_red_period=20 |
| percent_for_sl=98 | stochastic_k=13 | ma_red_shift=5 |
| trailing_sl=900 | stochastic_d=6 | ma_blue_period=12 |
| trailing_profit=40 | stochastic_slowing=3 | ma_blue_shift=5 |
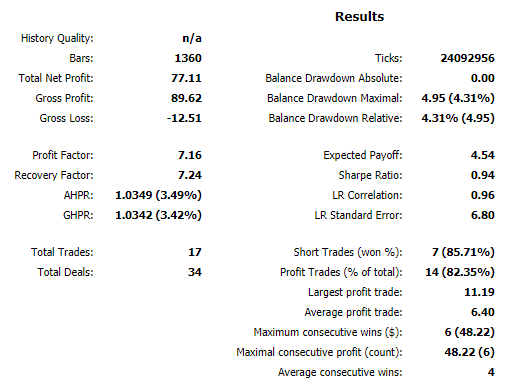
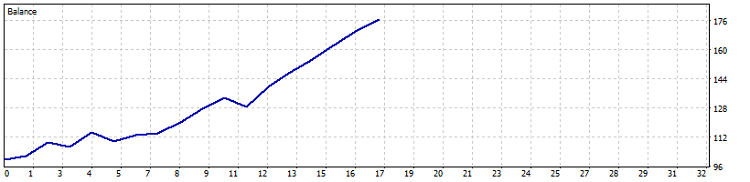
Fig. 8. Testing results USDCHF H4 (2017.01.01 - 2017.11.12)
Symbol: USDJPY
| Parameters: | ||
|---|---|---|
| percent_min_enter=23.6 | magic_number=65758473787389 | stochastic_up_level=60 |
| percent_max_enter=50 | order_volume=0.01 | stochastic_down_level=20 |
| percent_for_tp=295 | order_deviation=100 | ma_red_period=22 |
| percent_for_sl=53 | stochastic_k=3 | ma_red_shift=5 |
| trailing_sl=750 | stochastic_d=1 | ma_blue_period=5 |
| trailing_profit=10 | stochastic_slowing=1 | ma_blue_shift=5 |
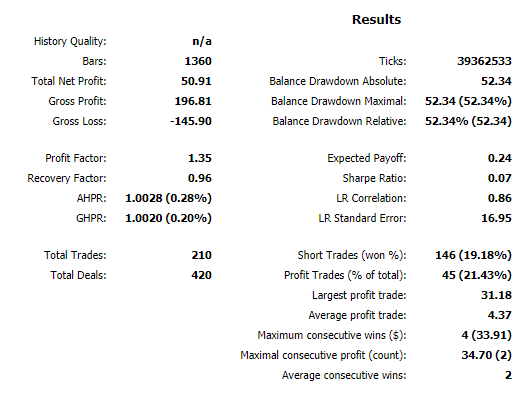
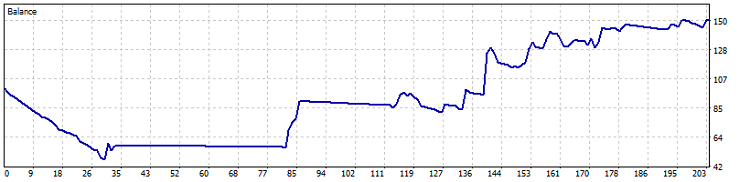
Fig.9. Testing results USDJPY H4 (2017.01.01 - 2017.11.12)
Symbol: AUDUSD
| Parameters: | ||
|---|---|---|
| percent_min_enter=23.6 | magic_number=65758473787389 | stochastic_up_level=80 |
| percent_max_enter=81 | order_volume=0.01 | stochastic_down_level=40 |
| percent_for_tp=305 | order_deviation=100 | ma_red_period=13 |
| percent_for_sl=69 | stochastic_k=3 | ma_red_shift=5 |
| trailing_sl=250 | stochastic_d=4 | ma_blue_period=1 |
| trailing_profit=20 | stochastic_slowing=4 | ma_blue_shift=5 |
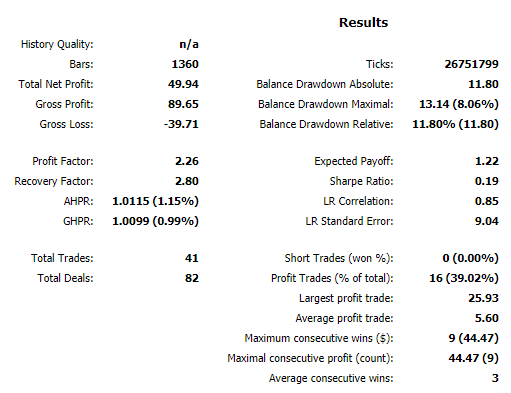
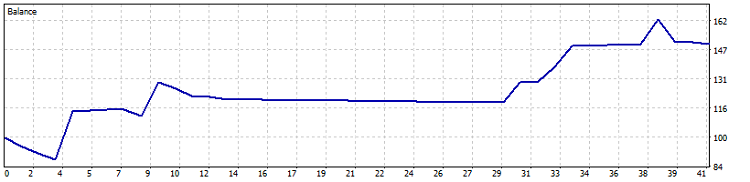
Fig.10. Testing results AUDUSD H4 (2017.01.01 - 2017.11.12)
Analysis of obtained results demonstrates some instability in entries. For all the symbols, except of USHCHF, almost horizontal straight line is observed.
The reason for this is as follows: in order to reduce balance drawdown the strategy implies placement of Stop Loss as close as possible. But in such a manner requirements as to signal quality are increased. Respectively, the higher signal quality, the less entries to the market occur, but at the same time the chart price increase becomes more stable (for example, on USDCHF symbol). However, in practice we plan to receive as much profit as possible. We should make sure that the Expert Advisor will steadily minimize losses in complex market situations.
Thus, at optimization and testing you should rely upon results with a big number of entries, showed on a long period of time.
Symbol: XAUUSD
After the Expert Advisor has been tested on all the popular currency pairs, it would be good to find out how it will behave in the commodity market. Therefore, I tested XAUUSD (futures for gold to USD) and here is what I got:
| Parameters: | ||
|---|---|---|
| percent_min_enter=23.6 | magic_number=65758473787389 | stochastic_up_level=90 |
| percent_max_enter=50 | order_volume=0.2 | stochastic_down_level=10 |
| percent_for_tp=255 | order_deviation=100 | ma_red_period=23 |
| percent_for_sl=80 | stochastic_k=3 | ma_red_shift=5 |
| trailing_sl=750 | stochastic_d=1 | ma_blue_period=6 |
| trailing_profit=10 | stochastic_slowing=1 | ma_blue_shift=5 |
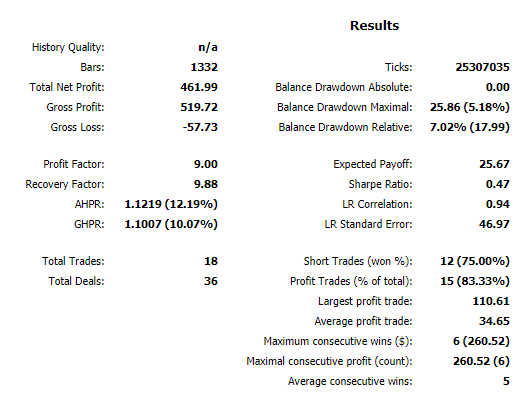
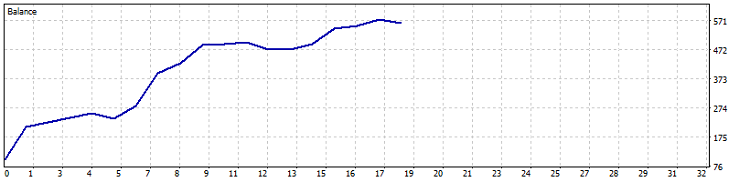
Fig.11. Testing results XAUUSD H4 (2017.01.01 - 2017.11.12)
Result on gold is interesting: Expert Advisor computed entries within the accuracy of 83.3% (profitable trades) and profit constituted 461%, with drawdown not more than 40%. It means that profit by 10 times prevailed over drawdown. It is somewhat interesting index, but due to a small number of deals (totally, there are 18 trades) we cannot make serious conclusions on the basis of performed testing.
Disadvantages of the trading strategy
Like any other, the Expert Advisor that we developed, has its disadvantages.
")
Fig.12. Expert Advisor on trend (NZDUSD H4)
Figure 12 demonstrates how Expert Advisor behaves in a certain channel. It all looks rather stable, but there is the main disadvantage which is obvious: early exit from trades.
")
Fig.13. Expert Advisor in flat (EURUSD H4)
And another “bottle neck”: Expert Advisor is not keen on working in flat. Figure 13 demonstrates that at such price movement profit is not large; also entries are calculated not very correctly.
Table of results
| Symbol | Trades | Profit trades (%) | Total net profit, $ | Max. Balance drawdown in % | Expected payoff, $ | PF | RF | Sharpe |
|---|---|---|---|---|---|---|---|---|
| AUDUSD | 41 | 16 (39.0%) | 49.94 | 11.8 | 1.22 | 2.26 | 2.80 | 0.19 |
| EURUSD | 52 | 28 (53.8%) | 124.79 | 17.7 | 2.40 | 2.23 | 4.01 | 0.28 |
| GBPUSD | 40 | 17 (42.5%) | 126.39 | 19.0 | 3.16 | 4.84 | 5.02 | 0.24 |
| NZDUSD | 131 | 51 (38.9%) | 111.63 | 11.9 | 0.85 | 2.25 | 5.29 | 0.26 |
| USDCAD | 231 | 45 (19.4%) | 85.71 | 28.7 | 0.37 | 1.92 | 1.93 | 0.12 |
| USDCHF | 17 | 14 (82.3%) | 77.11 | 4.3 | 4.54 | 7.16 | 7.24 | 0.94 |
| USDJPY | 210 | 45 (21.4%) | 50.88 | 52.3 | 0.24 | 1.35 | 0.96 | 0.07 |
| XAUUSD | 18 | 15 (83.3%) | 461.99 | 5.1 | 25.67 | 9.00 | 9.88 | 0.47 |
From the table, you can see that results are varying, although common tendencies between different pairs are visible. With the same settings some pairs gave profit (although moderate). Finding: in order to increase profit, you should thoroughly optimize Expert Advisor settings for each currency pair.
Conclusion
For another time we have made sure that the “old school” of traders created powerful foundation for a long time. DiNapoli level trading strategy has proved to be highly perspective; and further, I plan to continue its development. Todate, it has disadvantages: for example, at flat, Expert Advisor was rather bad. Besides, the price does not always reach COP line; and mostly, positions are effectively closed upon Stochastic.
Advantages of the developed Expert Advisor include sufficiently aggressive entries, this is particularly obvious at figure 13. Expert Advisor acts strictly according to algorithm in the situations when manually a trader, most likely, would not open a position. But, as a result, profit is achieved and drawdown is insignificant.
Attached files
| # | Name | Type | Description |
|---|---|---|---|
| 1 | Dinapoli_v1.01.mq5 | Expert Advisor | Expert Advisor realizing the strategy of using DiNapoli levels and auxiliary indicators |
| 2 | AUDUSDH4.set | Expert Advisor settings file | Settings used at testing and optimization for symbol AUDUSD Н4 |
| 3 | EURUSDH4.set | Expert Advisor settings file | Settings used at testing and optimization for symbol EURUSD H4 |
| 4 | GBPUSDH4.set | Expert Advisor settings file | Settings used at testing and optimization for symbol GBPUSD H4 |
| 5 | NZDUSDH4.set | Expert Advisor settings file | Settings used at testing and optimization for symbol NZDUSD H4 |
| 6 | USDCADH4.set | Expert Advisor settings file | Settings used at testing and optimization for symbol USDCAD H4 |
| 7 | USDCHFH4.set | Expert Advisor settings file | Settings used at testing and optimization for symbol USDCHF H4 |
| 8 | USDJPYH4.set | Expert Advisor settings file | Settings used at testing and optimization for symbol USDJPY H4 |
| 9 | XAUUSDH4.set | Expert Advisor settings file | Settings used at testing and optimization for symbol XAUUSD H4 |