Developing stock indicators featuring volume control through the example of the delta indicator
Tapochun | 20 September, 2018
Contents
- Introduction
- Target readers
- Preparation. Selecting the server
- Methods of obtaining tick history. MqlTick format
- First launch. Calculation of history
- Function for calculating history by formed bars
- Function of calculating the current candle
- Calculation in real time
- Features of working in the strategy tester
- Conclusion
- Files used in the article
Introduction
As we know, MetaTrader 5 broadcasts two types of volumes:
- tick volume, i.e. number of ticks (changes in quote data) that arrived during the bar formation;
- real volume, i.e. number of trades arrived during the bar formation.
In the terminal, the real volume is indicated simply as Volume. It will be of interest to us. Since the terminal features tick history, as well as time and sales, it is now possible to develop stock indicators. They allow us to see what is happening "behind the scenes", i.e. what the real volume consists of: volume and frequency of executed trades, as well as the correlation of sellers and buyers at a certain time period. This means we can now expand the volume into components. These data can significantly improve the accuracy of our trading forecasts. At the same time, it is more difficult to develop such an indicator as compared to a usual one. This article thoroughly describes the sequence and subtleties of developing stock indicators, features of their work and testing. As an example, we will develop the delta (difference) indicator of buy and sell volumes that form the real volume. As the indicator is developed, the rules of working with the tick flow are to be described as well.
However, we should keep in mind that real volume is available on centralized (exchange) markets only. This means it is not available for Forex, because this is the over-the-counter market. We will consider real volumes through the example of Moscow Exchange's Derivatives Market (FORTS). If you are unfamiliar with FORTS, I highly recommend that you read the article about exchange pricing.
Target readers
Questions concerning tick data have become quite common on mql5.com Forum recently. This functionality is relatively new and is constantly improving. First of all, this article is meant for programmers who already know how to write indicators and willing to improve their skills of developing MetaTrader 5 applications. The article will also be of interest to traders who want to master the stock market and are interested in the analysis involving the delta and/or similar tick indicators.
1. Preparation. Selecting the server
Paradoxically, the start of the indicator development should begin with a trading server selection. A necessary condition for the accurate operation of stock indicators: the broker's servers should be updated. Unfortunately, the broker's server versions are not broadcast, and it is not always possible to immediately understand whether the data is accurate.
Hopefully, the depth of market can help us with this issue. To open it, click the table icon near the instrument name in the upper left screen corner (if it is not displayed, check if the "Show quick trading buttons" (F8) option on the Show tab is checked) or press Alt+B. In the depth of market window, click the "Show Time and Sales" button. Also, make sure the minimum volume filter is not set by right-clicking the table.
If the server is not updated, it broadcasts the so-called "uncertain direction" deals to the market depth. Let's examine them in more details. Each transaction has an initiator: a buyer or a seller. This means that the transaction property (buy or sell) should be clearly indicated in it. If the deal's direction is not determined (marked as N/A in the depth of market), this affects the delta (difference between buy and sell volumes) construction accuracy calculated by the indicator. Updated and not updated market depths are provided below (Fig. 1):
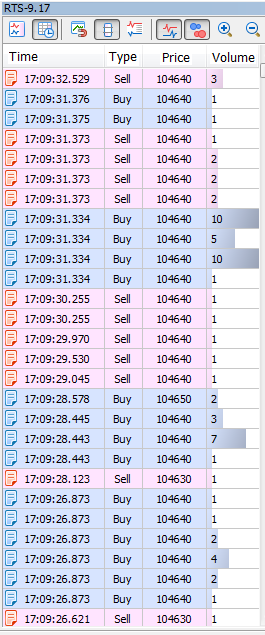
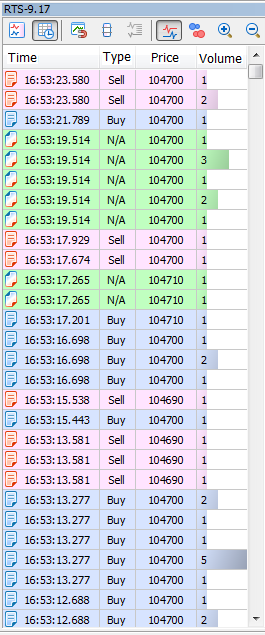
Fig. 1. Updated (left) and old (right) market depths
Rule 1. Check if the server is updated.
Also, I highly recommend choosing a low-ping server. The lower the ping, the faster the terminal is able to exchange data with the broker's server. If we look closely at Fig. 1, MetaTrader 5 boradcasts deals with a millisecond accuracy, so the lesser the ping, the faster you get and handle data on deals. Check ping to the current server (and change a server if necessary) in the lower right corner of the terminal:
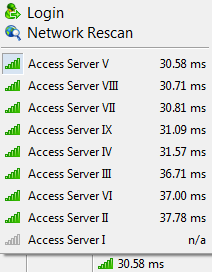
Fig. 2. Delay for a selected server is 30.58 milliseconds
Also, note that the client terminal should be updated to build 1881 or higher, since that build fixes all currently known errors concerning tick data.
2. Methods of obtaining tick history. MqlTick format
Suppose that we have selected a server that provides correct tick history. How do we get that history? MQL5 language features two functions for that:
- CopyTicks() is meant for obtaining tick history of a necessary size from a certain date;
- CopyTicksRange() is meant for obtaining tick history in a certain date range.
We will need both functions for our indicator. They will allow us to get ticks in MqlTick format. This structure stores data on time, prices, volume, as well as on what data have been changed exactly with the new tick. We can obtain tick history of three types. This type is defined by the flag:
- COPY_TICKS_INFO – return ticks having Bid and/or Ask price changes;
- COPY_TICKS_TRADE – return ticks with the Last price and volume changes;
- COPY_TICKS_ALL – return all ticks with any change.
We will need a flow of trading ticks (COPY_TICKS_TRADE) for our purposes. Find out more about tick types in the CopyTicks function description.
The MqlTick structure allows us to analyze the values of the following fields:
- volume - current last price volume. The tick price in our indicator is of no use, unlike the volume traded on that tick, which is very important and will be used;
- time_msc - last update time in milliseconds. We will use this parameter to determine the candle that tick belongs to and obtain the time of the next tick request;
- flags - tick flags, changed data IDs. We will use the flags to sort out buy (TICK_FLAG_BUY) and sell (TICK_FLAG_SELL) types.
3. First launch. Calculation of history
CTicks _ticks (Ticks_article.mqh file) is used as the main object for working with ticks in the indicator. It will be used to execute all operations with ticks.
The indicator operation will be divided into two main blocks: history calculation and real-time calculation
//+------------------------------------------------------------------+
//| Custom indicator iteration function                              |
//+------------------------------------------------------------------+
int OnCalculate(const int rates_total,
                const int prev_calculated,
                const datetime &time[],
                const double &open[],
                const double &high[],
                const double &low[],
                const double &close[],
                const long &tick_volume[],
                const long &volume[],
                const int &spread[])
  {
//--- Check for the first launch
   if(prev_calculated>0)                    // If not the first launch
     {
      // Block 2
     }
   else                                     // If the first launch
     {
      // Block 1
     }
//---
   return( rates_total );
  }
During the first launch of the terminal or when clicking the Refresh button in the terminal (Block 1), we should calculate the indicator on history. Initially, I planned to make a universal calculation function that would be used both for history and real-time calculations. However, I eventually decided to change the concept for more simplicity and accelerating the calculation speed. First, the history is calculated using completed bars (CalculateHistoryBars()). The current bar (CalculateCurrentBar()) is calculated afterwards. All these actions are described below:
//--- 1. Initialize the indicator buffers by initial values
BuffersInitialize(EMPTY_VALUE);
//--- 2. Reset the values of the repeated control parameters
_repeatedControl=false;
_controlNum=WRONG_VALUE;
//--- 3. Reset time of the bar the ticks are saved into (clicking the Refresh button)
_ticks.SetTime(0);
//--- 4. Set the moment of starting the download of ticks of the formed bars
_ticks.SetFrom(inpHistoryDate);
//--- 5. Check the moment the download starts
if(_ticks.GetFrom()<=0)                 // If no moment is set
   return(0);                           // Exit
//--- 6. Set the moment of ending the download of formed bars history
_ticks.SetTo( long( time[ rates_total-1 ]*MS_KOEF - 1 ) );
//--- 7. Download formed bars history
if(!_ticks.GetTicksRange())             // If unsuccessful
   return(0);                           // Exit with error
//--- 8. Calculate history on formed bars
CalculateHistoryBars( rates_total, time, volume );
//--- 9. Reset time of the bar the ticks are saved into
_ticks.SetTime(0);
//--- 10. Set the moment the ticks of the last bar start downloading
_ticks.SetFrom( long( time[ rates_total-1 ]*MS_KOEF ) );
//--- 11. Set the moment the ticks of the last bar finish downloading
_ticks.SetTo( long( TimeCurrent()*MS_KOEF ) );
//--- 12. Download the current bar history
if(!_ticks.GetTicksRange())             // If unsuccessful
   return(0);                           // Exit with error
//--- 13. Reset the moment copying ends
_ticks.SetTo( ULONG_MAX );
//--- 14. Remember the time of the obtained history's last tick
_ticks.SetFrom();
//--- 15. Current bar calculation
CalculateCurrentBar( true, rates_total, time, volume );
//--- 16. Set the number of ticks for subsequent copying in real time
_ticks.SetCount(4000);
The indicator code has extensive comments, so I will focus on the main points only.
Point 3. "Reset time of the bar the ticks are saved into". The object that works with ticks contains the opening time of the candle, the corresponding ticks are saved into. When clicking Refresh, the indicator is re-calculated in the terminal from the very beginning. In order for ticks to be correctly saved in the necessary candle, its time should be reset.
Point 4. "Set the moment of starting the download of ticks of the formed bars". Obtaining tick history can be quite a time-consuming operation. Therefore, you need to give a user the opportunity to specify the start date of its download. The inpHistoryDate parameter is meant for that. In case of a zero value, the history is downloaded from the beginning of the current day. In this prototype of the SetFrom(datetime) method, the time is passed in seconds. As already mentioned above, calculation of the indicator's formed bars is carried out first.
Point 5. "Check if the download start moment is correct". Checking the value received in point 4.
Point 6. "Set the moment of completing the download of the formed bars history". The moment of completing the download of the formed bars history is a millisecond prior to opening the current candle (rates_total-1). In this case, the moment of completing the download is of 'long' type. When passing the parameter to the method, we need to explicitly indicate that the 'long' type is being passed in case the class also features the method the parameter is passed to with the 'datetime' type. In case of the SetTo() method, the class does not overload it with the 'datetime' type argument. Anyway, I recommend passing the 'long' type parameter explicitly to be on the safe side.
Point 7. "Download history by formed bars". The history is obtained using the GetTicksRange() function, which is a wrapper for the CopyTicksRange() function with the addition of checks for possible errors. If errors occur during the download, the entire history is repeatedly requested at the next tick. The Ticks_article.mqh file attached below contains more details concerning this function, as well as other functions for working with ticks.
Point 8. "Calculating history on formed bars". Calculation on formed bars will be described in detail in the appropriate article section.
Points 9-12. Calculation by bars complete. Now, it is time to calculate the current candle. The copying range is set and the current candle ticks are obtained here.
Point 13. "Reset the moment the copying ends". Further on, we will continue obtaining ticks using the _ticks object, although we will do that since the arrival of the last tick up to the end of the entire available history, rather than from one moment to another when downloading history. Therefore, it is better to reset the moment the copying ends — we will not need it any more when calculating in real time.
Point 14. "Remember the time of the obtained history's last tick". We will need the time of the obtained history's last tick later as the moment of starting data copying in real time.
Point 15. "Current bar calculation". The calculation of the current bar will also be described in a separate part of the article and will have important differences from the method of calculating the formed bars.
Point 16. "Set the number of ticks for subsequent copying in real time". Previously, we obtained ticks using the CopyTicksRange() function wrapped in the GetTicksRange() method. In real time, however, we will use the CopyTicks() function wrapped in the GetTicks() method. The SetCount() method sets the number of ticks for subsequent requests. We have selected 4000 because the terminal stores 4096 ticks for each symbol for fast access. Requests for these ticks are executed at the highest speed. Setting the value does not affect the ticks obtaining speed (~1 ms), be it 100 or 4000.
Let's have a closer look at the calculation functions.
4. Function for calculating history by formed bars
The function itself looks as follows:
//+------------------------------------------------------------------+
//| Function for calculating formed history bars                     |
//+------------------------------------------------------------------+
bool CalculateHistoryBars(const int rates_total,    // Number of calculated bars
                          const datetime& time[],   // Array of bars opening times
                          const long& volume[]      // Array of real volume values
                          )
  {
//--- Total volumes
   long sumVolBuy=0;
   long sumVolSell=0;
//--- Bar index for writing to the buffer
   int bNum=WRONG_VALUE;
//--- Get the number of ticks in the array
   const int limit=_ticks.GetSize();
//--- Loop by all ticks
   for(int i=0; i<limit && !IsStopped(); i++)
     {
      //--- Define the candle ticks are written to
      if(_ticks.IsNewCandle(i))                         // If the next candle starts forming
        {
         //--- Check if the index of formed (complete) candle is saved
         if(bNum>=0) // If saved
           {
            //--- Check if the volume values are saved
            if(sumVolBuy>0 || sumVolSell>0) // If all the parameters are saved
              {
               //--- Monitor the total candle volume
               VolumeControl(false,bNum,volume[bNum],time[bNum],sumVolBuy,sumVolSell);
              }
            //--- Add the values to the buffers
            DisplayValues(bNum,sumVolBuy,sumVolSell,__LINE__);
           }
         //--- Reset the previous candle's volumes
         sumVolBuy=0;
         sumVolSell=0;
         //--- Set the candle index according to its opening time
         bNum=_ticks.GetNumByTime(false);
         //--- Check if the index is correct
         if(bNum>=rates_total || bNum<0) // If the index is incorrect
           {
            //--- Exit without calculating history
            return( false );
           }
        }
      //--- Add a volume on a tick for the necessary component
      AddVolToSum(_ticks.GetTick(i),sumVolBuy,sumVolSell);
     }
//--- Check if the volumes values of the last formed candle are saved
   if(sumVolBuy>0 || sumVolSell>0) // If all the parameters are saved
     {
      //--- Track the total candle volume
      VolumeControl(false,bNum,volume[bNum],time[bNum],sumVolBuy,sumVolSell);
     }
//--- Enter the values to the buffers
   DisplayValues(bNum,sumVolBuy,sumVolSell,__LINE__);
//--- Calculation complete
   return( true );
  }
The idea behind this function is to sort obtained ticks by formed candles of the current timeframe, get the difference of buy and sell volumes of each candle and enter the obtained volume and delta values to the indicator buffers.
As mentioned earlier, it was originally planned to make one common function for history and real time calculations. However, by adding the function for calculating history on the formed bars, we pursue several goals:
- Simplifying the algorithm. Since the bars are already formed, no new ticks will be added to them. This means we can remove excessive checks described below, which are necessary for real-time calculations;
- Accelerating the algorithm. In addition to the fact that there will be no extra checks, you will also not need to update the values in the buffers after each tick. Writing to the buffers is to be performed only when handling the first tick of a new candle;
- Adding variability. The real-time calculation is not needed constantly. For example, if the indicator is used in the EA by formed bars, it is sufficient to perform calculations only once per candle using this function alone.
The full description of the calculation algorithm and working with tick history are provided below.
5. Function of calculating the current candle
Pay the utmost attention to the CalculateCurrentBar() function in the indicator code.
//+------------------------------------------------------------------+
//| Current candle calculation function                              |
//+------------------------------------------------------------------+
void CalculateCurrentBar(const bool firstLaunch,   // Flag of the function first launch
                         const int rates_total,    // Number of calculated flags
                         const datetime& time[],   // Array of bar open times
                         const long& volume[]      // Array of real volume values
                         )
  {
//--- Total volumes
   static long sumVolBuy=0;
   static long sumVolSell=0;
//--- Bar index for writing to buffer
   static int bNum=WRONG_VALUE;
//--- Check the first launch flag
   if(firstLaunch)                                 // In case of the first launch
     {
      //--- Reset static parameters
      sumVolBuy=0;
      sumVolSell=0;
      bNum=WRONG_VALUE;
     }
//--- Get the index of the penultimate tick in the array
   const int limit=_ticks.GetSize()-1;
//--- 'limit' tick time
   const ulong limitTime=_ticks.GetFrom();
//--- Loop on all ticks (except the last one)
   for(int i=0; i<limit && !IsStopped(); i++)
     {
      //--- 1. Compare the i th tick time with the limit tick one (check the loop completion)
      if( _ticks.GetTickTimeMs( i ) == limitTime ) // If the tick time is equal to the limit tick one
         return;                                   // Exit
      //--- 2. Check if the candle not present on the chart starts forming
      if(_ticks.GetTickTime(i)>=time[rates_total-1]+PeriodSeconds())                // If the candle started forming
        {
         //--- Check if the log is maintained
         if(inpLog)
            Print(__FUNCTION__,": ATTENTION! Future tick ["+GetMsToStringTime(_ticks.GetTickTimeMs(i))+"]. Tick time "+TimeToString(_ticks.GetTickTime(i))+
                  ", time[ rates_total-1 ]+PerSec() = "+TimeToString(time[rates_total-1]+PeriodSeconds()));
         //--- 2.1. Set (correct) the time of the next tick request
         _ticks.SetFrom(_ticks.GetTickTimeMs(i));
         //--- Exit
         return;
        }
      //--- 3. Define the candle the ticks are saved to
      if(_ticks.IsNewCandle(i))                    // If the next candle starts forming
        {
         //--- 3.1. Check if the formed (complete) candle index is saved
         if(bNum>=0)                               // If the index is saved
           {
            //--- Check if the volume values are saved
            if(sumVolBuy>0 || sumVolSell>0)        // If all parameters are saved
              {
               //--- 3.1.1. Manage the total candle volume
               VolumeControl(true,bNum,volume[bNum],time[bNum],sumVolBuy,sumVolSell);
              }
           }
         //--- 3.2. Reset the previous candle volumes
         sumVolBuy=0;
         sumVolSell=0;
         //--- 3.3. Remember the current candle index
         bNum=rates_total-1;
        }
      //--- 4. Add the volume on a tick to the necessary component
      AddVolToSum(_ticks.GetTick(i),sumVolBuy,sumVolSell);
      //--- 5. Enter the values into the buffers
      DisplayValues(bNum,sumVolBuy,sumVolSell,__LINE__);
     }
  }
It is similar to the previous function CalculateHistoryBars(), but it has its own features. Let's examine them in more detail. The function prototype is provided below:
//+------------------------------------------------------------------+
//| Current candle calculation function                              |
//+------------------------------------------------------------------+
void CalculateCurrentBar(const bool firstLaunch,   // Function first launch flag
                         const int rates_total,    // Number of calculated bars
                         const datetime& time[],   // Array of bar open times
                         const long& volume[]      // Array of real volume values
                         )
Note that CalculateCurrentBar() is to be used in two cases: when calculating the current candle history during the first launch and performing calculations in real time. The firstLaunch flag allows selecting the calculation mode. The only difference between the modes is that the static variables containing the sums of buys and sells, as well as the candle index in the buffers containing these sums and their difference (delta) are reset to zero during the first launch. Once again, I would like to emphasize that only real volumes are used in the indicator!
//--- Total volumes
   static long sumVolBuy=0;
   static long sumVolSell=0;
//--- Bar index for writing to the buffer
   static int bNum=WRONG_VALUE;
//--- Check the first launch flag
   if(firstLaunch)                                 // In case of the first launch
     {
      //--- Reset the volume sums
      sumVolBuy=0;
      sumVolSell=0;
      //--- Reset the candle index
      bNum=WRONG_VALUE;
     }
After declaring static variables, the array's last tick index and time are obtained:
//--- Get the array last tick index
   const int limit=_ticks.GetSize()-1;
//--- 'limit' tick time
   const ulong limitTime=_ticks.GetFrom();
The index serves as a delimiter for the ticks iteration loop. Let's establish the condition that the last tick and ticks having the time matching the last tick's one are not included in the calculations. Why? Trading ticks may arrive in bundles in case a single market order is implemented in several limit orders from different counterparties. A bundle of ticks (deals) consists of deals performed at the same time (with the millisecond accuracy) and having the same type (buy or sell) (Fig. 3). Note that multiple tick bundles can be displayed in the terminal as having arrived within the same millisecond, since the exchange broadcasts deals up to nanoseconds. To see it for yourself, launch the test_getTicksRange script attached below.
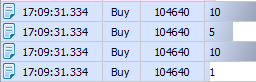
Fig. 3. Tick bundle (market buy order initiated 4 deals consisting of 26 lots)
To take the volume into account correctly, one tick bundle should be calculated once only when it is fully passed to the terminal, i.e. when the deal concluded at the subsequent moment of time (Fig. 4) becomes available.
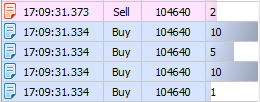
Fig. 4. Performing the deal at .373, calculating the bundle at .334
We cannot be sure that the bundle has fully arrived into the terminal, until the deal following the bundle becomes available because the bundle may arrive in parts. I will not go into more details on this here, just take my word for it. Thus, we can define the rule 2:
Rule 2. A tick bundle should be calculated only after receiving the tick following that bundle.
We have saved the time of the last obtained tick in p. 13 of the first launch algorithm. Now, let's use it by writing limitTime to the variable.
Now, let's move directly to the tick calculation loop:
//--- 1. Compare the i th tick time with the limit tick one (check the loop completion)
      if( _ticks.GetTickTimeMs( i ) == limitTime ) // If the tick time is equal to the limit tick one
         return;                                   // Exit
Point 1. "Compare the tick time with the last tick's one". As mentioned above, the last tick is not considered in the calculations, since the calculation is performed only by formed tick bundles. But we also know that the last tick bundle may be copied partially. This means, we should exclude all ticks (if there are any) of the bundle from the calculation.
//--- 2. Check if the candle not present on the chart starts forming
      if(_ticks.GetTickTime(i)>=time[rates_total-1]+PeriodSeconds())
Point 2. "Check if the candle not present on the chart starts forming". This may sound a bit strange. How can the candle not present on the chart be formed? To answer this question, you need to understand the peculiarities of processing/receiving tick data in the terminal. These peculiarities were clarified as a result of extensive communication with the developers via the Service Desk. I will describe them here:
Terminal ticks are collected in a separate flow, regardless of the indicator and EA performance. Candles are built in another flow — the indicator execution one. These flows are not synchronized with each other. After a tick is applied to the candle, the indicator is calculated. Not a single tick is missed. This means that by calling the CopyTicks() function, you can get more recent tick data as compared to the data applied to bars.
In real practice, this means the following. When calculating the rates_total-1 candle, the indicator can get the ticks of the next candle, which is yet incomplete (a tick has not been applied to it yet). To avoid that situation (as well as the array out of range error), we need to add this check.
Rule 3. Note that ticks that have not yet appeared on the candlestick chart may be obtained.
In case a "future" tick (without the appropriate formed candle) is detected, we should re-write the time, at which the next tick request is to occur (point 2.1). Besides, we should immediately exit the loop and the function, while waiting for a new tick and formation of a new candle on the chart:
//--- 2. Check if the candle not present on the chart starts forming
      if(_ticks.GetTickTime(i)>=time[rates_total-1]+PeriodSeconds())                // If the candle started forming
        {
         //--- 2.1. Set (correct) the time of the next tick request
         _ticks.SetFrom(_ticks.GetTickTimeMs(i));
         //--- Exit
         return;
        }
The following algorithm almost completely matches the CalculateHistoryBars() function. Let's consider it in more detail.
//--- 3. Define the candle the ticks are saved to
      if(_ticks.IsNewCandle(i))
Point 3. Define the candle the ticks are saved to. Here we compare the i th time of the tick and open time of the candle the ticks are saved to. If the time of the i th tick goes beyond the candle borders, the candle open time is changed and the algorithm for preparing the following candle for analysis is triggered:
//--- 3. Define the candle the ticks are saved to
      if(_ticks.IsNewCandle(i))                    // If the next candle starts forming
        {
         //--- 3.1. Check if the formed (complete) candle index is saved
         if(bNum>=0)                               // If the index is saved
           {
            //--- Check if the volume values are saved
            if(sumVolBuy>0 || sumVolSell>0)        // If all parameters are saved
              {
               //--- 3.1.1. Manage the total candle volume
               VolumeControl(true,bNum,volume[bNum],time[bNum],sumVolBuy,sumVolSell);
              }
           }
         //--- 3.2. Reset the previous candle volumes
         sumVolBuy=0;
         sumVolSell=0;
         //--- 3.3. Remember the current candle index
         bNum=rates_total-1;
        }
Point 3.1. Check if the formed candle index is saved. In the history calculation mode (first launch), this check prevents access to the time and volume arrays under the incorrect index (-1). Next, we check if deals were performed on the candle. In there were no deals, the volume control is not required.
Point 3.1.1. Total volume control. During the VolumeControl() procedure, Buy and Sell volumes accumulated by the indicator per candle are summed up and compared by the "reference" volume, i.e. real volume passed directly from an exchange (by the value from the Volume[] array of the formed candle). If the exchange volume matches the accumulated one, proceed to further calculations. But what if it does not? You may wonder how it can be. The total volume is the same. The only difference is that we calculated one in our indicator, while another one arrived from the exchange. The volumes should definitely coincide!
Well, you are right. They should. This rule should be applied to all candles. What exactly our indicator does:
- the indicator receives all ticks;
- zero tick time is used to define the calculated candle time (for example, on М1, the zero tick tine is 10:00:00.123, therefore, the opening time of the candle is 10:00, and the delta is calculated for it);
- checks the time of each tick;
- adds the volume of each tick either to the buys or sells volume;
- wait till the tick exits the calculated candle borders (has the time exceeding 10:00:59.999) to display the delta of the 10:00 candle;
- the time of the tick going beyond the calculated candle (for example, 10:01:00.46) is used to open a new candle (10:01). The next delta is calculated for that candle. Thus, the entire process is repeated.
It seems pretty easy so far. However, in real time (for the rates_total-1 candle), we should remember about the aforementioned "future" ticks (rule 3) appearing when the new candle's tick arrives, while the chart candle is not formed yet. This feature also affects the volume control! When handling the tick, the indicator still contains the obsolete volume value in the volume[] array (the value still remains unchanged). This means, we are unable to compare the volume gathered by the indicator with the volume[] array one correctly. In actual practice, the volume[rates_total-1] reference volume sometimes does not match the (sumVolBuy+sumVolSell) volume sum collected by the indicator. The VolumeControl() procedure offers two solutions:
- Re-calculating the candle volume and comparing it with the reference value obtained via the CopyRealVolume() function;
- If the first option does not solve the issue, volume control flag is set when a new candle is formed.
Thus, the first method attempts to solve the control problem before the formation of the new candle, while the second one is guaranteed to solve the issue after its formation.
Point 3.2. "Reset the previous candle volumes". After the new candle is formed, reset the volume counters to zero.
Point 3.3. "Remember the current candle index". Yet another advantage of separating calculation functions into the function for calculating by formed bars and the one for the current candle calculation. The current candle index is always equal to rates_total-1.
//--- 4. Add the volume on a tick to the necessary component
      AddVolToSum(_ticks.GetTick(i),sumVolBuy,sumVolSell);
Point 4. Add the tick volume to the total one. First, use the flag of the analyzed tick to find out what data have changed:
//+------------------------------------------------------------------+
//| Add the tick volume to the total one                             |
//+------------------------------------------------------------------+
void AddVolToSum(const MqlTick &tick,        // Checked tick parameters
                 long& sumVolBuy,            // Total buy volume (out)
                 long& sumVolSell            // Total sell volume (out)
                )
  {
//--- Check the tick direction
   if(( tick.flags&TICK_FLAG_BUY)==TICK_FLAG_BUY && ( tick.flags&TICK_FLAG_SELL)==TICK_FLAG_SELL) // If the tick is of both directions
        Print(__FUNCTION__,": ERROR! Tick '"+GetMsToStringTime(tick.time_msc)+"' is of unknown direction!");
   else if(( tick.flags&TICK_FLAG_BUY)==TICK_FLAG_BUY)   // In case of a buy tick
        sumVolBuy+=(long)tick.volume;
   else if(( tick.flags&TICK_FLAG_SELL)==TICK_FLAG_SELL) // In case of a sell tick
        sumVolSell+=(long)tick.volume;
   else                                                  // If it is not a trading tick
        Print(__FUNCTION__,": ERROR! Tick '"+GetMsToStringTime(tick.time_msc)+"' is not a trading one!");
  }
Here again I want to focus on the Rule 1. If the work takes place on a server that broadcast transactions of an unknown direction, it is impossible to determine who initiated the transaction - the buyer or the seller. Therefore, the journal will continue the corresponding errors. If the initiator is determined, the volume is added to the total volume of buys or sells. If the flag does not contain data about the initiator of a transaction, the error is also received.
//--- 5. Enter the values to the buffers
      DisplayValues(bNum,sumVolBuy,sumVolSell,__LINE__);
Point 5. Add the values to the buffers. The DisplayValues() procedure tracks the index of the indicator buffers (we pass the call string index to the function to achieve that), delta calculation and writing the delta, as well as buy and sell volumes, to the buffers.
6. Calculation in real time
Let's describe the calculation block algorithm in real time:
//--- 1. Check the new bar formation
if(rates_total>prev_calculated) // In case of a new bar
  {
   //--- Initialize rates_total-1 buffer indices by empty values
   BuffersIndexInitialize(rates_total-1,EMPTY_VALUE);
   //--- 2. Check if the volume on the rates_total-2 bar should be tracked
   if(_repeatedControl && _controlNum==rates_total-2)
     {
      //--- 3. Re-check
      RepeatedControl(false,_controlNum,time[_controlNum]);
     }
   //--- 4. Reset the re-check values
   _repeatedControl=false;
   _controlNum=WRONG_VALUE;
  }
//--- 5. Download new ticks
if(!_ticks.GetTicks() )               // If unsuccessful
   return( prev_calculated );         // Exit with an error
//--- 6. Remember the time of the obtained history's last tick
_ticks.SetFrom();
//--- 7. Real time calculation
CalculateCurrentBar(false,rates_total,time,volume);
Point 1. Check the new bar formation. This check is very important. As we found out in 2.1.1, if the check is not passed in the main calculation function's volume control procedure (real time calculation), it should be passed at the time of a new bar formation. This is exactly the right moment!
Point 2. Check if the volume on the rates_total-2 bar should be tracked. If the repeated control flag is checked and is to be conducted on the newly formed rates_total-2 candle, perform a re-check (p. 3).
Point 3. Performing a re-check. As already mentioned, during the re-check, all ticks per candle are received. Besides, we define buy and sell volumes, calculate the delta and compare the sum of the volumes with a reference value.
Point 5. Download new ticks. Get ticks since the arrival of the last tick during the previous indicator launch. When calculating in real time, we get ticks using the GetTicks() function applying the CopyTicks() function.
Point 6. Remember the last tick time. This is the time of the last tick obtained in p. 5 or after the history calculation. The tick history will be requested from that moment during the next indicator launch.
Point 7. Calculation in real time. As mentioned earlier, the CalculateCurrentBar() procedure is used both during the history and real-time calculations. The firstLaunch flag is responsible for that. In this case, it is set to 'false'.
7. Features of working in the strategy tester
When using the strategy tester, we should always keep in mind that this is a separate program with its own functionality. Even if the tester can do the same thing as the terminal, it does not mean that it will do it the same way as the terminal. A similar situation (at this stage of the tester development) occurs with programs that use the tick data. Despite the fact that the indicator is calculated correctly (the volume control is successful), the indicator in the tester is calculated somewhat differently. The reason again lies in the handling of tick bundles.
Unlike the terminal, where multiple transactions may occur within a single tick (i.e., we may get a tick bundle), in the tester, each tick will be received separately even if multiple ticks of a single bundle arrive one after another. You can see this for yourself by launching the test_tickPack test indicator from the application. The approximate result is as follows:
2018.07.13 10:00:00   OnCalculate: Received ticks 4. [0] = 2018.07.13 10:00:00.564, [3] = 2018.07.13 10:00:00.571 FLAG_BUY
2018.07.13 10:00:00   OnCalculate: Received ticks 2. [0] = 2018.07.13 10:00:00.571, [1] = 2018.07.13 10:00:00.571 FLAG_BUY
2018.07.13 10:00:00   OnCalculate: Received ticks 3. [0] = 2018.07.13 10:00:00.571, [2] = 2018.07.13 10:00:00.571 FLAG_BUY
2018.07.13 10:00:00   OnCalculate: Received ticks 4. [0] = 2018.07.13 10:00:00.571, [3] = 2018.07.13 10:00:00.571 FLAG_BUY
2018.07.13 10:00:00   OnCalculate: Received ticks 5. [0] = 2018.07.13 10:00:00.571, [4] = 2018.07.13 10:00:00.571 FLAG_BUY
2018.07.13 10:00:00   OnCalculate: Received ticks 6. [0] = 2018.07.13 10:00:00.571, [5] = 2018.07.13 10:00:00.571 FLAG_BUY
2018.07.13 10:00:00   OnCalculate: Received ticks 7. [0] = 2018.07.13 10:00:00.571, [6] = 2018.07.13 10:00:00.572 FLAG_BUY
You can try this on your own. Make sure to set the "Every tick based on real ticks" mode by pressing F12 successively. Ticks will be added strictly one at a time! In reality though, this bundle could get into the terminal in parts, or in one piece, but most probably not in "one at a time" mode. This is neither good, nor bad. Just keep this feature in mind.
Conclusion
In this article, I have described some subtle aspects and most common difficulties many users, including me, encounter when developing tick indicators. I hope, my experience will be of use for the community paving way to more applications using tick data and giving impetus to the further development of the MetaTrader 5 platform. If you know some other peculiarities of working with trading ticks, or if you detected an inaccuracy, feel free to contact me. I will be glad to discuss this topic.
The final result is presented below. A blue bar shows the dominance of buyers on a certain candle, while a red one — the dominance of sellers.
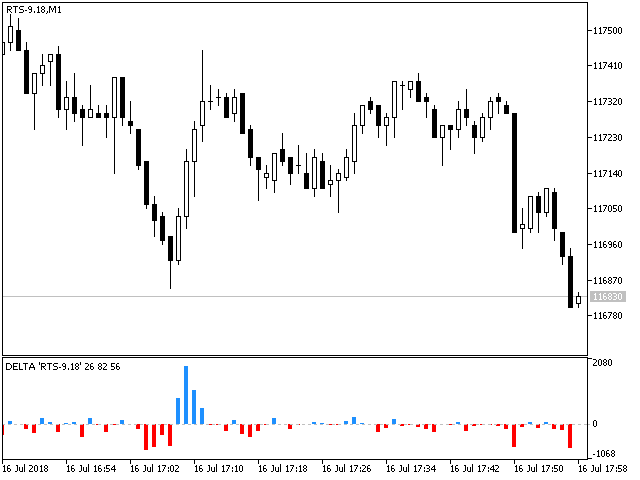
Fig. 5. Delta indicator on RTS-6.18
The estimation of real volumes opens up new horizons for the stock market analysis allowing for better understanding of the price movement. This indicator is only a small part of what can be developed based on the tick data analysis. Creating stock indicators based on real volumes is quite a feasible task. I hope, this article will help you in creating such indicators and improving your trade.
If you are interested in the indicator itself, its improved version will be published in the Products section of my profile soon. Good luck in trading!
Files used in the article
| File name | Type | Description |
|---|---|---|
| 1. Delta_article.mq5 | Indicator file | Implementation of the delta indicator |
| 2. Ticks_article.mqh | Class file | Auxiliary class for working with tick data |
| 3. test_getTicksRange.mq5 | Script file | Test script for checking the possibility of receiving several tick bundles in one millisecond |
| 4. test_tickPack.mq5 | Indicator file | Test indicator for checking if ticks are received in the tester |