A New Approach to Interpreting Classic and Hidden Divergence
Alexander Lasygin | 10 November, 2017
Introduction
Traders often use classic technical analysis methods. However, there are many different ways and approaches, which can also be useful. In this
article, I suggest a non-standard method for searching and interpreting divergences. Based on this approach, we will create a trading
strategy.
Defining Divergence/Convergence
The movement in the market continues as long as market participants have the will and the money to trade. So, sooner or later a moment comes when all participants are already in the market, and there is no one left to move the price. Such situations may happen quite often in the market. Depending on the trend direction, they are called the overbought or oversold market state.
The overbought state may occur in financial, stock or futures markets. It shows that those who wanted to buy assets have already bought them, so there is no one to move the price up.
The oversold state is an opposite situation. It shows that those who wanted to sell assets have already sold them, so there is no one left to move the price down.
The overbought/oversold state does not appear from nowhere. It is known that the price forms a wave-like movement. Traders track price changes by comparing the price chart with charts of indicators or oscillators. When the indicator behavior is different from the price movement direction, convergence is formed in the bearish market, and divergence is formed in the bullish market.
Types of Divergence
Different researchers provide different classification of market divergence/convergence. We will use the one that divides the
divergence/convergence into classic and hidden.
Classic Divergence
The classic divergence can be identified by comparing updates of price High/Low with the same moments on the indicator chart. If the price chart has formed another new high or low, and the indicator chart has failed to, it is a sign of divergence. The market is overbought (oversold), so it is not advisable to open deals in the current trend direction.
The classic divergence is widely described in various resources. Depending on the divergence characteristics, it can be divided into three subclasses
- Class A. It occurs more often than other classes. When the asset price high/low is updated, the indicator starts reversing, which is an indication of divergence and possible upcoming reversal.
- Class B. It is similar to class A, except that the asset price cannot break an extremum, and forms the Double Top/Double
Bottom reversal pattern, while the indicator does not reach its extremum.
- Class C. The price high or low is updated, and the indicator forms the Double Top pattern (Double Bottom).
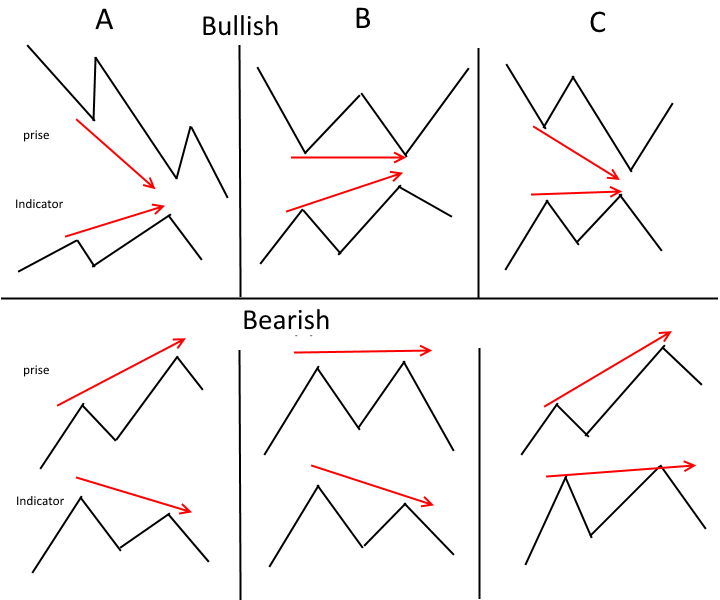
Divergence (convergence) can be repeated several times in a row, while combining different classes and thus creating a stronger reversal model. Each class should be analyzed separately in each case. We can't say unambiguously which one is the strongest or the weakest one. We will analyze reasons for that later.
Hidden Divergence
This type of divergence can also be divided into subclasses:
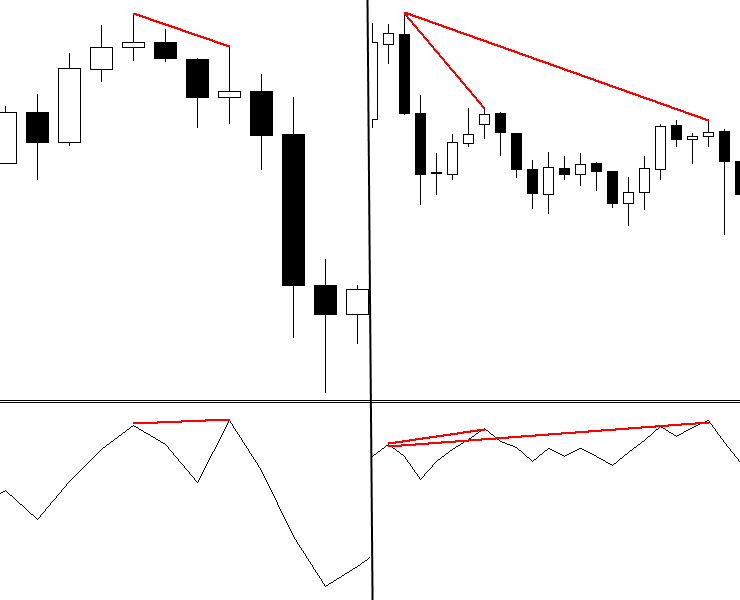
- Lowering price highs accompanied with growing oscillator highs show the confirmation of the downtrend.
- Growing price lows accompanied with falling oscillator lows show the confirmation of the uptrend.
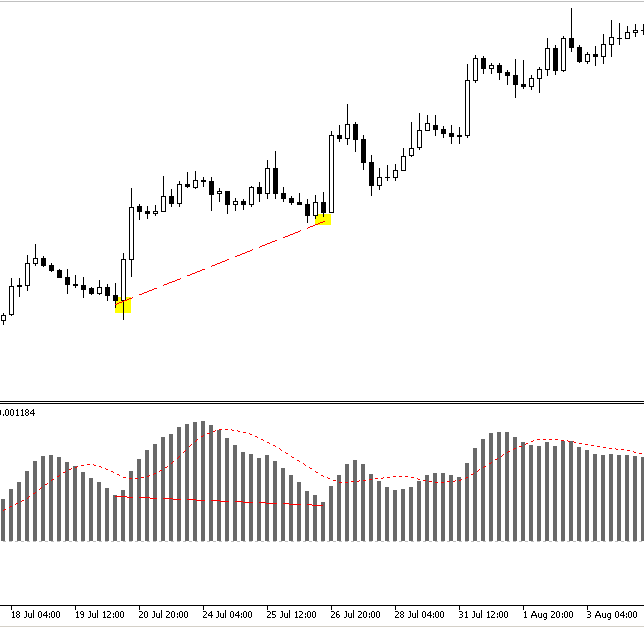
In the above figure, we can clearly see the upward market, but MACD has formed a new low, which is not confirmed by the price chart. This discrepancy hints at the presence of a hidden bullish divergence and indicates the strengthening of uptrend.
Indicators and Oscillators for Finding Divergences/Convergences. How It Works
What indicators can show divergence and convergence? A technical indicator should be able to determine the demand and supply levels, as well as to track the momentum. The following indicators can be used for the above purposes: oscillators, stochastic, RSI, CCI etc, and the trend indicator with the oscillator elements MACD. MACD can be interpreted as the divergence and convergence of moving averages. The indicator efficiently tracks discrepancies in the movement of the price and its momentum. Many traders make their convergence/divergence based decisions using MACD.
However, it would be wrong to recommend any of the above tools for working with divergence. Every trader should choose an indicator suiting their
specific trading strategies and working efficiently without overloading the price chart. So, the general recommendation is the
following: check the list of indicators, test them, select one of them and trade its signals not paying attention to other factors.
Also, divergence can be easily determined without indicators. First of all, you should understand the basics of the divergence formation.
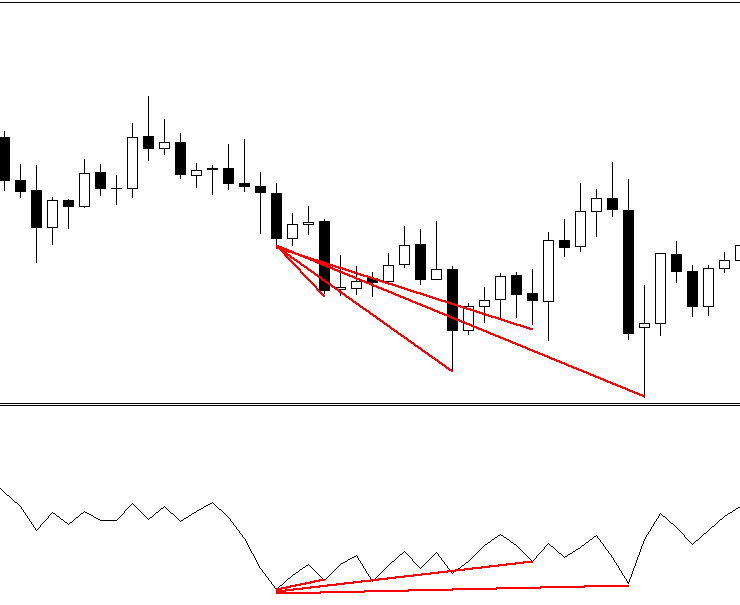
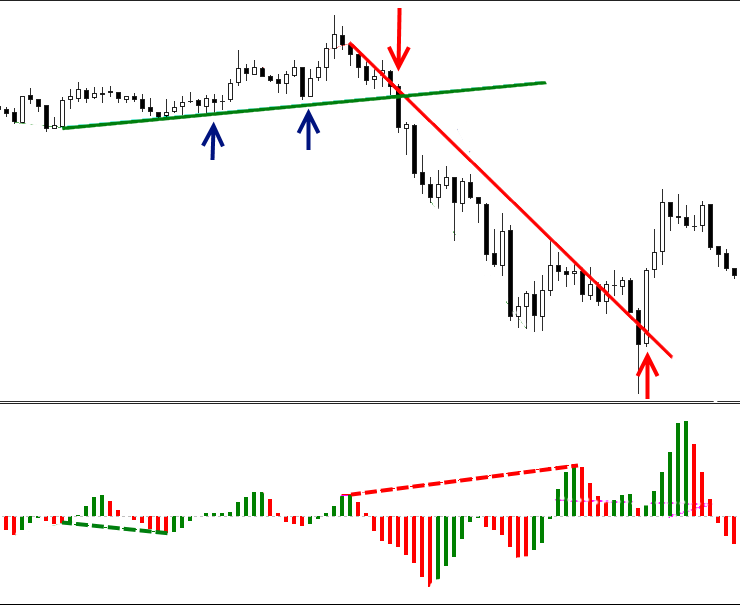
Momentum plays an important role in the formation of the divergence. We understand that the decrease in the movement amplitude after a strong impulse is a signal for divergence formation.
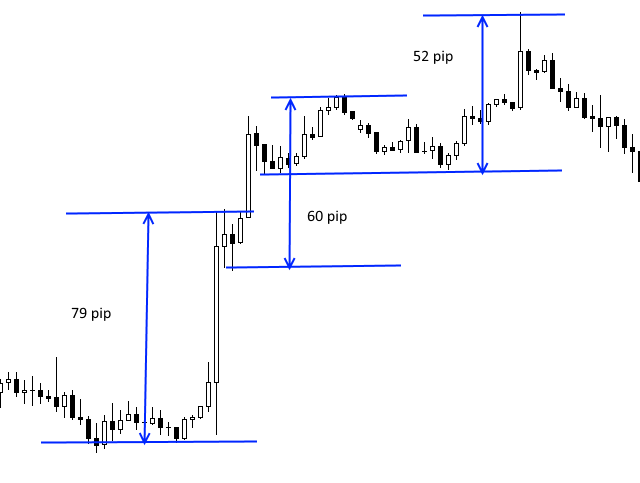
The above figure shows this example. When a new low is formed, the size of the new wave is less than of the previous one. In this case we can expect an emerging divergence.
The below example showing the same market part with the RSI indicator confirms the above assumption.
Although divergence can be easily determined, this method is not complete without the use of indicators. We do not see the convergence/divergence lines. Therefore, let us consider several indicators that are most often used to identify this pattern.
The RSI Oscillator
The RSI oscillator features zoned >-100 and <+100, which represent oversold and overbought zones respectively. All signals emerging in these zones are considered to be strong, and signals of divergence are thought to be even stronger.
Among the disadvantages of this method is the fact that the indicator is very sensitive to price fluctuations. This makes it difficult to identify peaks and troughs using this indicator. The price chart needs to be analyzed. This leads to a delay in signal detection.
The Stochastic Oscillator
The following standard parameters are used for the oscillator:
- %K Period: 5
- %D Period: 3
- Slowing: 3
Similar to RSI, the Stochastic oscillator has overbought and oversold zones. Divergence or convergence in these zones significantly increases the chances for having positive deal results.
The disadvantage of Stochastic is the too frequent appearance of divergences, i.e. a lot of false signals. All signals shall be interpreted
as a warning of possible changes, therefore it is necessary to use additional techniques for determining market entry points.
The MACD Oscillator
MACD is an interesting oscillator that can also help to determine divergences. The indicator is used with standard parameters:
- Fast EMA: 12
- Slow EMA: 26
- MACD SMA: 9
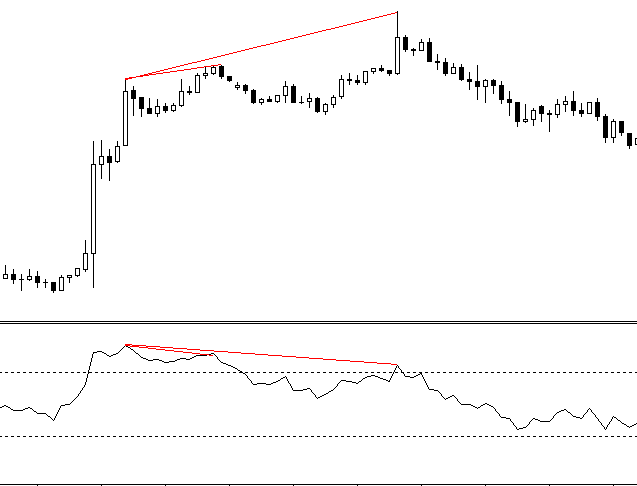
One of the rules for determining the divergence using MACD is the following: the oscillator bars must not cross the zero level. The below screenshot shows that in this case divergence is not obvious, so chances of having a profitable trade are low.
Unlike the previous indicators, this one generates fewer signals. But it is a trend indicator, and therefore it informs about global changes in the market. Despite all advantages, the market entry needs to be confirmed by the Price Action analysis or candlestick patterns.
The Volumes Indicator
Volume is another important characteristic. One of the strongest reversal signals is the divergence (or convergence) of the price and the
volume. The idea is the following:
An upward movement continues as long as new volumes flow into the market. At one of the high breakouts, we see volume decrease, which means that buyers stop providing money to the market. We can conclude that the price is overbought and is likely to move down. The described situation is shown in the below figure.
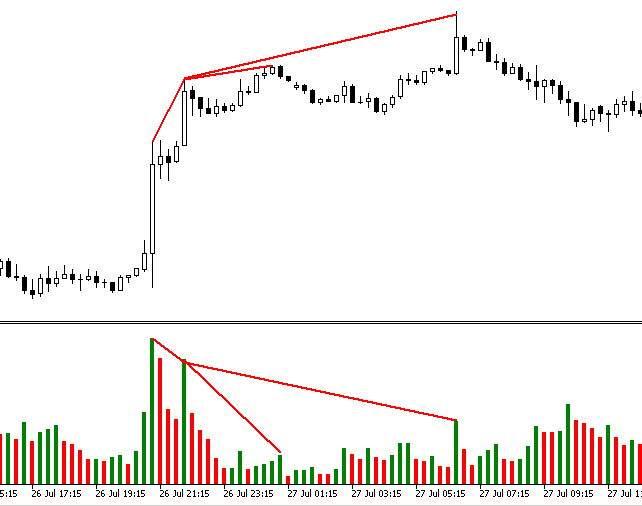
In this context I see OBV as the most interesting indicator. It provides good market entry signals based on this hidden divergence.
As for the classic divergence in OBV, it often indicates only the slowdown and transition to consolidation.
Rules for Determining Divergence/Convergence. How to Trade Divergence
Let's discuss common mistakes that traders often make while trying to find convergence/divergence and executing a deal based on this pattern.
- The presence of a trend is obligatory; divergence does not work in flat.
- In addition to divergence, you should confirm entries using Price Action or Japanese candlesticks.
- Do not expect that you have found a 100% signal. There is always the possibility of an error. Therefore, when performing trading operations, you should observe general trading rules.
- Do not determine divergence based on candlesticks that are constructed using news indicators. Due to high volatility during news releases, such candlesticks often produce false signals.
- The divergence must be explicit. You must be sure that the signal is visible not only to you, but also to the other market participants. The chance of making the right decision may increase only in this case.
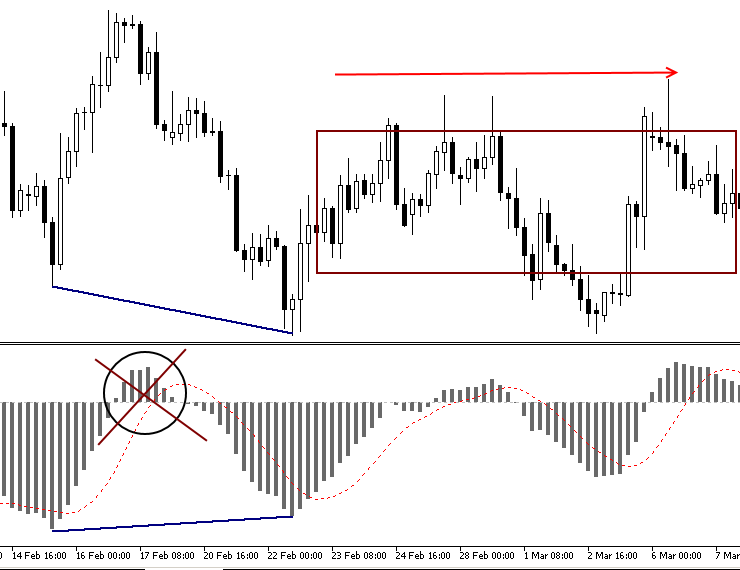
- Only analyze nearest peaks and troughs. This gives a clearer understanding of the situation. When using trend indicators, such as MACD,
the intersection of the zero line may weaken the signal or even cancel it.
A New Approach
We have considered common rules for the use and construction of the Divergence pattern. Now we will look at the non-standard use of divergences in trading. In our work, we will not apply standard rules, and will additionally use an absolutely non-typical indicator.
We will conduct our experiment on the basis of the classic Bill Williams' Accelerator Oscillator. The choice is not accidental. The indicator direction changes before any changes in the driving force, while the direction of the driving force changes before the price change. AO is an early confirmation signal, which provides obvious advantages. We can receive divergence signals earlier and more often. Normally this solution would lead to increased noise, but in our case we have more market entry signals and earlier slowdown signals.
We have already considered common rules for the use and construction of divergence. This variant of divergence use is non-standard. We still observe these common rules, while using an unusual way to determine entry points.
The main purpose of this tool is to find divergences, so its variables will only contain one parameter — the number of bars used for determining the divergence.
#property indicator_separate_window
//---- One buffer is used for calculating and drawing the indicator
#property indicator_buffers 2
//---- Only one graphical construction is used
#property indicator_plots 1
//---- The indicator is drawn as a line
#property indicator_type1 DRAW_COLOR_HISTOGRAM
//---- Blue color is used for the indicator line
#property indicator_color1 Green,Red
//----
#property indicator_width1 2
//---- The indicator line is a continuous curve
#property indicator_style1 STYLE_SOLID
//---- Displaying the indicator label
#property indicator_label1 "AC_Div"
//+------------------------------------------------------------------+
input int Bars_Calculated=1000;
//+------------------------------------------------------------------+
string shortname="";
double AC_buff[];
double Color_buff[];
int wid;
int Handle_AC;
//---
#define DATA_LIMIT 37
The indicator is initialized with the preset parameters of the multicolor histogram.
//+------------------------------------------------------------------+
//| Custom indicator initialization function |
//+------------------------------------------------------------------+
int OnInit()
 {
//---- Setting dynamic arrays as the indicator buffer
 SetIndexBuffer(0,AC_buff,INDICATOR_DATA);
 SetIndexBuffer(1,Color_buff,INDICATOR_COLOR_INDEX);
//---- Setting the position, from which the indicator drawing starts
 PlotIndexSetInteger(1,PLOT_DRAW_BEGIN,DATA_LIMIT);
//---- Initialization of a variable for the indicator short name
 shortname="Accelerator_Divergence";
//---- Creating a name for displaying in a separate subwindow and in a tooltip
 IndicatorSetString(INDICATOR_SHORTNAME,shortname);
//---- Defining the accuracy of displaying indicator values
 IndicatorSetInteger(INDICATOR_DIGITS,_Digits);
//---- Disabling drawing of empty indicator values
 PlotIndexSetDouble(0, PLOT_EMPTY_VALUE, 0.0);
 PlotIndexSetDouble(1, PLOT_EMPTY_VALUE, 0.0);
//--- Forming the handle of the Accelerator indicator
 Handle_AC=iAC(NULL,0);
//--- Finding the index of the chart subwindow
 wid=ChartWindowFind(0,shortname);
//---
 return(INIT_SUCCEEDED);
 }
The main indicator calculation code consists of two parts.
The first part is the basic indicator.
//---- Declaring local variables
 int limit,bar,pos;
//---- Check if the number of bars is sufficient for calculations
 if(rates_total<DATA_LIMIT)
 return(0);
 int barsCalculated=MathMin(Bars_Calculated,rates_total);
//+------- Setting the array indexing direction ---------------------+
 ArraySetAsSeries(close,true);
 ArraySetAsSeries(AC_buff,true);
 ArraySetAsSeries(low,true);
 ArraySetAsSeries(high,true);
 ArraySetAsSeries(Color_buff,true);
 ArraySetAsSeries(time,true);
//+--- Determining the number of bars needed for calculation --------+
 limit=rates_total-DATA_LIMIT-1;
 if(prev_calculated>0) limit=rates_total-prev_calculated;
 pos=limit;
 if(pos>barsCalculated)pos=limit;
 int to_copy;
 if(prev_calculated>rates_total || prev_calculated<0) to_copy=rates_total;
 else
 {
 to_copy=rates_total-prev_calculated;
 if(prev_calculated>0) to_copy++;
 }
//---
 if(IsStopped()) return(0); //Checking for stop flag
//+----- Forming the main array -------------------------------------+
 if(CopyBuffer(Handle_AC,0,0,to_copy,AC_buff)<=0)
 {
 Print("getting Accelerator Handle is failed! Error",GetLastError());
 return(0);
 }
//+---------- Coloring the histogram --------------------------------+
 for(bar=limit; bar>=0 && !IsStopped(); bar--)
 {
 Color_buff[bar]=0.0;
 if(AC_buff[bar]<AC_buff[bar+1])Color_buff[bar] =1.0;
 if(AC_buff[bar]>AC_buff[bar+1])Color_buff[bar] =0.0;
 }
The second part includes the search for discrepancies.
//+----------- Detecting UP divergences ------------------------------+
 int bars=barsCalculated;
 for(bar=pos; bar>=0 && !IsStopped(); bar--)
 {
 int l=bar+2;
 if(Extremum(AC_buff[l+1],AC_buff[l],AC_buff[l-1])<0)
 {
 int i=l;
 int counted=LastPeak(l,bars,AC_buff);
 if(counted!=-1)
 {
 if(AC_buff[i]<AC_buff[counted] && high[i]>high[counted])
 {
 DrawPriceTrendLine(time[i],time[counted],high[i],high[counted],Red,STYLE_SOLID);
 DrawIndicatorTrendLine(time[i],time[counted],AC_buff[i],AC_buff[counted],Red,STYLE_SOLID);
 }

 if(AC_buff[i]>AC_buff[counted] && high[i]<high[counted])
 {
 DrawPriceTrendLine(time[i],time[counted],high[i],high[counted],Red,STYLE_DOT);
 DrawIndicatorTrendLine(time[i],time[counted],AC_buff[i],AC_buff[counted],Red,STYLE_DOT);
 }
 }
 }
//+----------- Detecting DN divergences ------------------------------+
 if(Extremum(AC_buff[l+1],AC_buff[l],AC_buff[l-1])>0)
 {
 int i=l;
 int counted=LastTrough(l,bars,AC_buff);
 if(counted!=-1)
 {
 if(AC_buff[i]>AC_buff[counted] && low[i]<low[counted])
 {
 DrawPriceTrendLine(time[i],time[counted],low[i],low[counted],Green,STYLE_SOLID);
 DrawIndicatorTrendLine(time[i],time[counted],AC_buff[i],AC_buff[counted],Green,STYLE_SOLID);
 }
 if(AC_buff[i]<AC_buff[counted] && low[i]>low[counted])
 {
 DrawPriceTrendLine(time[i],time[counted],low[i],low[counted],Green,STYLE_DOT);
 DrawIndicatorTrendLine(time[i],time[counted],AC_buff[i],AC_buff[counted],Green,STYLE_DOT);
 }
 }
 }
 }
To reduce the code volume, graphical constructions and the high/low search function are provided separately.
//+----- Search for the second UP extremum --------------------------+
int LastPeak(int l,int bar,double &buf[])
 {
 for(int i=l+5; i<bar-2; i++)
 if(Extremum(buf[i+1],buf[i],buf[i-1])<0)return (i);
 return (-1);
 }
//+----- Search for the second DN extremum --------------------------+
int LastTrough(int l,int bar,double &buf[])
 {
 for(int i=l+5; i<bar-2; i++)
 if(Extremum(buf[i+1],buf[i],buf[i-1])> 0)return (i);
 return (-1);
 }
//+-- Search for extrema -------------------------------------------+
int Extremum(double a,double b,double c)
 {
 if((a-b)*(b-c)<0)
 {
 if(c>b && b<0) return(1); //DN extremum
 if(c<b && b>0) return(-1);//UP extremum
 }
 return(0);
 }
//+------ Creating objects on the price chart -----------------------+
void DrawPriceTrendLine(datetime T_0,
 datetime T_1,
 double P_0,
 double P_1,
 color color_0,
 int style)
 {
 string name_2=shortname+DoubleToString(T_0,0);
 string name_0;
 name_0=shortname+"Line_Sn"+ColorToString(color_0);
//---
 if(ObjectFind(0,name_2)<0)
 drawLineS(name_2,T_0,T_1,P_0,P_1,color_0,style,0,true,false,0);
//+-----------+
 if(style==STYLE_DOT)
 drawLineS(name_0,T_1,T_0,P_1,P_0,clrAqua,0,3,true,true,0);
 }
//+------ Creating objects in the indicator window ------------------+
void DrawIndicatorTrendLine(datetime T_0,
 datetime T_1,
 double P_0,
 double P_1,
 color color_0,
 int style)
 {
 string name_1,name_0;
 int window= wid;
 name_1 = shortname+DoubleToString(T_0+wid,0);
 if(ObjectFind(0,name_1)<0)
 drawLineS(name_1,T_0,T_1,P_0,P_1,color_0,style,0,false,false,window);
//---
 if(style==STYLE_SOLID)
 {
 name_0=shortname+"Line_Pn"+ColorToString(color_0);
 drawLineS(name_0,T_1,T_0,P_1,P_0,clrMagenta,style,2,true,true,window);
 }
 }
//+------------------------------------------------------------------+
void drawLineS(string name,
 datetime t0,
 datetime t1,
 double p0,
 double p1,
 color clr,
 int style,
 int width,
 bool back,
 bool ray,
 int window)
 {
 ObjectDelete(0,name);
 ObjectCreate(0,name,OBJ_TREND,window,t0,p0,t1,p1,0,0);
 ObjectSetInteger(0,name,OBJPROP_RAY_RIGHT,ray);
 ObjectSetInteger(0,name,OBJPROP_COLOR,clr);
 ObjectSetInteger(0,name,OBJPROP_STYLE,style);
 ObjectSetInteger(0,name,OBJPROP_WIDTH,width);
 ObjectSetInteger(0,name,OBJPROP_SELECTABLE,false);
 ObjectSetInteger(0,name,OBJPROP_BACK,back);
 }
//+------------------------------------------------------------------+
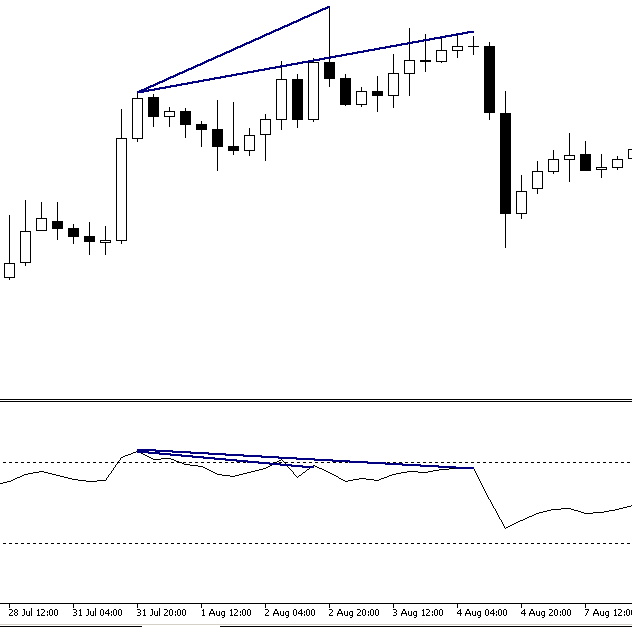
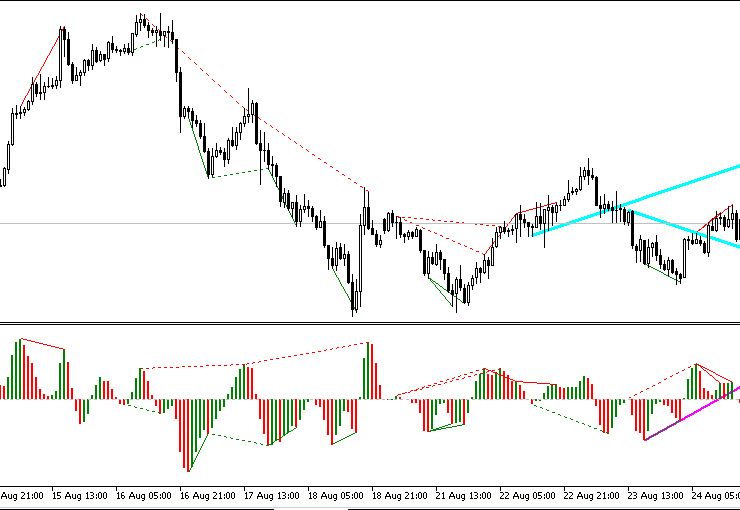
For the convenience of visual analysis, we use a solid line for the classic divergence, and a dotted line for the hidden divergence. Red color
is used for bearish divergences, and green is used for bullish divergences. Thick rays show the last hidden bullish and bearish divergence
on the price chart, and classic divergences in the indicator window. Further I will explain these visualization rules. The indicator will
look like this:
Basic Principles of the Strategy
Analysis of price charts and the indicator has shown that the extended line of the reverse divergence on the price chart and that of the classicadivergence on the indicator chart become sloping support and resistance levels. A confident breakout of these lines characterizes further short-term and long-term market behavior.
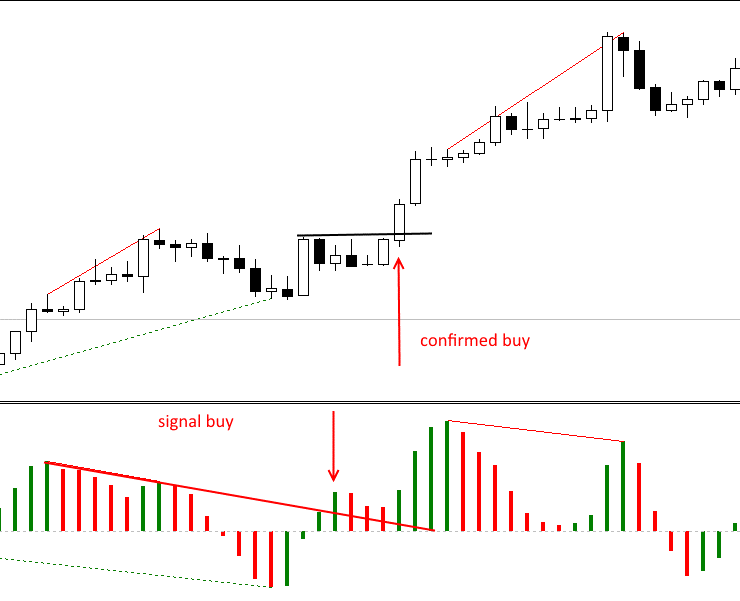
Example of breakout of support lines formed by the hidden divergence and located on the price chart:
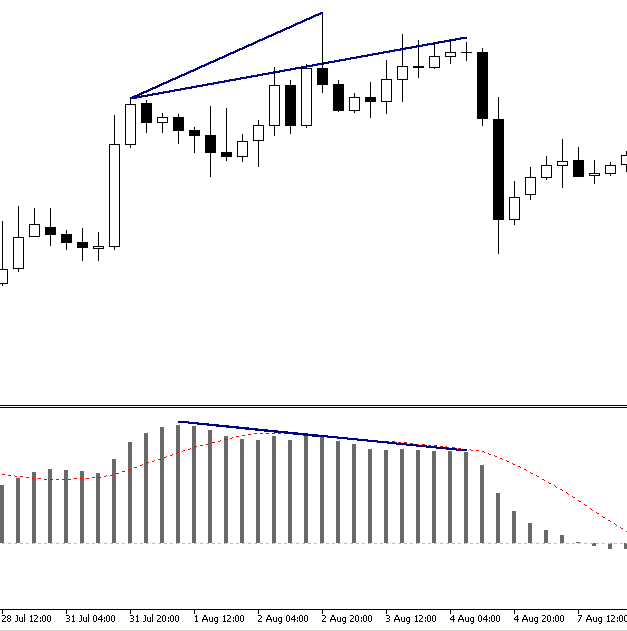
In the next example, histogram bars break the classic divergence lines in the indicator window:
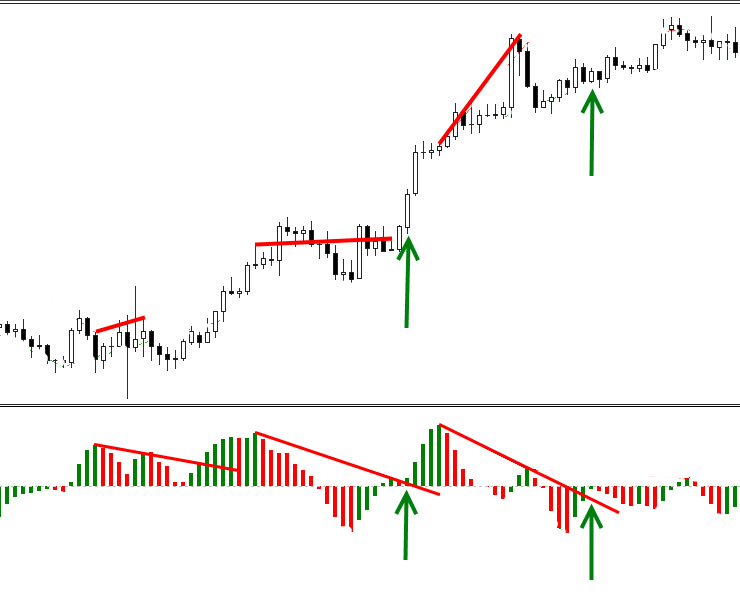
After the breakout, the roles of lines often change. I.e. a broken support level turns into resistance:
We will base our strategy on these behavioral features.
Trading Principle
You can trade both pending and market orders. The timeframe and trading time are not significant. The main rule is the confident breakout of lines. When trading pending orders, we place them on the High (Low) of the breaking candlestick or the candlestick, on which the bar of the histogram is formed. The candlestick should be in the breakout direction. In other words, if the line is broken upwards, the candlestick should close in buy, and vice versa.
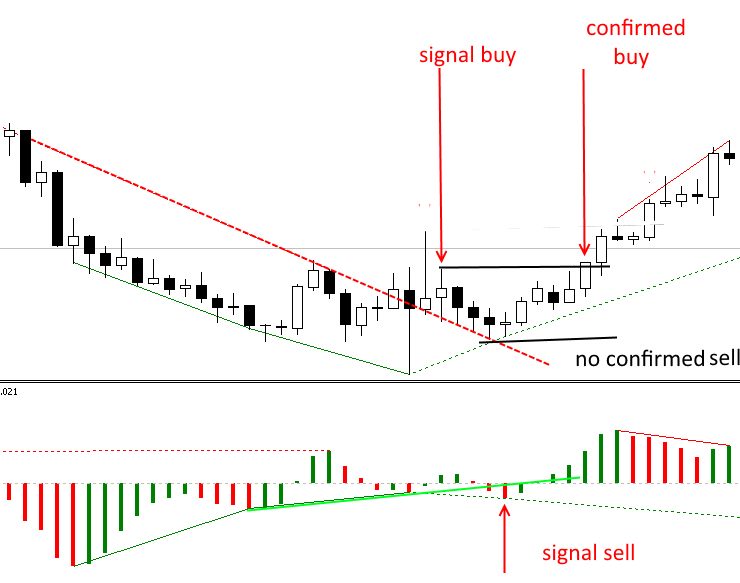
The below figure shows a price chart, on which hidden divergence is confidently broken: there is a signal to open a long position, which is then confirmed. In the indicator window the classic divergence line is broken, so there is a signal to open a short position which is not confirmed later.
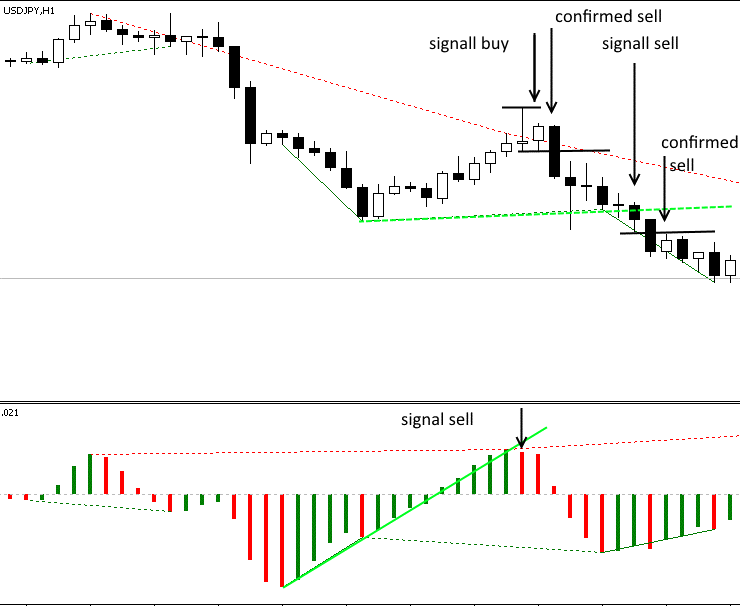
The next figure shows another situation: a buy signal is formed when the classic divergence line in the indicator window is broken. The signal
is confirmed later.
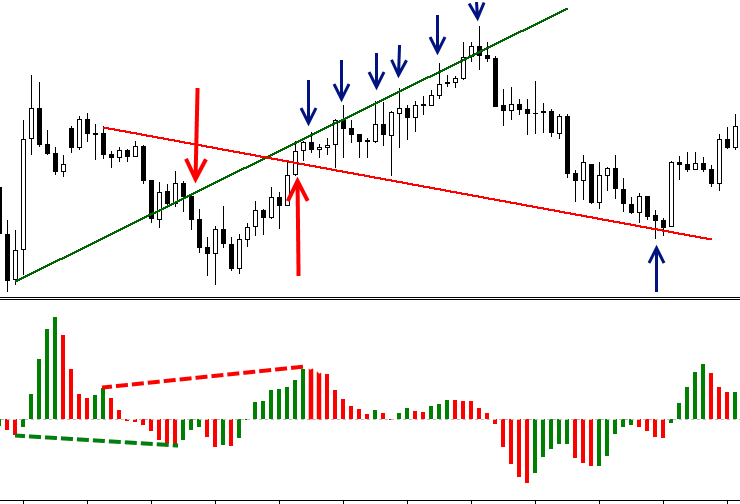
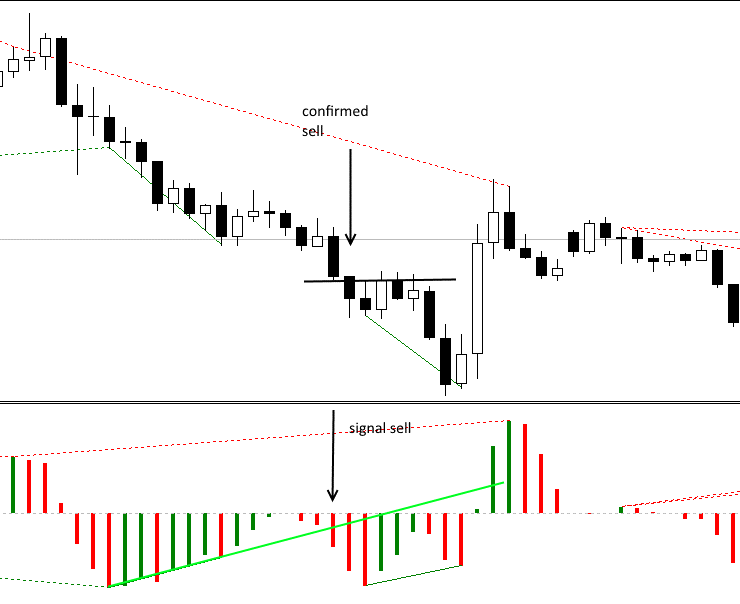
Below is another interesting example. Two signals simultaneously appear on one candlestick: one buy signal and one sell signal. In this case we can check the values of the oscillator. But even if we ignore the oscillator, we will see that only the required order triggers, so the sell deal is confirmed. Further, there is another sell signal, which intensifies the previous. It allows to increase the volume position and thus to increase profits.
A classic Sell signal:
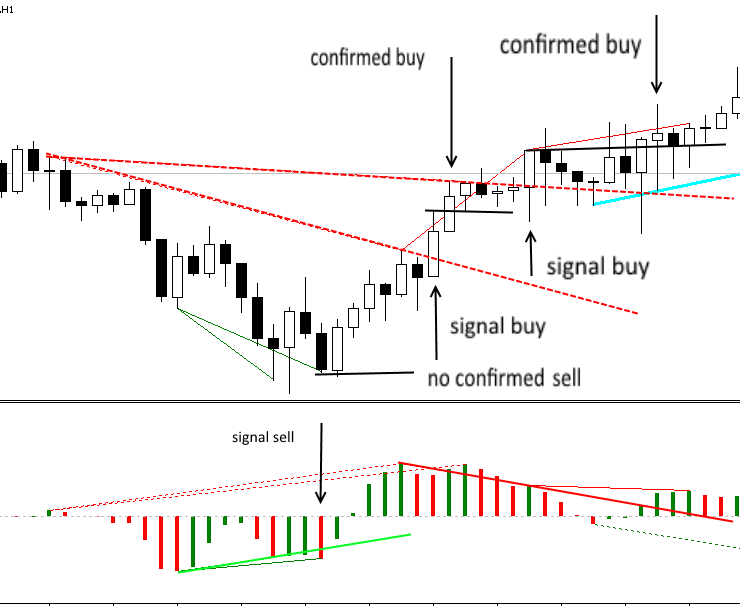
The below figure shows a sell signal (which is later canceled by the oscillator) and two buy signals.
Stop losses are set below the nearest local extremum. Take profit is set at support/resistance levels. Support/resistance levels can be set on our lines during counter-trend trading. But in this case be careful, since the market situation can change dramatically and you may need to adjust the take profit level.
On lower timeframes (М1-М15), the price often returns to the line after the breakout, forming the 1-2-3 pattern which intensifies the signal. Therefore, if the market is not active enough, you should better wait until the price breaks the high or low of the breakout candlestick, after which you can enter the market. Of course, the classical interpretation of the divergence is also valid. Although the oscillator is not as important as in other strategies and is mainly used for graphical constructions, it is still recommended to take into account the oscillator behavior in trading. The AO indicator is used in a wide variety of strategies. A combination of AO and the described approach can significantly increase the effectiveness of such strategies.
To test the viability of our strategy, let us create an Expert Advisor trading using pending orders. The main problem is that we cannot use a simple indicator call inside the Expert Advisor. In this case the indicator will not draw anything in the indicator window. Since we need the graphical constructions, we will insert the indicator code part to the EA code.
input double InpLots =0.1;           // Lots
input int InpTakeProfit =150;        // Take Profit (in pips)
input int InpStopLoss =60;           // StopLoss (in pips)
input int InpTrailingStop =25;       // Trailing Stop Level (in pips)
input int InpOffset =5;              // Distance from the price (in pips)
input int InpDellOorder =30;         // Order removal distance (in pips)
//---
int ExtTimeOut=10;                   // time interval between trading operations in seconds
int barsCalculated=1000;
datetime t=0;
datetime time[];
In addition to traditional variables, such as Lots, TakeProfit, StopLoss and TrailingStop, we have added Offset and DellOorder. The first one sets the distance (pip) between the order and the High or Low of the breakout candlestick. If the order has not yet triggered, and the price has moved in the opposite direction at the DellOorder (pip) distance, the order should be deleted.
This Expert Advisor is not original, so we will only discuss the main points. We will not use trade filters, but we will slightly modify the original code.
//+------------------------------------------------------------------+
//| Basic Calculation                                                |
//+------------------------------------------------------------------+
 for(int bar=1; bar>0 && !IsStopped() && t!=time[0]; bar--)
 {
 int l=bar+1;
 int p1=0,p2=0;
 //+----------- Detecting UP divergences ------------------------------+
 if(Extremum(m_buff_ind[l+1],m_buff_ind[l],m_buff_ind[l-1])<0)
 {
 int i=l;
 int counted=LastPeak(l,bars,m_buff_ind);
 if(counted!=-1)
 {
 if(m_buff_ind[i]<m_buff_ind[counted] && high[i]>high[counted] && !d1)
 { drawLine("Buy_1",time[i],time[counted],m_buff_ind[i],m_buff_ind[counted],Red,1); d1=true;}
 //---
 if(m_buff_ind[i]>m_buff_ind[counted] && high[i]<high[counted] && !d2)
 {
 p1=ArrayMaximum(high,i-1,5);p2=ArrayMaximum(high,counted-2,5);
 drawLine("Buy_2",time[p1],time[p2],high[p1],high[p2],Red,0);d2=true;
 }
 }
 }
 //+----------- Detecting DN divergences ------------------------------+
 if(Extremum(m_buff_ind[l+1],m_buff_ind[l],m_buff_ind[l-1])>0)
 {
 int i=l;
 int counted=LastTrough(l,bars,m_buff_ind);
 if(counted!=-1)
 {
 if(m_buff_ind[i]>m_buff_ind[counted] && low[i]<low[counted] && !d3)
 { drawLine("Sell_1",time[i],time[counted],m_buff_ind[i],m_buff_ind[counted],Green,1);d3=true;}
 //---
 if(m_buff_ind[i]<m_buff_ind[counted] && low[i]>low[counted] && !d4)
 {
 p1=ArrayMinimum(low,i-1,5);p2=ArrayMinimum(low,counted-2,5);
 drawLine("Sell_2",time[p1],time[p2],low[p1],low[p2],Green,0);d4=true;
 }
 }
 }
 if(d1 && d2 && d3 && d4)break;
 t=time[0];
 }
//---
 }
We understand that the extremum of the indicator will not necessarily be an extremum on the price chart. Therefore, in order to correct related distortions on our charts, we have added two functions ArrayMinimum and ArrayMaximum (highlighted). These functions allow identifying High and Low on the part of the price chart where the indicator extremum is formed. Also, in order to eliminate minor fluctuations of the indicator around the zero line and associated false signals, we have modified the formula for determining high/low. Now it only takes into account the indicator values having a common potential (positive or negative).
//+-- Search for extrema -------------------------------------------+
int Extremum(double a,double b,double c)
 {
 if(((a-b)*(b-c)<0) && ((a>0 && b>0 && c>0) || (a<0 && b<0 && c<0)))
 {
 if(c>b && b<0) return(1); //DN extremum
 if(c<b && b>0) return(-1);//UP extremum
 }
 return(0);
 }
//+------
We also use the ObjectGetValueByTime function for determining the value of the line at a certain time coordinate. This function is used many times. For convenience, it will be added separately.
//+------------------------------------------------------------------+
//|Returns price value for the specified time of the specified object|
//+------------------------------------------------------------------+
double CSampleExpert::ValueByTime(string label,int i)
 {
 double p=0.0;
//---
 p=ObjectGetValueByTime(0,label,time[i],0);
 return(p);
 }
//+------------------------------------------------------------------+
As we have already mentioned, we will not use trade filters. We do not aim to create a full-featured trading robot, while we only want to evaluate the effectiveness of the strategy. Therefore the module of signals is very simple. We determine whether the line is broken in the desired direction and in which direction the price (the indicator) is currently moving.
//+------------------------------------------------------------------+
//| Checking conditions for opening a short position                 |
//+------------------------------------------------------------------+
bool CSampleExpert::ShortOpened(void)
 {
 bool res=false;
//---
 double pp1=EMPTY_VALUE,pp2=EMPTY_VALUE,pp3=EMPTY_VALUE,
 pp4=EMPTY_VALUE,pp5=EMPTY_VALUE,pp6=EMPTY_VALUE;
//---
 if(ObjectFind(0,"Sell_2")!=-1)
 {
 pp1=ValueByTime("Sell_2",1);
 pp2=ValueByTime("Sell_2",2);
 pp3=ValueByTime("Sell_2",3);
 }
 if(ObjectFind(0,"Sell_1")!=-1)
 {
 pp4=ValueByTime("Sell_1",1);
 pp5=ValueByTime("Sell_1",2);
 pp6=ValueByTime("Sell_1",3);
 }
//--- Checking the possibility of a short position (SELL)
 if((pp1!=EMPTY_VALUE && close[1]<pp1 && close[2]>pp2&&close[0]<close[1])||
 (pp4!=EMPTY_VALUE && m_ind_1>m_ind_0 && ((m_ind_1<pp4 && m_ind_2>pp5) ||(m_ind_2<pp5 && m_ind_3>pp6))))
 {
 //--- We need to exit the Expert Advisor in any case
 res=true;
 }
//--- result
 return(res);
 }
//+------------------------------------------------------------------+
The above part shows a block for entering short positions. Long entries look similar.
After receiving a signal (line breakout), we set an appropriate order at the InpOffset distance from the extermum of the candlestick that was
high or low near to the breakout candlestick. If this candlestick is a breakout one, the order is placed straight at this candlestick.
//+------------------------------------------------------------------+
//| Opening a sellstop position                                      |
//+------------------------------------------------------------------+
bool CSampleExpert::OpenSellStop(void)
 {
 bool res=false;
//--- Finding a bar with the lowest low among nearest candlesticks
 int i=ArrayMinimum(low,0,3);
//---
 if(ShortOpened())
 {
 double offset=InpOffset;                          // distance from the low of the candlestick for placing an order, pips
 double limit_price=m_symbol.Bid();
 double price=low[i]-offset*m_adjusted_point;;
 double tp =price-m_take_profit;
 double sl =price+m_stop_losse;
 //--- check the account balance
 if(m_account.FreeMarginCheck(Symbol(),ORDER_TYPE_SELL_STOP,InpLots,price)<0.0)
 printf("We do not have money. Free margin = %f",m_account.FreeMargin());
 else
 {
 //--- Open a position
 if(m_trade.OrderOpen(Symbol(),ORDER_TYPE_SELL_STOP,InpLots,limit_price,price,sl,tp))
 {res=true; printf("Position by %s to be opened",Symbol());}
 else
 {
 printf("Error occurred while opening position SELL STOP %s : '%s'",Symbol(),m_trade.ResultComment());
 printf("Open parameters: price=%f,TP=%f",price,tp);
 }
 }
 }
//--- result
 return(res);
 }
//+------------------------------------------------------------------+
If the order has not triggered, and the price has moved in the opposite direction at a distance greater than InpDellOorder, the order should be deleted.
//+------------------------------------------------------------------+
//| Deleting unnecessary orders                                      |
//+------------------------------------------------------------------+
bool CSampleExpert::DelOrder(ulong ticket,string type)
 {
 bool res=false;
 if(m_trade.OrderDelete(ticket))
 printf("Position by %s to be opened",Symbol());
 else
 {
 res=true;// Setting the flag indicating that the order has not been deleted
 printf("Error occurred while deleting the order"+type+" %s : '%s'",Symbol(),m_trade.ResultComment());
 }
 return(res);
 }
//+------------------------------------------------------------------+
Let's get back to our main goal, i.e. to the evaluation of the strategy. The difficulty in the evaluation of strategies working on graphical constructions is that they can only be evaluated in the visual mode. Optimization in the automated mode is not possible. It is a time-consuming process. Therefore, let's run the Expert Advisor on GBPUSD H1, starting with the beginning of 2017. Let's use the default settings.
Here is the result:
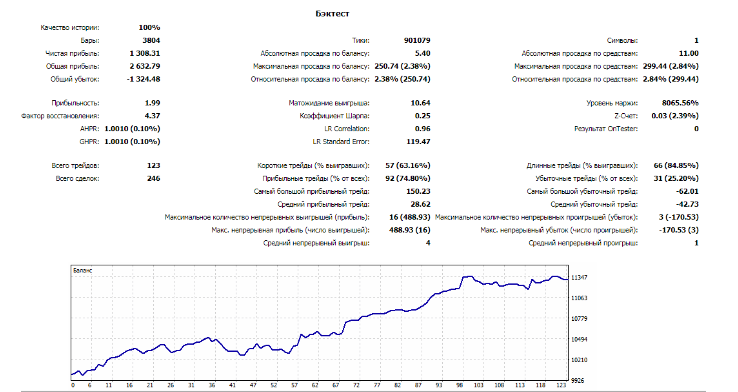
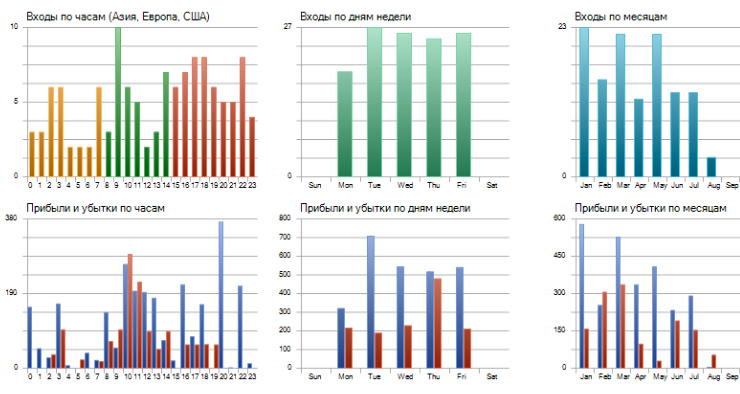
This method can hardly be called fully objective. However, the obtained results show that the strategy has a good potential. In the long run, after further improvements, it can turn into a valuable strategy.
Conclusions
This approach enabled us to create a completely feasible strategy, which however allows using other tools. The disadvantages of this strategy include occasional incorrect construction of indicator lines and the need to correct them manually. This makes it difficult to automate the strategy and, as a result, to analyze. Nevertheless, the research showed that not only classic strategies can exist.
Programs used in the article:
| # | Name | Type | Description |
|---|---|---|---|
| 1 | Accelerator_Div | Indicator |
The indicator determining the explicit and hidden divergence/convergence based on the Accelerator indicator |
| 2 | TestExpert | Expert Advisor |
An Expert Advisor for strategy testing |