Introduction to MQL5: How to write simple Expert Advisor and Custom Indicator
Denis Zyatkevich | 7 April, 2010
Introduction
MetaQuotes Programming Language 5 (MQL5), included in MetaTrader 5 Client Terminal, has many new possibilities and higher performance, compared to MQL4. This article will help you to get acquainted with this new programming language. The simple examples of how to write an Expert Advisor and Custom Indicator are presented in this article. We will also consider some details of MQL5 language, that are necessary to understand these examples.
The article details and full description of MQL5 can be found in MQL5 Reference, included in MetaTrader 5. Information contained in MQL5 built-in help is sufficient to study the language. This article may be useful for those, who are familiar with MQL4, and also for newbies, who are just beginning to program trading systems and indicators.
Getting started with MQL5
MetaTrader 5 trading platform allows you to perform technical analysis of financial instruments and to trade, both manually and in automatic mode. MetaTrader 5 differs from its predecessor - MetaTrader 4. Particularly, the concepts of deal, position and order have been refined.
- Position - is a market commitment, the number of bought or sold financial instrument's contracts.
- Order - is an order to buy or to sell some amount of financial instrument under certain conditions.
- Deal - is a fact of execution of some order by broker, which leads to opening, modifying or closing position.
The Client Terminal has built-in programming language MQL5, that allows you to write several types of programs with different purpose:
- Expert Advisor - is a program, that trades according to some specified algorithm. An Expert Advisor allows you to implement the trade system for automated trading (the trading operations can be performed without a trader). An Expert Advisor can perform trade operations, open and close positions, and manage pending orders.
- Indicator - is a program that allows to present data in graphical form, that is convenient for analysis.
- Script - is a program that allows to perform some sequence of operations at once.
Expert Advisors, Indicators and Scripts may call functions of MQL5 standard library and DLL functions, including the operation system libraries. The pieces of code, located in the other files, can be included in the text of the program, written in MQL5.
To write a program (Expert Advisor, Indicator or Script), you can launch MetaTrader 5 Client Terminal and choose MetaQuotes Language Editor from Tools menu, or simply press F4 key.

Figure 1. Launching MetaEditor.
In MetaEditor 5 window choose New from File menu or press Ctrl+N.
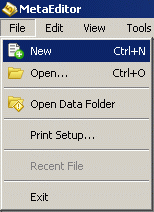
Figure 2. Creating New Program.
In MQL5 Wizard window choose the type of the program you want to create:
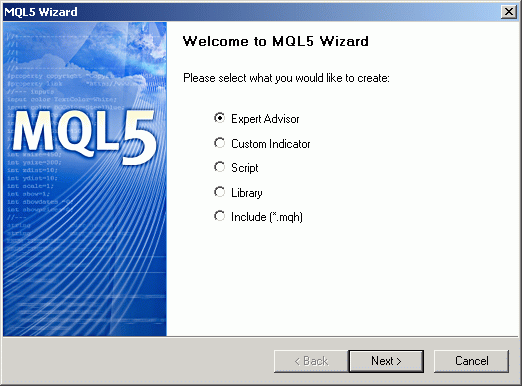
Figure 3. MQL5 Wizard.
On the next step, you can specify program name, information about the author, and parameters, that will be requested from user after launching the program.
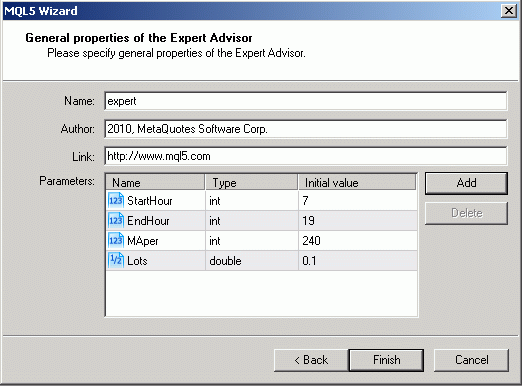
Figure 4. General properties of Expert Advisor.
After that, the program template (Expert Advisor, Indicator or Script) will be created, that you may edit and fill with your code:
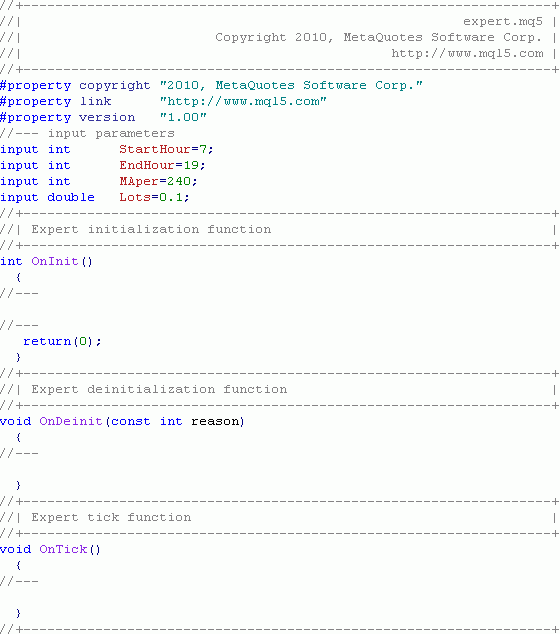
Figure 5. Template of a new program.
When the program is ready, it's necessary to compile it. To compile the program choose Compile from File menu or press F7 key:
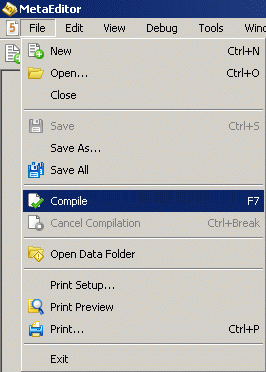
Figure 6. Program compilation.
If there are no errors in the program code, the file with extension .ex5 will be created. After that you can attach this new Expert Advisor, Indicator or Script to the chart of MetaTrader 5 Client Terminal for the execution.
An MQL5 program is a sequence of operators. Each operator ends with a semicolon symbol ";". For your convenience you may add comments to your code, which are placed inside the symbols "/*" and "*/", or after "//" to the end of the line. MQL5 is "event-oriented" programming language. This means that when certain events (program launching or termination, new quote arrival, etc.) happen, the Client Terminal launches the corresponding function (subprogram), written by the user, that performs specified operations. The Client Terminal has the following predefined events:
- Start event happens when Script is running (used in Scripts only). It leads to the execution of OnStart function. MQL4 equivalent - start function in Scripts.
- Init event happens when Expert Advisor or Indicator is launched. It leads to the execution of OnInit function. MQL4 equivalent - init function.
- Deinit event happens when Expert Advisor or Indicator is terminated (for example, after detaching from chart, closing Client Terminal, etc.). It leads to the execution of OnDeinit function. MQL4 equivalent - deinit function.
- NewTick event happens when new quote for the current financial instrument is arrived (used in Expert Advisors only). It leads to the execution of OnTick function. MQL4 equivalent - start function in Expert Advisors.
- Calculate event happens when Indicator is launched (after OnInit function execution) and when new quote for the current financial instrument is arrived (used in Indicators only). It leads to the execution of OnCalculate function. MQL4 equivalent - start function in Indicators.
- Trade event happens when the order is executed, modified or deleted, when the position is opened, modified or closed (used in Expert Advisors only). It leads to the execution of OnTrade function. In MQL4 there is no equivalent of this event and function.
- BookEvent event happens when the Depth of Market is changed (used in Expert Advisors only). It leads to the execution of OnBookEvent function. In MQL4 there is no equivalent of this event and function, as well as Depth of Market.
- ChartEvent event happens when user works with chart: clicks mouse and presses keys, when the chart window is in focus. In also happens during creation, movement or deletion of the graphic objects, etc. (used in Expert Advisors and Indicators). It leads to the execution of OnChartEvent function. There is no equivalent of this event and function in MQL4.
- Timer event happens periodically when timer is triggered, if it has been activated using the EventSetTimer function. It leads to the execution of OnTimer function. In MQL4 there is no equivalent of this event and function, as well as a timer.
Before using the variables, it's necessary to specify the data type of each of them. MQL5 supports more data types than MQL4:
- bool is intended to store logical values (true or false). It takes 1 byte of memory.
- char is intended to store integer values from -128 to 127. It takes 1 byte of memory.
- uchar is intended to store unsigned integer values from 0 to 255. It takes 1 byte of memory.
- short is intended to store integer values from -32 768 to 32 767. It takes 2 bytes of memory.
- ushort is intended to store unsigned integer values from 0 to 65 535. It takes 2 bytes of memory.
- int is intended to store integer values from -2 147 483 648 to 2 147 483 647. It takes 4 bytes of memory.
- uint is intended to store unsigned integer values from 0 to 4 294 967 295. It takes 4 bytes of memory.
- long is intended to store integer values from -9 223 372 036 854 775 808 to 9 223 372 036 854 775 807. It takes 8 bytes of memory.
- ulong is intended to store unsigned integer values from 0 to 18 446 744 073 709 551 615. It takes 8 bytes of memory.
- float is intended to store floating point values. It takes 4 bytes of memory.
- double is intended to store floating point values. Usually it is used to store price data. It takes 8 bytes of memory.
- datetime is intended to store date and time values, it's a number of seconds elapsed from 01.01.1970 00:00:00. It takes 8 bytes of memory.
- color is intended to store the information about the color, it contains the characteristics of three color components - red, green and blue. It takes 4 bytes of memory.
- enum stands for enumeration. It allows to specify a type of certain limited set of data. It takes 4 bytes of memory.
- string is intended to store text strings. It's internal representation is 8-bytes structure, that contain the size of buffer with string and the pointer to that buffer.
It is necessary to choose the appropriate data type for the optimal performance and rational memory use. In MQL5 there is a new concept called structure. The structure combines the logically related data.
Trading system
The trading system, that is used in this article as an example, is based on the assumption, that European financial institutions are opened in the morning, and later, the economic events are published in USA, that leads to the trend of EURUSD. The chart period isn't important, but I recommend to use the minute bars, because the whole day (or its part) is visible at once, so it's very convenient for the observation.
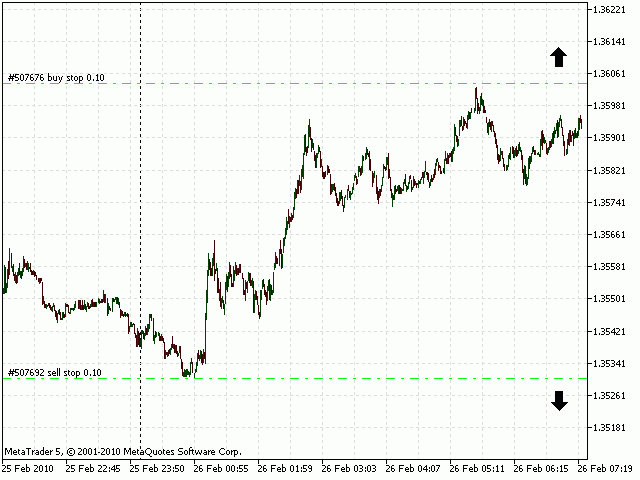
Figure 7. Trading system.
At 7 AM (server time) Buy Stop and Sell Stop pending orders are placed at distance of one point beyond the price range of the current day. For Buy Stop pending orders the spread is taken into account. The StopLoss levels are placed on the opposite sides of the range. After execution, StopLoss order is moved to simple moving average, but only if it's profitable.
The benefit of this type of trailing compared with the classical Trailing Stop is following: it allows to avoid early closure of position in the case of price spikes with corrections. On the other hand it leads to position closure when the trend ends and flat movement begins. The simple moving average is calculated using minute chart data and has averaging period equal to 240.
The profit level depends on the current market volatility. To determine market volatility, the Average True Range (ATR) indicator (with period equal to 5 is applied to the daily chart) is used. So, it shows the average daily range of the past week. To determine the Take Profit level value for the long position, we will add the value of the ATR indicator to the minimal price of the current day. The same for the short positions: we will subtract the value of the ATR indicator from the maximal price of the current day. The order is not placed if the order price value is beyond the StopLoss and TakeProfit levels. After 7 PM (server time) all pending orders are deleted and aren't placed this day (the open positions are still trailed until closing).
Writing an indicator
Let's write an indicator, that shows the profit levels of trade system described above.
If the first symbol in a line is "#", it mean that this string is a preprocessor directive. Directives are used to specify additional program properties, to declare constants, to include header files and imported functions. Note that after preprocessor directives there are no semicolon (;) symbols.
#property copyright   "2010, MetaQuotes Software Corp."
#property link        "http://www.mql5.com"
#property description "This indicator calculates TakeProfit levels"
#property description "using the average market volatility. It uses the values"
#property description "of Average True Range (ATR) indicator, calculated"
#property description "on daily price data. Indicator values are calculated"
#property description "using maximal and minimal price values per day."
#property version     "1.00"
The information about the author and his web page can be specified in the copyright and link properties, the description property allows you to add the brief description, the version property allows you to specify the program version. When indicator is running this information looks as follows:
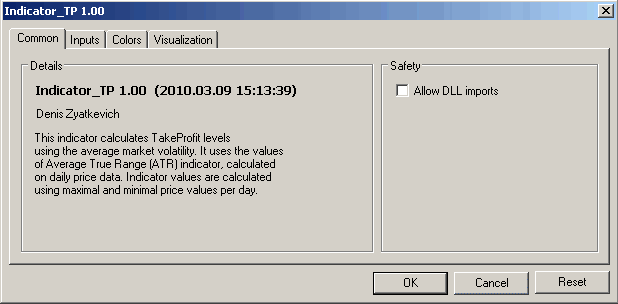
Figure 8. Indicator information.
It's necessary to specify indicators position: on a chart or in a separate window. It can be done by specifying one of the properties: indicator_chart_window or indicator_separate_window:
#property indicator_chart_window
In addition, you need to specify the number of indicator's buffers that will be used and the number of graphic series. In our case, there are two lines, each of them has its own buffer - an array with the data that will be plotted.
#property indicator_buffers 2
#property indicator_plots   2
For each indicator line let's specify the following properties: type (indicator_type property), color (indicator_color property), drawing style (indicator_style property) and text label (indicator_label property):
#property indicator_type1   DRAW_LINE
#property indicator_color1  C'127,191,127'
#property indicator_style1  STYLE_SOLID
#property indicator_label1  "Buy TP"
#property indicator_type2   DRAW_LINE
#property indicator_color2  C'191,127,127'
#property indicator_style2  STYLE_SOLID
#property indicator_label2  "Sell TP"
The basic line types are: DRAW_LINE - for lines, DRAW_SECTION - for sections, DRAW_HISTORAM for the histograms. There are many other drawing styles. You can define the color by specifying the brightness of its three RGB components or by using the predefined colors, for example, Red, Green, Blue, White, etc. The line styles are: STYLE_SOLID - solid line, STYLE_DASH - dashed line, STYLE_DOT - dotted line, STYLE_DASHDOT - dash-dot line, STYLE_DASHDOTDOT - dash-two points.
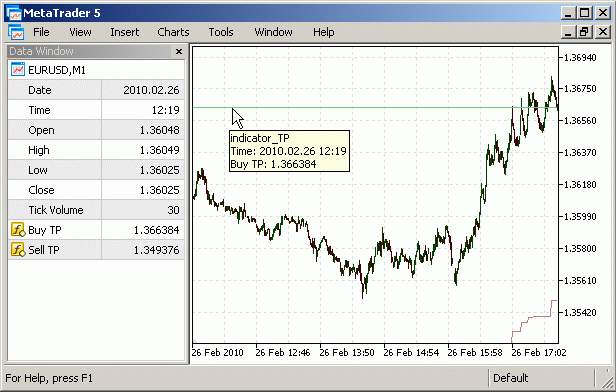
Figure 9. Description of indicator lines.
Using the input modifier, let's specify the external variables (you can specify their values after launching the indicator), their type and default values:
input int             ATRper       = 5;         //ATR Period
input ENUM_TIMEFRAMES ATRtimeframe = PERIOD_D1; //Indicator timeframe
The names of parameters can be specified in comments - they will be visible instead of the names of variables:
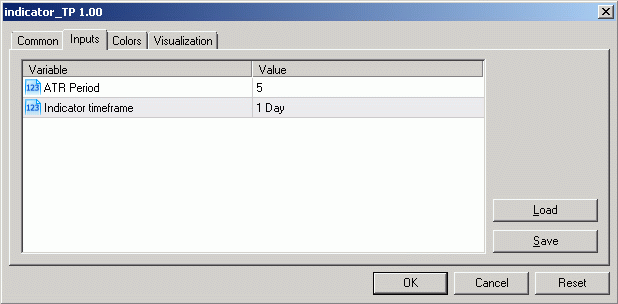
Figure 10. Indicator's input parameters.
On a global level (that is visible to all functions), we will specify variables (and their types), that will be used by different functions of our indicator.
double bu[],bd[];
int hATR;
The bu[] and bd[] arrays will be used for the upper and lower lines of indicator. We will use dynamic arrays (i.e. the arrays without specified number of elements), because we don't know exactly the number of elements that will be used (their size will be allocated automatically). The handle of built-in technical indicator will be stored in the hATR variable. Indicator handle is necessary to use the indicator.
The function OnInit is called after the indicator's running (after its attaching to the chart).
void OnInit()
  {
   SetIndexBuffer(0,bu,INDICATOR_DATA);
   SetIndexBuffer(1,bd,INDICATOR_DATA);
   hATR=iATR(NULL,ATRtimeframe,ATRper);
  }
The function SetIndexBuffer is necessary to specify the fact that the bu[] and bd[] arrays are the indicator's buffers, that will be used to store the indicators values, that are plotted as lines of indicator. The first parameter defines the index of indicator's buffer, the ordering starts from 0. The second parameter specifies an array, assigned to indicator's buffer. The third parameter specifies the type of data, stored in the indicator's buffer: INDICATOR_DATA - data for plotting, INDICATOR_COLOR_INDEX - drawing color, INDICATOR_CALCULATIONS - auxiliary buffers for intermediate calculations.
The indicator's handle, returned by the iATR function, is stored in the hATR variable. The first parameter of the iATR function is trade symbol, NULL - is the symbol of current chart. The second parameter specifies the chart period, that is used for indicator calculation. The third parameter is the averaging period of the ATR indicator.
The OnCalculate function is called right after the end of OnInit function execution and every time after the new quote arrival for the current symbol. There are two ways of calling this function. One of them, that used in our indicator, looks as follows:
int OnCalculate(const int rates_total,
                const int prev_calculated,
                const datetime& time[],
                const double& open[],
                const double& high[],
                const double& low[],
                const double& close[],
                const long& tick_volume[],
                const long& volume[],
                const int& spread[])
After the calling the OnCalculate function, the client terminal passes the following parameters: rates_total - number of bars on the current chart, prev_calculated
- number of bars, already calculated by the indicator, time[], open[], high[], low[], close[], tick_volume[], volume[],
spread[] - arrays, containing the time, open, high, low, close, tick_volume, volume and spread values for each bar, respectively. To reduce the calculation time, it's not necessary to recalculate indicator values, that have been already calculated and haven't changed. After calling the OnCalculate function it returns the number of bars, that have been already calculated.
The code of the OnCalculate function is enclosed in perentheses. It begins with local variables, that are used in the function - their types and names.
  {
   int i,day_n,day_t;
   double atr[],h_day,l_day;
The i variable is used as a cycle counter, the day_n and day_t variables are used to store the number of day and to temporarily store the number of day, when calculating the maximal and minimal price values during the day. The atr[] array is used to store the values of the ATR indicator, and the h_day and l_day variables are used to store the maximal and minimal price values during the day.
First, we have to copy the values of ATR indicator into the atr[] array, using the CopyBuffer function. We'll use the handle of ATR indicator as the first parameter of this function. The second parameter is the number of the indicator's buffers (numbering starts from 0), the ATR indicator has an only one buffer. The third parameter specifies the number of first element to start from, the indexation is performed from the present to the past, the zeroth element corresponds to the current (uncompleted) bar. The fourth parameter specifies the number of elements, that should be copied.
Let's copy two elements, because we are interested only in penultimate element, that corresponds to the last (completed) bar. The last parameter is the target array to copy data.
CopyBuffer(hATR,0,0,2,atr);
The direction of array indexation depends on the AS_SERIES flag. If it is set (i.e. equal to true), the array is considered as timeseries, the elements indexing is performed from most recent data to most old. If it is not set (i.e. equal to false), the older elements has lower index, the newest elements has greater.
ArraySetAsSeries(atr,true);For the atr[] array we set the AS_SERIES flag to true using the ArraySetAsSeries function (the first parameter of this function is the array, for which the flag should be changed, the second parameter is the new flag value). Now, the index of the current (uncompleted) bar is equal to 0, the index of the penultimate (completed) bar is equal to 1.
The for operator allows to create a loop.
   for(i=prev_calculated;i<rates_total;i++)
     {
      day_t=time[i]/PeriodSeconds(ATRtimeframe);
      if(day_n<day_t)
        {
         day_n=day_t;
         h_day=high[i];
         l_day=low[i];
        }
        else
        {
         if(high[i]>h_day) h_day=high[i];
         if(low[i]<l_day) l_day=low[i];
        }
      bu[i]=l_day+atr[1];
      bd[i]=h_day-atr[1];
     }
After the for operator the first operator in brackets is a statement: i=prev_calculated. Next, there is an expression, in our case it's: i<rates_total. It's a loop condition - the loop executes while it's true. The third is the statement that executed after the each execution of the loop. In our case, it's i++ (it's equal to i=i+1 and means increasing the i variable by 1).
In our loop the i variable varies from the prev_calculated value to the value, equal to rates_total-1 with step 1. The historical data arrays (time[], high[] and low[]) are not the timeseries by default, the zeroth index corresponds to the oldest bar in history, the last corresponds to the current uncompleted bar. In loop all bars from the first uncalculated (prev_calculated) to the last bar (rates_total-1) are processed. For each of these bars we calculate the values of our indicator.
The time values in the time[] array are stored as number of seconds, elapsed from 01.01.1970 00:00:00. If we divide it by the number of seconds in day (or on some other period), the integer part of the result will be the number of the day beginning from 01.01.1970 (or some other time period). The PeriodSeconds function returns the number of seconds in time period, that is defined as a parameter. The day_t variable is the number of day, corresponding to the bar with the i index. The day_n variable is the number of the day, for which the highest and lowest price values are calculated.
Let's consider the if operator. If the bracket's expression of this operator is true, then operator, following the if keyword, is executed. If it's false, then operator, following the else keyword, is executed. Each operator can be compound, i.e. can consist of several operators, in our case they are enclosed by parentheses.
The highest and lowest price values of processed day are stored in the h_day and l_day variables, respectively. In our case, we are checking the following condition: if the analyzed bar corresponds to the new day, we begin to calculate maximal and minimal price values again, otherwise we continue. We are calculating the values for each indicator line: for the upper line - we are using the minimal daily price, for the lower line - we are using the maximal values of the price.
In the end of OnCalculate function the return operator returns the number of calculated bars.
   return(rates_total);
  }
Inside the DeInit function (it operates when indicator is removed from chart or when Client Terminal is closed) the memory, reserved by the ATR indicator, is released using the IndicatorRelease function. This function has only one parameter - the indicator's handle.
void OnDeinit(const int reason)
  {
   IndicatorRelease(hATR);
  }
Now our indicator is complete. To compile it, in MetaEditor choose Compile from File menu or press F7 key. If there are no errors in the code, compilation will be successful. Compilation results are printed in Errors tab of Toolbox window. In your case, the compiler may print the "Conversion possible loss of data" warning for the following string:
day_t=time[i]/PeriodSeconds(ATRtimeframe);In this line we are intentionally discarding the fractional part, so this loss of data is not an error.
When an indicator is complete and compiled, it can be attached to charts in MetaTrader 5 Client Terminal or can be used in other Indicators, Expert Advisors or Scripts. The source code of this indicator is available as attachment in this article.
Writing an Expert Advisor
Now it's time to write an Expert Advisor, that implements the trading system described above. We'll assume that it will trade only one financial instrument. In order for several Expert Advisor to trade on one instrument, it's necessary to careful analyze the contribution of each one of them into overall position, and that is beyond the scope of this article.
#property copyright   "2010, MetaQuotes Software Corp."
#property version     "1.00"
#property description "This Expert Advisor places the pending orders during the"
#property description "time from StartHour till EndHour on the price levels, that"
#property description "are 1 point below/lower the current trade range."
#property description "The StopLoss levels are placed at the opposite side"
#property description "of the price range. After order execution, the TakeProfit value"
#property description "is set at the 'indicator_TP' level. The StopLoss level is moved"
#property description "to the SMA values only for the profitable orders."
The purpose of these preprocessor directives has been already considered in Writing an Indicator section. They work the same way for an Expert Advisor.
Let's specify the values of input parameters (that can be defined by user after starting an Expert Advisor), their types and default values .
input int    StartHour = 7;
input int    EndHour   = 19;
input int    MAper     = 240;
input double Lots      = 0.1;
The StartHour and EndHour parameters define the time period (starting and ending hours) for pending orders. The MAper parameter defines the averaging period of simple moving average, that is used for the StopLoss level of opened position during its trailing. The Lots parameter defines the volume of financial instrument, used in trading.
Let's specify the global variables, that will be used in the different trade functions:
int hMA,hCI;The hMA variable will be used to store the MA indicator's handle and the hCI variable will be used to store the custom indicator's handle (it's an indicator, that has been written above).
The OnInit function is executed, when Expert Advisor is launched.
void OnInit()
  {
   hMA=iMA(NULL,0,MAper,0,MODE_SMA,PRICE_CLOSE);
   hCI=iCustom(NULL,0,"indicator_TP");
  }
In this function we get handles of MA indicator and our custom indicator. The iMA function and its parameters are used the same as in the iATR function, described above.
The first parameter of iCustom function is the symbolic name of instrument, NULL - means instrument for the current chart. The second parameter - is the chart timeframe, which data is used to calculate the indicator, 0 - means period for the current chart. The third parameter is the filename of indicator (without extension). The file path is relative to the MQL5\Indicators\ folder.
Let's create the OnTick function, that executes after each new quote arrival:
void OnTick()
  {
The code of the function is enclosed in parentheses.
Let's specify the predefined data structures, what will be used in Expert Advisor:
   MqlTradeRequest request;
   MqlTradeResult result;
   MqlDateTime dt;
The MqlTradeRequest predefined structure has orders and positions parameters, what are passed to the OrderSend function in trade operations. The purpose of the MqlTradeResult structure is to store the information about the trade operation results, returned by the OrderSend function. The purpose of the MqlDateTime predefined structure is to store the date and time information.
Let's specify the local variables (and their types) that will be used in the OnTick function:
   bool bord=false, sord=false;
   int i;
   ulong ticket;
   datetime t[];
   double h[], l[], ma[], atr_h[], atr_l[],
          lev_h, lev_l, StopLoss,
          StopLevel=_Point*SymbolInfoInteger(Symbol(),SYMBOL_TRADE_STOPS_LEVEL),
          Spread   =NormalizeDouble(SymbolInfoDouble(Symbol(),SYMBOL_ASK) - SymbolInfoDouble(Symbol(),SYMBOL_BID),_Digits);
The bord and sord boolean variables are used as flags, that show the presence of Buy Stop and Sell Stop pending orders. If it is present, the corresponding variable has value, equal to true, otherwise it's false. The i variable is used as a counter in loop operators and for a store intermediate data. The ticket of pending order is stored in the ticket variable.
The t[], h[] and l[] arrays are used to store the time, the maximal and minimal price values for each bar in history data. The ma[] array is used to store values of the MA indicator, the atr_h[] and atr_l[] arrays are used to store the values of upper and lower lines of indicator_TP custom indicator, that we have created.
The lev_h and lev_l variables are used to store the maximal and minimal price values of current day and the opening prices of pending orders. The StopLoss variable is used to temporarily store the Stop Loss price of opened position.
The StopLevel variable is used to store the value of STOP_LEVEL - the minimal distance between the current price and the pending order price (in price units). We calculate this value as a product of the point price (the _Point predefined variable) by the value of the STOP_LEVEL variable, defined in points. The value of STOP_LEVEL is returned by the SymbolInfoInterger function. The first parameter of this function is the symbol name, the second - is the identifier of requested property. The symbol (name of the financial instrument) can be obtained using the Symbol function (it has no parameters).
The Spread value is used to store the value of spread (in price units). Its value is calculated as a difference between the current Ask and Bid values, normalized using the NormalizeDouble function. The first parameter of this function is the value of double type to normalize, the second is the number of digits after the point, that we have obtained from the _Digits predefined variable. The current Ask and Bid values can be obtained using the SymbolInfoDouble function. The first parameter of this function is the symbol name, the second - is the property identifier.
Let's fill the structure request with values, that will be common for the most of the OrderSend function calls:
   request.symbol      =Symbol();
   request.volume      =Lots;
   request.tp          =0;
   request.deviation   =0;
   request.type_filling=ORDER_FILLING_FOK;
The request.symbol element contains the symbolic name of the instrument, that trades, the request.volume element - the volume (contract size) of financial instrument, request.tp - the numerical value of TakeProfit (in some cases we will not use it and fill with 0), the request.deviation - allowed deviation of the price during trade operation execution, the request.type_filling - the order type, can be one of the following:
- ORDER_FILLING_FOK - the deal can be executed only if the volume is equal or better than specified in order. If there is no sufficient volume, the order will not be executed.
- ORDER_FILLING_IOC - there is no sufficient volume, the order will be executed
at maximal available market volume.
- ORDER_FILLING_RETURN - the same as the ORDER_FILING_IOC, but in this case an additional order for missing volume will be placed.
Let's get the current server time (time of the last quote) using the TimeCurrent function. The only parameter of this function is the pointer to the structure with result.
TimeCurrent(dt);
For all our calculations we need the history price data for current day only. The number of bars, that is necessary (and with some reserve) can be calculated using this formula: i = (dt.hour + 1)*60, where dt.hour - is the structure element, containing the current hour. The values of time, maximal and minimal price are copied into the t[], h[] and l[] arrays using the CopyTime, CopyHigh, CopyLow functions, respectively:
   i=(dt.hour+1)*60;
   if(CopyTime(Symbol(),0,0,i,t)<i || CopyHigh(Symbol(),0,0,i,h)<i || CopyLow(Symbol(),0,0,i,l)<i)
     {
      Print("Can't copy timeseries!");
      return;
     }
The first parameter in the CopyTime,
CopyHigh and
CopyLow functions - is the symbol name, the second - is the chart timeframe, the third - is the starting element to copy, the fourth - is the number of elements to copy, the fifth - is the target array for the data. Each of these functions returns the number of copied elements or the negative value equal -1 in the case of error.
The if operator is used to check the number of copied elements for all three arrays. If the number of copied elements is smaller than necessary for calculation (even for one of the arrays), or for the case of error, it prints the "Can't copy timeseries!" message into the Experts log and terminates execution of OnTick function using the return operator. The message is printed by Print function. It can print any types of data, which are separated by comma.
When the price data have been copied to the t[], h[] and l[] arrays, we set the AS_SERIES flag to true using the ArraySetAsSeries function, that has been considered above. It's necessary to set the array indexation as timeseries (from the current prices to the older prices):
   ArraySetAsSeries(t,true);
   ArraySetAsSeries(h,true);
   ArraySetAsSeries(l,true);
The maximal and minimal price values of current day are placed into the lev_h and lev_l variables:
   lev_h=h[0];
   lev_l=l[0];
   for(i=1;i<ArraySize(t) && MathFloor(t[i]/86400)==MathFloor(t[0]/86400);i++)
     {
      if(h[i]>lev_h) lev_h=h[i];
      if(l[i]<lev_l) lev_l=l[i];
     }
The loop is executed only if the MathFloor(t[i]/86400) == MathFloor(t[0]/86400) condition is true in order to restrict the search with the bars belonging to the current day. Of the left side of this expression there is a number of current bar day, on the right - the number of the current day (86400 is the number of seconds in day). The MathFloor function rounds off the numeric value, i.e. it uses an only integer part for the positive values. The only parameter of this function is the expression to round off. In MQL5, as well as in MQL4, the equality is defined with "==" symbols (see Operations of relations).
The order prices are calculated as follows: for the pending order of Buy Stop type we are adding one point (the _Point predefined variable is equal to the point size in price units) and Spread to the lev_h variable (lev_h+=Spread+_Point or lev_h=lev_h+Spread+_Point). For the pending orders of Sell Stop type we are subtracting one point from the lev_l variable value (lev_l-=_Point or lev_l=lev_l-_Point).
   lev_h+=Spread+_Point;
   lev_l-=_Point;
The next, we are copying the values from the indicator's buffers to arrays using the CopyBuffer function. MA values are copied to the ma[] array, upper line values of our custom indicator are copied to the atr_h[] array, lower line values of indicator are copied to the atr_l[] array. The CopyBuffer function has been described above, when we have considered the details of the indicator.
   if(CopyBuffer(hMA,0,0,2,ma)<2 || CopyBuffer(hCI,0,0,1,atr_h)<1 || CopyBuffer(hCI,1,0,1,atr_l)<1)
     {
      Print("Can't copy indicator buffer!");
      return;
     }
We need the MA indicator value, that corresponds to the penultimate (last completed) bar, and the value of our indicator, that corresponds to the last bar, therefore we are copying these two elements to the ma[] array and one element to the atr_h[] and atr_l[] arrays. In the case of error while copying or if the number of copied values is less than needed (for any of these arrays), the message is printed in Experts log and the OnTick function is terminated using the return operator.
For the ma[] array we are setting the AS_SERIES flag, that indicates the timeseries indexation of array.
ArraySetAsSeries(ma,true);
The atr_[] and atr_l[] arrays have only one element, so the timeseries indexation isn't important. As the atr_l[0] value will be used further to determine the TakeProfit level, short positions are closed at Ask price, but we are adding the spread to the value of atr_l[0], because the Bid prices are used in the price charts.
atr_l[0]+=Spread;
The PositionsTotal function returns the number of opened positions (it has no parameters). The indexes of positions start from 0. Let's create a loop that will search all opened positions:
// in this loop we're checking all opened positions
   for(i=0;i<PositionsTotal();i++)
     {
      // processing orders with "our" symbols only
      if(Symbol()==PositionGetSymbol(i))
        {
         // we will change the values of StopLoss and TakeProfit
         request.action=TRADE_ACTION_SLTP;
         // long positions processing
         if(PositionGetInteger(POSITION_TYPE)==POSITION_TYPE_BUY)
           {
            // let's determine StopLoss
            if(ma[1]>PositionGetDouble(POSITION_PRICE_OPEN)) StopLoss=ma[1]; else StopLoss=lev_l;
            // if StopLoss is not defined or lower than needed
            if((PositionGetDouble(POSITION_SL)==0 || NormalizeDouble(StopLoss-PositionGetDouble(POSITION_SL),_Digits)>0
               // if TakeProfit is not defined or higer than needed
               || PositionGetDouble(POSITION_TP)==0 || NormalizeDouble(PositionGetDouble(POSITION_TP)-atr_h[0],_Digits)>0)
               // is new StopLoss close to the current price?
               && NormalizeDouble(SymbolInfoDouble(Symbol(),SYMBOL_BID)-StopLoss-StopLevel,_Digits)>0
               // is new TakeProfit close to the current price?
               && NormalizeDouble(atr_h[0]-SymbolInfoDouble(Symbol(),SYMBOL_BID)-StopLevel,_Digits)>0)
              {
               // putting new value of StopLoss to the structure
               request.sl=NormalizeDouble(StopLoss,_Digits);
               // putting new value of TakeProfit to the structure
               request.tp=NormalizeDouble(atr_h[0],_Digits);
               // sending request to trade server
               OrderSend(request,result);
              }
           }
         // short positions processing
         if(PositionGetInteger(POSITION_TYPE)==POSITION_TYPE_SELL)
           {
            // let's determine the value of StopLoss
            if(ma[1]+Spread<PositionGetDouble(POSITION_PRICE_OPEN)) StopLoss=ma[1]+Spread; else StopLoss=lev_h;
            // if StopLoss is not defined or higher than needed
            if((PositionGetDouble(POSITION_SL)==0 || NormalizeDouble(PositionGetDouble(POSITION_SL)-StopLoss,_Digits)>0
               // if TakeProfit is not defined or lower than needed
               || PositionGetDouble(POSITION_TP)==0 || NormalizeDouble(atr_l[0]-PositionGetDouble(POSITION_TP),_Digits)>0)
               // is new StopLoss close to the current price?
               && NormalizeDouble(StopLoss-SymbolInfoDouble(Symbol(),SYMBOL_ASK)-StopLevel,_Digits)>0
               // is new TakeProfit close to the current price?
               && NormalizeDouble(SymbolInfoDouble(Symbol(),SYMBOL_ASK)-atr_l[0]-StopLevel,_Digits)>0)
              {
               // putting new value of StopLoss to the structure
               request.sl=NormalizeDouble(StopLoss,_Digits);
               // putting new value of TakeProfit to the structure
               request.tp=NormalizeDouble(atr_l[0],_Digits);
               // sending request to trade server
               OrderSend(request,result);
              }
           }
         // if there is an opened position, return from here...
         return;
        }
     }
Using the if operator inside the loop, we choose the positions that has been opened for symbol of the current chart. The PositionGetSymbol function returns the symbol of instrument, besides that, it automatically selects the position to work with. The function has only one parameter - the index of position in the list of opened positions. It's quite possible, that it will be necessary to change the StopLoss and TakeProfit values of the opened positions, so let's put the TRADE_ACTION_SLTP value to the request.action element. Next, depending on its direction, positions are divided into long and short ones.
For long positions the StopLoss level is determined as follows: If the MA indicator value is higher than opening price of position, the StopLoss value is assumed to be equal to the MA indicator value, otherwise the StopLoss value is assumed to be equal to the lev_l variable value. The StopLoss current value for the opened position is determined using the PositionGetDouble function, that has an only one parameter - the identifier of the position property. If the StopLoss value isn't defined for opened position (equal to 0), or it's higher than it should be - we will modify the values of StopLoss and TakeProfit for this position. If the TakeProfit value isn't defined (equal to 0), or it's higher than it should be (higher that the upper line of our indicator) - we will modify the values of StopLoss and TakeProfit for this position.
We have to check the possibility of changing of StopLoss and TakeProfit values. The new value of StopLoss should be lower than current Bid price (at least by the STOP_LEVEL value), the new value of TakeProfit should be greater than current Bid price at least by the STOP_LEVEL value. We have used the normalized difference for compare, because the compared values may differ in last digits because of the inaccuracy, caused by conversion of floating point binary numbers of double type into floating point decimal numbers.
If it is necessary to change StopLoss or TakeProfit levels for opened position, and new values are valid according to trading rules, we put the new values of StopLoss and TakeProfit into corresponding elements of the structure and call the OrderSend function to send data to the trade server.
The changing of StopLoss and TakeProfit values for the short positions is the same. The short positions, compared with longs, are closed by Ask prices, so the Ask values will be used for comparison. If there is an opened position for the current chart - we end the execution of the OnTick function using the return operator.
The OrdersTotal function (it has no parameters) returns the number of pending orders. The indexes start from 0. Let's create a loop that will be used to process all pending orders:
// in this loop we're checking all pending orders
   for(i=0;i<OrdersTotal();i++)
     {
      // choosing each order and getting its ticket
      ticket=OrderGetTicket(i);
      // processing orders with "our" symbols only
      if(OrderGetString(ORDER_SYMBOL)==Symbol())
        {
         // processing Buy Stop orders
         if(OrderGetInteger(ORDER_TYPE)==ORDER_TYPE_BUY_STOP)
           {
            // check if there is trading time and price movement is possible
            if(dt.hour>=StartHour && dt.hour<EndHour && lev_h<atr_h[0])
              {
               // if the opening price is lower than needed
               if((NormalizeDouble(lev_h-OrderGetDouble(ORDER_PRICE_OPEN),_Digits)>0
                  // if StopLoss is not defined or higher than needed
                  || OrderGetDouble(ORDER_SL)==0 || NormalizeDouble(OrderGetDouble(ORDER_SL)-lev_l,_Digits)!=0)
                  // is opening price close to the current price?
                  && NormalizeDouble(lev_h-SymbolInfoDouble(Symbol(),SYMBOL_ASK)-StopLevel,_Digits)>0)
                 {
                  // pending order parameters will be changed
                  request.action=TRADE_ACTION_MODIFY;
                  // putting the ticket number to the structure
                  request.order=ticket;
                  // putting the new value of opening price to the structure
                  request.price=NormalizeDouble(lev_h,_Digits);
                  // putting new value of StopLoss to the structure
                  request.sl=NormalizeDouble(lev_l,_Digits);
                  // sending request to trade server
                  OrderSend(request,result);
                  // exiting from the OnTick() function
                  return;
                 }
              }
            // if there is no trading time or the average trade range has been passed
            else
              {
               // we will delete this pending order
               request.action=TRADE_ACTION_REMOVE;
               // putting the ticket number to the structure
               request.order=ticket;
               // sending request to trade server
               OrderSend(request,result);
               // exiting from the OnTick() function
               return;
              }
            // setting the flag, that indicates the presence of Buy Stop order
            bord=true;
           }
         // processing Sell Stop orders
         if(OrderGetInteger(ORDER_TYPE)==ORDER_TYPE_SELL_STOP)
           {
            // check if there is trading time and price movement is possible
            if(dt.hour>=StartHour && dt.hour<EndHour && lev_l>atr_l[0])
              {
               // if the opening price is higher than needed
               if((NormalizeDouble(OrderGetDouble(ORDER_PRICE_OPEN)-lev_l,_Digits)>0
                  // if StopLoss is not defined or lower than need
                  || OrderGetDouble(ORDER_SL)==0 || NormalizeDouble(lev_h-OrderGetDouble(ORDER_SL),_Digits)>0)
                  // is opening price close to the current price?
                  && NormalizeDouble(SymbolInfoDouble(Symbol(),SYMBOL_BID)-lev_l-StopLevel,_Digits)>0)
                 {
                  // pending order parameters will be changed
                  request.action=TRADE_ACTION_MODIFY;
                  // putting ticket of modified order to the structure
                  request.order=ticket;
                  // putting new value of the opening price to the structure
                  request.price=NormalizeDouble(lev_l,_Digits);
                  // putting new value of StopLoss to the structure
                  request.sl=NormalizeDouble(lev_h,_Digits);
                  // sending request to trade server
                  OrderSend(request,result);
                  // exiting from the OnTick() function
                  return;
                 }
              }
            // if there is no trading time or the average trade range has been passedе
            else
              {
               // we will delete this pending order
               request.action=TRADE_ACTION_REMOVE;
               // putting the ticket number to the structure
               request.order=ticket;
               // sending request to trade server
               OrderSend(request,result);
               // exiting from the OnTick() function
               return;
              }
            // setting the flag, that indicates the presence of Sell Stop order
            sord=true;
           }
        }
     }
Using the OrderGetTicket function we select order for further work with it, and we are saving the order ticket into the ticket variable. This function has an only one parameter - index of the order in the list of the opened orders. The OrderGetString function is used to get the name of the symbol. It has an only one parameter - the order property identifier. We are comparing the symbol name with the name of the current chart, it allows to select orders just by instrument, on which Expert Advisor is working. The order type is determined by the OrderGetInteger function with corresponding order type identifier. We will separately process Buy Stop and Sell Stop orders.
If the current hour is in the range from StartHour to EndHour, and the opening price of Buy Stop order doesn't exceed the upper line of the indicator, we will modify the opening price and the value of StopLoss level (if necessary), otherwise we delete the order.
Next we are determining, is it necessary to modify the opening price or StopLoss level for the pending order. If the opening price of Buy Stop order is lower than it should be or if StopLoss isn't defined or higher, we are putting the TRADE_ACTION_MODIFY value to the request.action element - it means that pending order parameters should be changed. Also we put the order ticket to the request.ticket element and send trade request to trade server using the OrderSend function. In comparison we determine the case when opening price is lower than it should be, because the value of spread can be varied, but we don't modify the order after each spread change, it will be set at the highest level, that corresponds to the maximal spread value.
Also in comparison we are determining only the case, when the value of StopLoss is higher, than it should be, because the price range may be expanding during the day, and it's necessary to move down the value of StopLoss order after the new lows of the price. After sending request to trade server, the OnTick function execution is terminated using the return operator. If Buy Stop orders are present the bord variable value is set to true.
Sell Stop orders are processed the same as Buy Stop orders.
Now let's place Buy Stop and Sell Stop pending orders in the case of their absence. We are putting the TRADE_ACTION_PENDING value into the request.action element (it means that pending order is placed).
request.action=TRADE_ACTION_PENDING;If the value of current hour is within the order placing time, we are placing the orders:
   if(dt.hour>=StartHour && dt.hour<EndHour)
     {
      if(bord==false && lev_h<atr_h[0])
        {
         request.price=NormalizeDouble(lev_h,_Digits);
         request.sl=NormalizeDouble(lev_l,_Digits);
         request.type=ORDER_TYPE_BUY_STOP;
         OrderSend(request,result);
        }
      if(sord==false && lev_l>atr_l[0])
        {
         request.price=NormalizeDouble(lev_l,_Digits);
         request.sl=NormalizeDouble(lev_h,_Digits);
         request.type=ORDER_TYPE_SELL_STOP;
         OrderSend(request,result);
        }
     }
  }
While placing Buy Stop and Sell Stop orders we are checking for presence of same orders by analyzing the values of bord and sord variables. Also we are checking the following condition: the price of order should be within the values of our indicator. The normalized price of order is placed into the request.price element, the normalized value of StopLoss is placed into the request.sl variable, the order type (ORDER_BUY_STOP or ORDER_SELL_STOP) is placed into the request.type variable. After that we are sending request to trade server. The code of the OnTick function ends with a semicolon.
The resources, allocated by indicators, are released inside the OnDeinit function using the IndicatorRelease function, that has been considered above.
void OnDeinit(const int reason)
  {
   IndicatorRelease(hCI);
   IndicatorRelease(hMA);
  }
Expert Advisor is complete, the compilation should be successful if there isn't any errors. Now we can run it by attaching to the chart. The source code can be downloaded in attachments to this article.
Launching and Debugging
When Expert Advisor and Indicator are ready, let's consider how to launch them and how to debug them using built-in MetaEditor debugger.
To launch an Expert Advisor, it's necessary to find it in Expert Advisors group of Navigator window. After that choose Attach to chart from context menu, that will appear when clicking right mouse button:
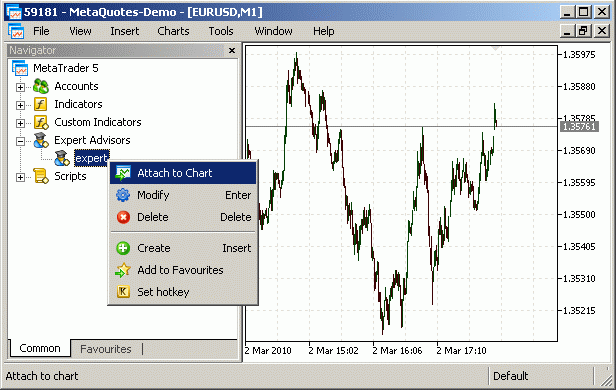
Figure 11. Launching Expert Advisor.
The window with input parameters of Expert Advisor will appear, you can change these parameters if it is necessary. After the pressing OK, the icon ![]() will appear in the upper right corner of chart, this icon indicates that Expert Advisor is working. To show or close Navigator window you can choose Navigator from View menu or press Ctrl+N. The second way to launch the Expert Advisor is to select it in the Experts sub-menu of Insert menu.
will appear in the upper right corner of chart, this icon indicates that Expert Advisor is working. To show or close Navigator window you can choose Navigator from View menu or press Ctrl+N. The second way to launch the Expert Advisor is to select it in the Experts sub-menu of Insert menu.
In order for Expert Advisor to be able to trade, AutoTrading should be allowed in Client Terminal options: Tools menu -> Options window -> Exprert Advisors tab -> Allow AutoTrading option should be enabled. In order for Expert Advisor to be able to call functions from DLLs, the Allow DLL imports option should also be enabled.
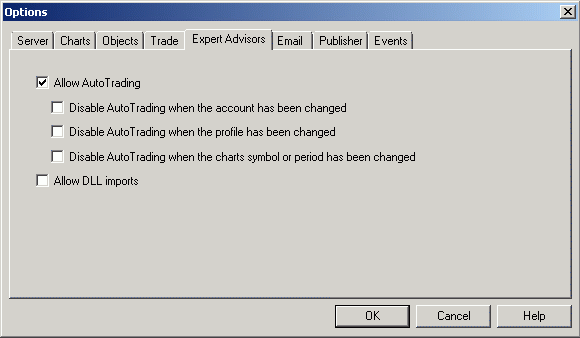
Figure 12. Terminal options - allowing AutoTrading.
In addition, you can set authorization or prohibition of trading and importing of the external DLL libraries for each Expert Advisor individually by checking the corresponding options.
Despite the fact that our Expert Advisor uses indicators, the lines of the indicators are not plotted on the chart. If necessary, you can attach the indicators manually.
Launching Indicators is the same as for Expert Advisors: if you want to launch built-in indicators, expand the Indicators tree in Navigator window (for the custom indicators it's necessary to expand the Custom Indicators tree), right-click for pop-up menu to appear, then choose Attach to Chart from context menu. The second way is to choose Indicators from Insert menu, choose the group (or choose Custom for custom indicators) and the indicator itself.
Scripts are launched the same way as Expert Advisors and Indicators.
The information about Client Terminal events (connection/disconnection to/from the trade server, automatic update, positions and orders changes, Expert Advisors and Scripts running, error messages) can be found in the Journal tab of Toolbox window. The messages that printed by Expert Advisors, Indicators and Scripts are located in the Experts tab.
The MetaEditor has built-in debugger. It allows you to debug programs - step-by-step execution of Expert Advisors, Indicators and Scripts. Debugging helps to find errors in program code and to observe the processes during Expert Advisor, Indicator or Script execution. To run a program in debug mode, it's necessary to choose the Start from the Debug menu or press the F5 key. The program will be compiled and will run in the debug mode in the separate chart, its period and symbol can be specified in Debugging tab of Options window of MetaEditor.
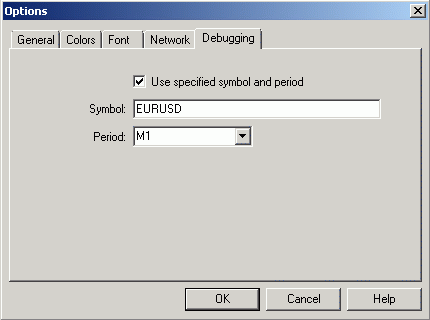
Figure 13. Editor options - Debugging.
You can set the breakpoints by pressing the F9 key, or by double clicking on the left side of the line, or by choosing the Toggle Breakpoint from Debug window. In debug mode, the execution of program will stop before the operator with breakpoint. After the stop, the Debug tab will appear in Toolbox window (Figure 14.). On the left side there is a calls stack panel - file, function and number of a line are displayed there. On the right side there is watch panel - values of watched variables are displayed there. To add the variable to the watch list, right-click on the panel and select Add or press Insert key.
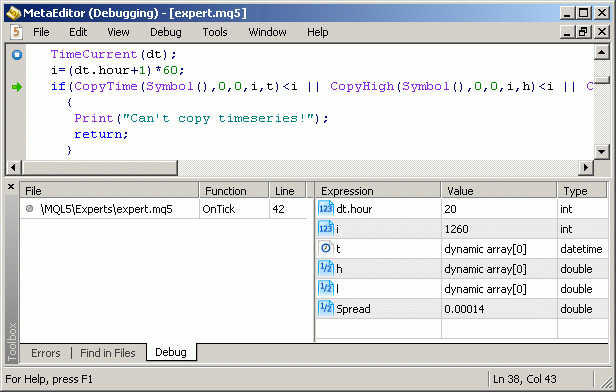
Figure 14. Program Debug.
The step-by-step program execution can be performed by pressing F11, F10 or Shift+F11 keys. After pressing the F11 key or choosing Step Into from the Debug menu, it will pass one step of the program execution entering all called functions. After pressing the F10 key or choosing Step Over from the Debug menu, it will pass one step of the program execution without entering called functions. After pressing the Shift+F11 keys or choosing Step Out from the Debug menu, it will run the execution of a program step one level higher. The green arrow on the left side of the code marks the line of the code, that will be executed.
Conclusion
In the article an example of writing a simple Expert Advisor and Indicator is presented, and the basics of MQL5 programming language are described. The trading system, provided here is chosen as example, so the author is not responsible for its use in a real trade.