Creating Expert Advisors Using Expert Advisor Visual Wizard
molanis | 16 January, 2012
Introduction
Expert Advisor Visual Wizard for MetaTrader 5 provides a highly intuitive graphical environment with a comprehensive set of predefined trading blocks that let you design Expert Advisors in minutes. No coding, programming or MQL5 knowledge is required.
The click, drag and drop approach of Expert Advisor Visual Wizard allows you to create visual representations of forex trading strategies and signals as you would with pencil and paper. These trading diagrams are analyzed automatically by Molanis’ MQL5 code generator that transforms them into ready to use Expert Advisors. The interactive graphical environment simplifies the design process and eliminates the need to write MQL5 code.
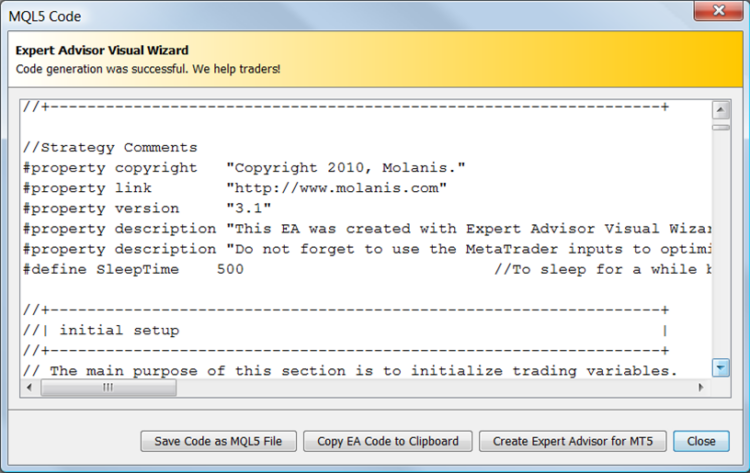
With Expert Advisor Visual Wizard you only need to follow a 3 step process:

Fig. 1. Using Expert Advisor Visual Wizard
1. Developing a Trading Diagram
A trading diagram is a graphical representation of an Expert Advisor. It shows the ‘flow’ through a trading decision system. Trading diagrams are made of trading blocks that are connected to create complex Expert Advisors.
Moving Average Strategy
Typically, two moving averages can be used to create an Expert Advisor with these trading conditions:
- Buy when the short period moving average is above the long period moving average (red line is above the green line)
- Sell when the short period moving average is below the long period moving average (red line is below the green line)
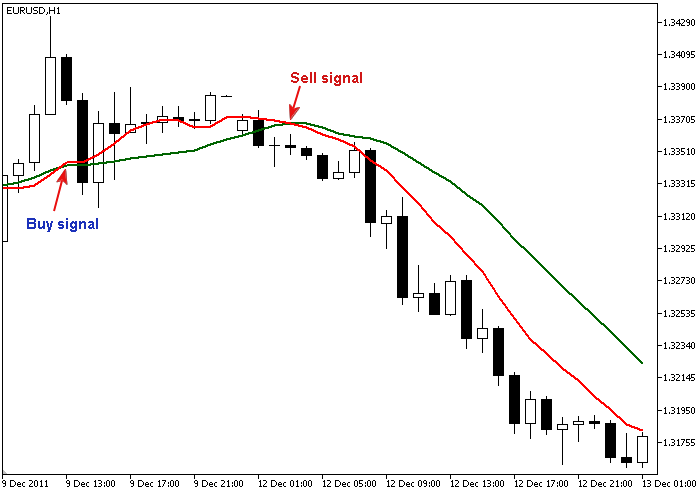
Fig. 2. Buy and Sell signals
Instead of spending a long time coding this EA, with Expert Advisor Visual Wizard you can create a trading diagram that represents the moving average strategy in seconds.
Launch Expert Advisor Visual Wizard:
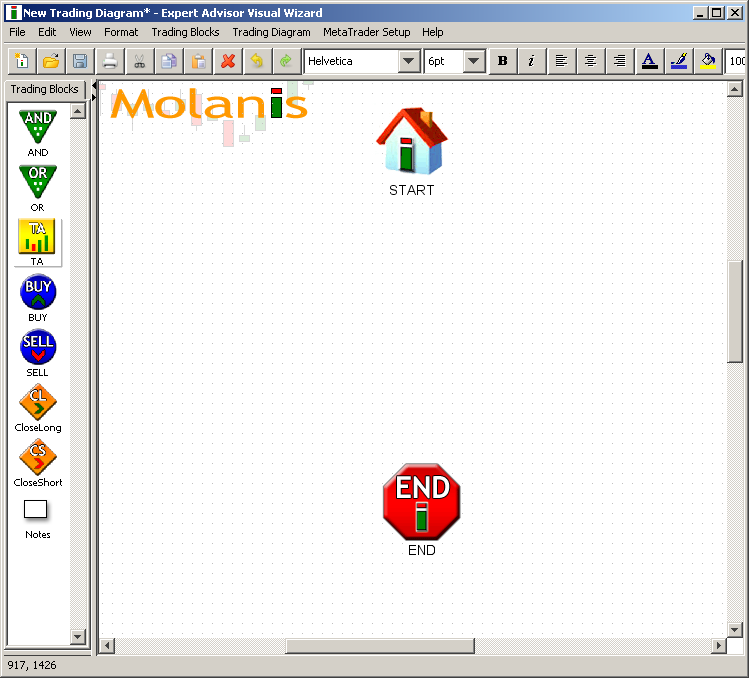
Fig. 3. Expert Advisor Visual Wizard
A. Just drag and drop two Technical Analysis blocks into the trading diagram:
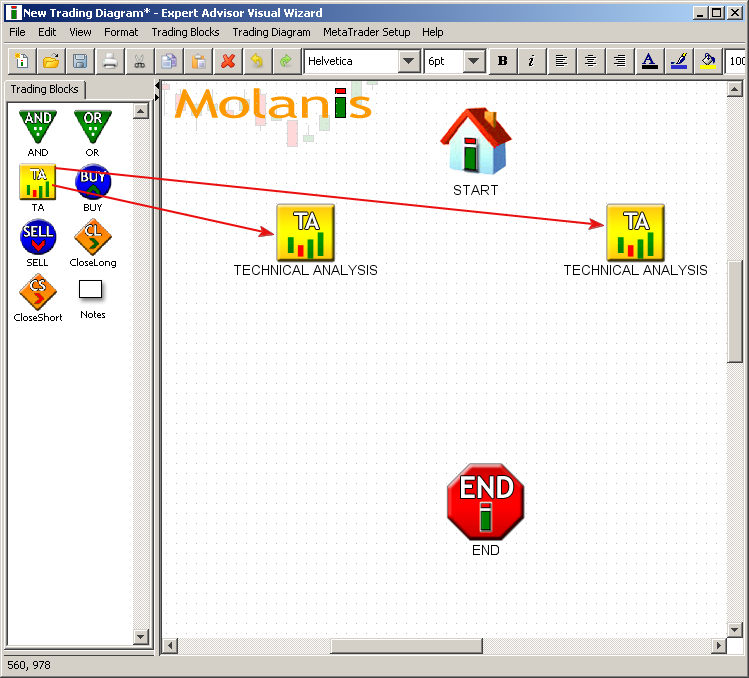
Fig. 4. Adding TA blocks
To define the moving average trading conditions, click on the TA icon and select the options as shown in the pictures:
Options to go long (or buy):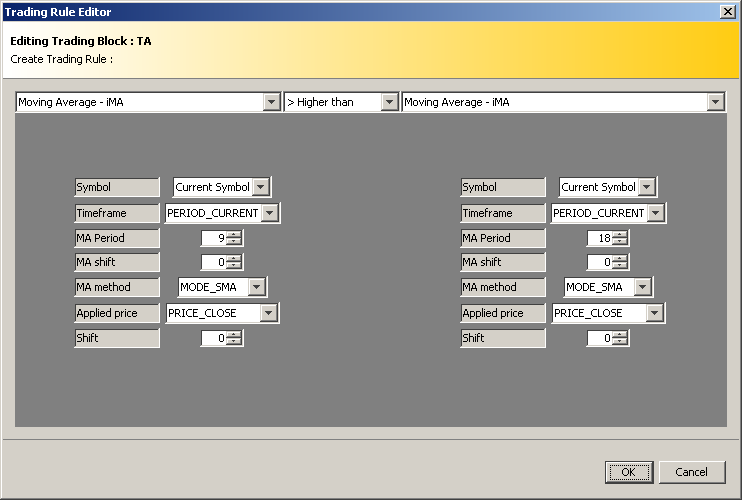
Fig. 5. Options to go long (buy)
Options to go short (or sell):
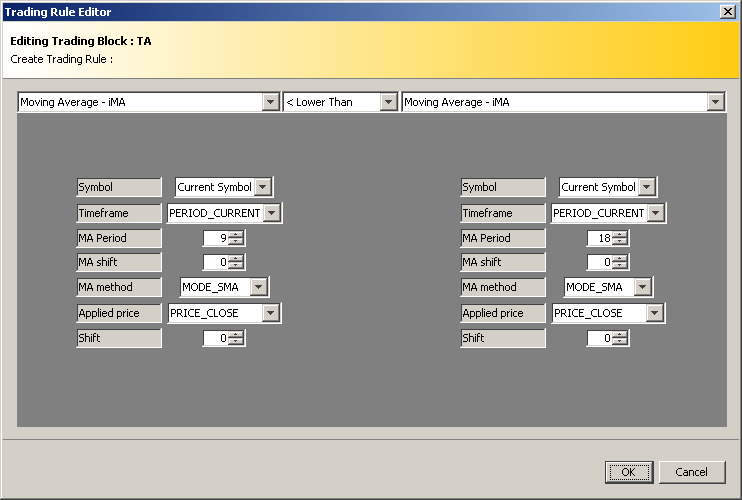
Fig. 6. Options to go short (or sell)
B. Drag and drop one BUY block and one SELL block:
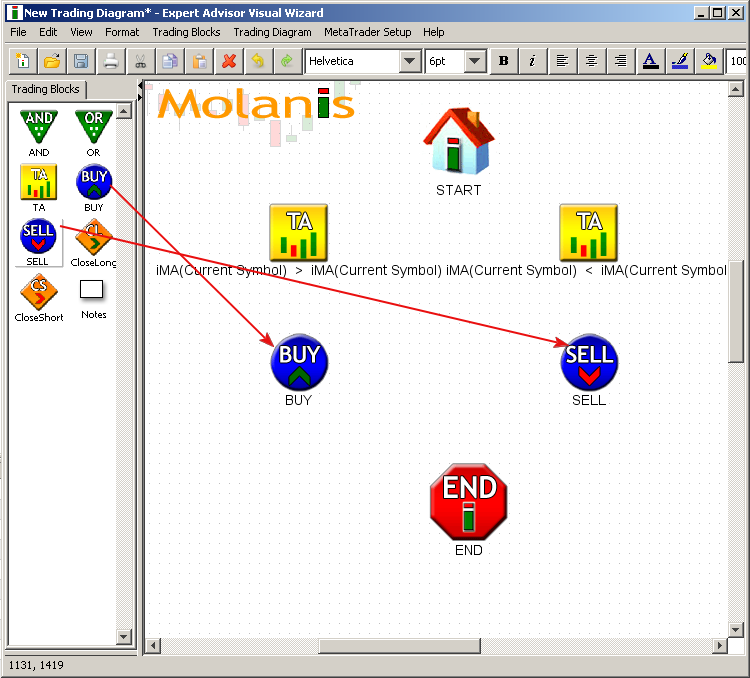
Fig. 7. Adding Buy and Sell blocks
Click on the BUY icon to define the lot size, take profit, stop loss, and trailing stops for your EA as shown in the picture:
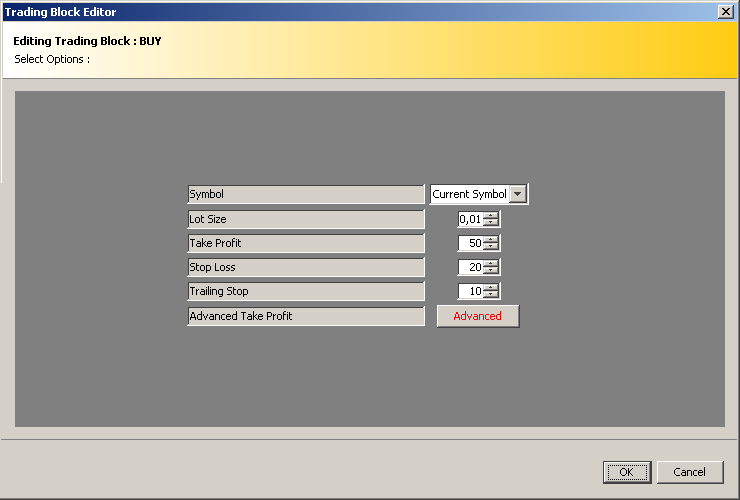
Fig. 8. Options of Buy trading block
Repeat the same procedure for the SELL icon:
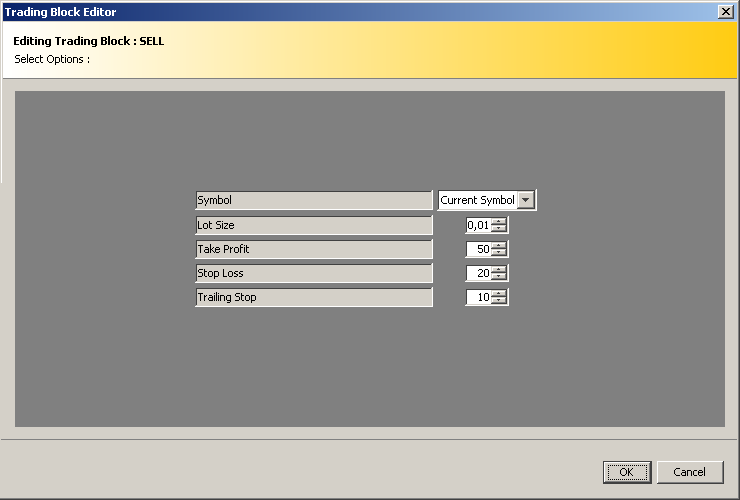
Fig. 9. Options of Sell trading block
C. Connect all the blocks to get a trading diagram like the following:
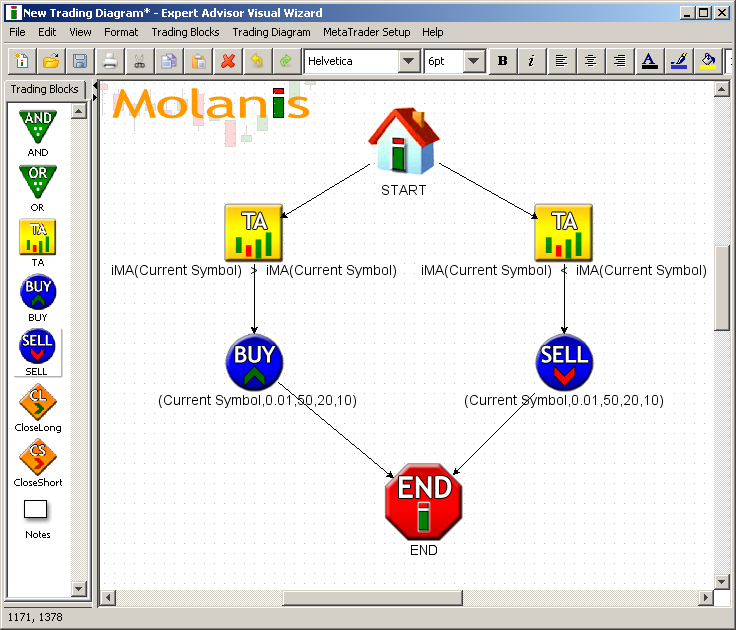
Fig. 10. Connected blocks
2. Generating the Expert Advisor
After the trading diagram is complete you need to generate the EA clicking on Generate MQL5 Code in Trading Diagram of the main menu:
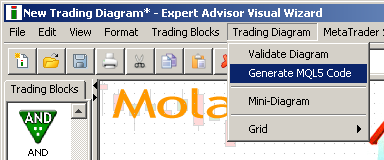
Fig. 11. Generate MQL5 code
The EA Visual Wizard transforms your trading diagram into a fully working EA. It also gives you access to the EA’s MQL5 code:
Fig. 12. MQL5 code generated
3. Trading with MetaTrader 5
After you generate the EA it will be available in MetaTrader 5 for you to trade. Just attach it to a chart to start trading.
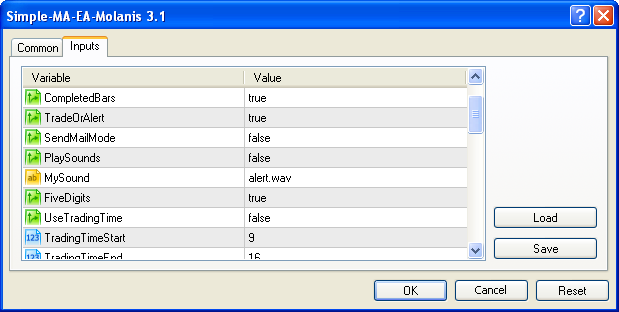
Fig. 13 Expert Advisor input parameters
All expert advisors generated with Molanis’ software have MetaTrader variables to manage:
- Trading bars or ticks;
- Alert mode (Does not trade but gives signals);
- 4 or 5 decimals;
- Time filter;
- ECN orders;
- Maximum volume size;
- Maximum percentage at risk;
- Lot size management.
4. Creating Expert Advisors that use Custom Indicators
Breakthrough of the Price Channel Range Strategy
EA logic: Positions are opened when the price pierces the borders of the Price Channel. To create this Expert Advisor we need to use the custom indicator Price Channel by Sergey Gritsay.
You can add any well-written custom indicator into the EA Visual Wizard with the Import Custom Indicator button.
Under a TA block, select Custom Indicator – iCustom, and then click on Import Custom Indicator.
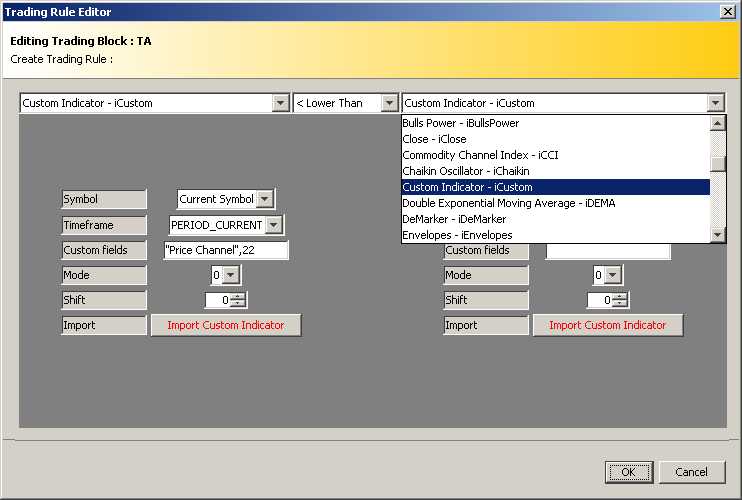
Fig. 14. Editing a trading condition
Select the custom indicator you want to import.
Custom indicators must be located in the indicators directory (terminal_data_folder_\MQL5\Indicators).
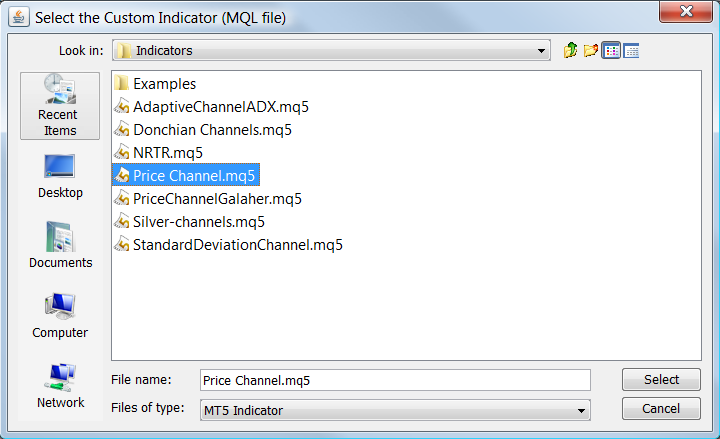
Fig. 15. Importing custom indicator
The import custom indicator feature reads the indicator code and based on standard rules of coding gets the number of modes (signals) and the indicator parameters. This feature cannot select the mode or shift for you. It's your job to know the right signal and parameters for your EA.
Fig. 16. Indicator was imported
After you finish importing the custom indicator, you can use it to define trading conditions in your Expert Advisor.
For sell:
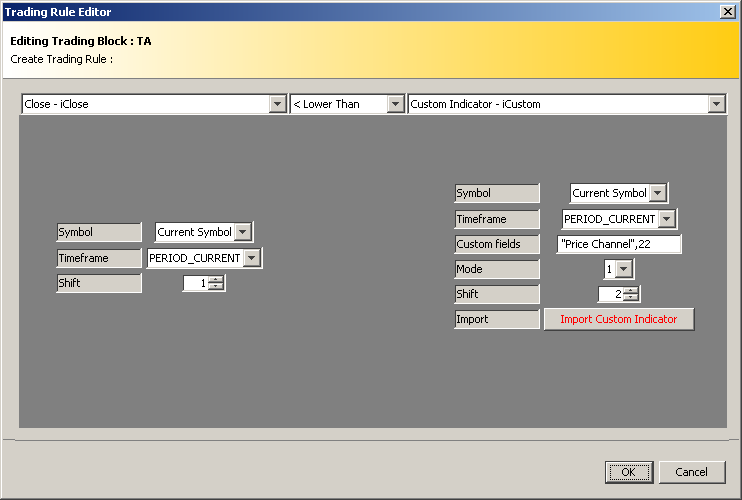
Fig. 17. Trading conditions for sell
For buy:
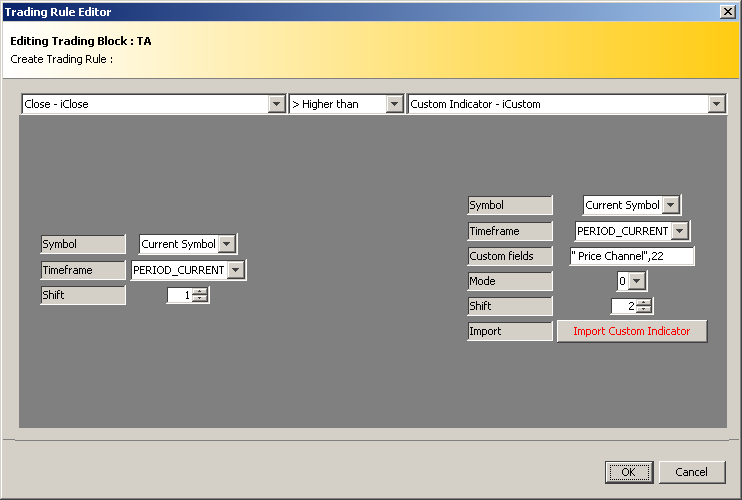
Fig. 18. Trading conditions for buy
Now, just create a setup like the one and you are done.
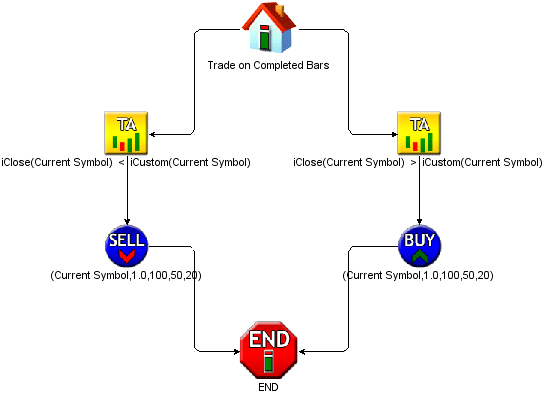
Fig. 19. The Expert Advisor diagram
Conclusion
The EA Visual Wizard is a great tool to create Expert Advisors in minutes. We have developed 15 examples based on the 20 Trade Signals in article "20 Trade Signals in MQL5". I encourage readers to review them at our examples page.
I am attaching the code for the Example 1 - simple moving average strategy explained in part 1 of this article. Example 7, Breakthrough of the Price Channel Range was used to explain the import process for part 4 of this article.
- Simple moving average;
- Multi-Currency Simple moving average;
- Multi-timeframe Simple moving average;
- Multi-timeframe Advanced Simple moving average;
- Moving Average Crossover;
- Intersection of the Main and Signal Line of MACD;
- Breakthrough of the Price Channel Range;
- RSI indicator Overbuying/Overselling strategy;
- Exit from the Overbuying/Overselling Zones of CCI;
- Exit from the Overbuying/Overselling Zones of Williams Percentage Range;
- Bounce from the Borders of the Bollinger Channel;
- ADX Adaptive Channel Breakthrough (Uses a custom Indicator);
- Bounce from the Borders of the Standard Deviation Channel (Uses a custom Indicator);
- NRTR Change of Trend (Uses a custom Indicator);
- Detect Change of Trend using the Adaptative Moving Average (AMA) indicator.
