Automatic construction of support and resistance lines
Vladimir Mametov | 23 February, 2018
Introduction
In this article, we will consider constructing support and resistance lines. The technical analysis of currency symbols is an important part of trading in financial markets. The automatic construction of these lines will simplify the work of financial analysts and traders accelerating technical analysis. Besides, the indicator described here can be used to develop Expert Advisors.
Searching for all peaks and bottoms
Support and resistance lines are plotted via local peaks and bottoms of price charts. To determine these extreme values, we will apply the well known ZigZag indicator. We can set the necessary properties for support and resistance lines in its inputs.
The scale of lines can be changed using the parameters of the ZigZag indicator, but you can apply the same parameters on different timeframes. This allows us to obtain the extreme values we need to build support and resistance levels.
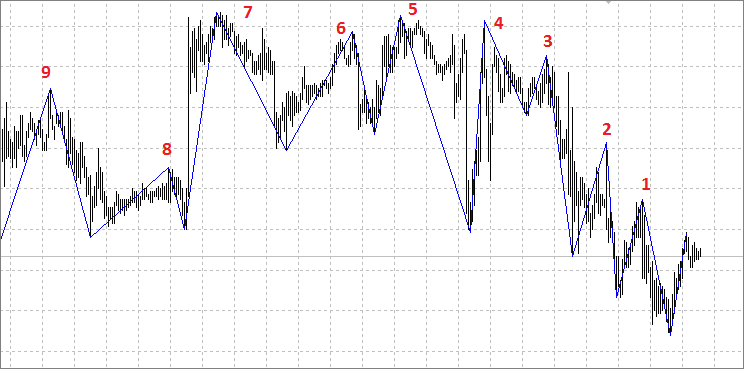
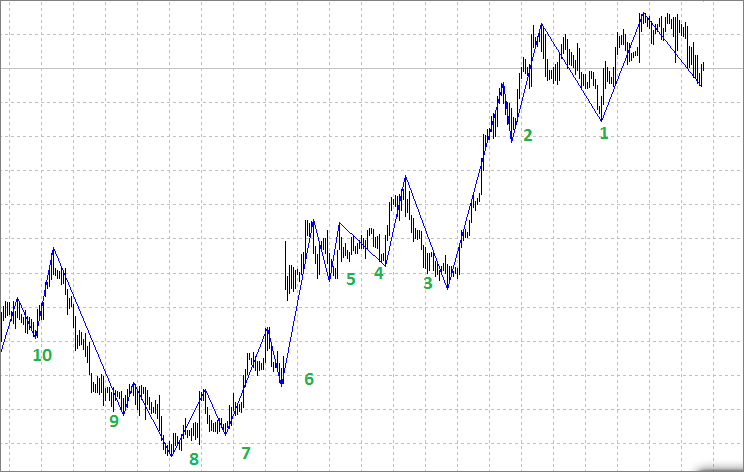
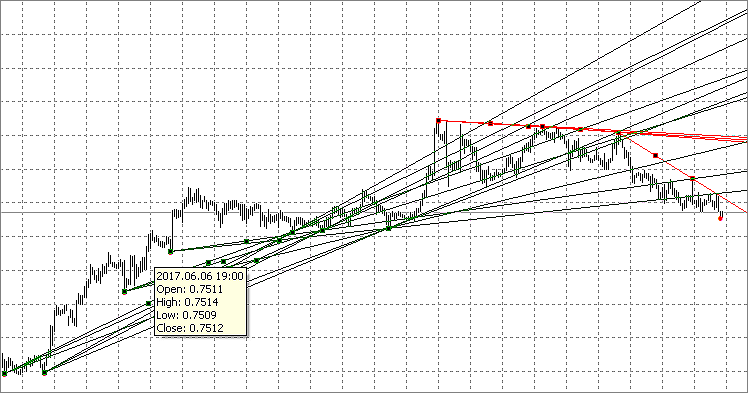
The images below show how the extreme values change with the change of a timeframe. The first image displays the minute chart encompassing a period of thirty minutes, the second one covers four hours.
Selecting suitable extreme values to construct the levels
We are going to construct only support/resistance lines located near the current price meaning they are currently relevant for us in terms of technical analysis. Also, in order for the lines to have a slope that converges to the price, we use the extreme values higher or equal to the previous one during a downtrend (for resistance lines), or lower or equal to the previous one during an uptrend. In the first image, these may be points 1-2-3-4-5-7, while in the second one — 1-2-3-6-7-8.
Now that we defined our extreme values selection criteria, let's consider implementing them in the code. We will show it here only partially, in order to clarify the main points.
//+------------------------------------------------------------------+
struct trade_points               // Define the structure for extreme values
  {
   double            price;       // Price
   int               pos;         // Location, bar index
   bool              hpoint;      // If yes, it is a peak
   bool              lpoint;      // If yes, it is a bottom
  };
Create the handle of the ZigZag indicator in the OnInit() function:
int OnInit()
  {

   ZZ_handle=iCustom(_Symbol,_Period,"ZigZag",ExtDepth,ExtDeviation,ExtBackstep);

   return(INIT_SUCCEEDED);
  }
Further, we enter data on them to the matrix by sorting through all ZigZag indicator extreme values one-by-one:
double max=close[1];
   double min=close[1];
   int z=0;

   for(shift=0;shift<rates_total && !IsStopped();shift++)
     {
      CopyBuffer(ZZ_handle,0,shift,1,ZigzagBuffer);

      if(ZigzagBuffer[0]>0)
        {

         if(ZigzagBuffer[0]>=max && ZigzagBuffer[0]==high[shift])
           {
            ArrayResize(mass,z+1);
            max=ZigzagBuffer[0];
            mass[z].price=ZigzagBuffer[0];
            mass[z].pos=shift;
            mass[z].hpoint=true;
            mass[z].lpoint=false;
            z++;
           }

         if(ZigzagBuffer[0]<=min && ZigzagBuffer[0]==low[shift])
           {
            ArrayResize(mass,z+1);
            min=ZigzagBuffer[0];
            mass[z].price=ZigzagBuffer[0];
            mass[z].pos=shift;
            mass[z].lpoint=true;
            mass[z].hpoint=false;
            z++;
           }

        }
     }
Defining criteria for constructing trend lines
Now, after forming the array with extreme values, we can construct the necessary support/resistance lines. Defining the main criteria for constructing the lines is explained on the image below.
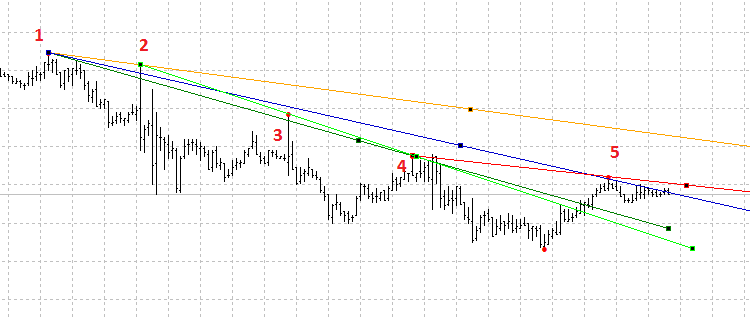
Starting with point 1, we can construct the lines via any of the following points. But not all such lines can be considered as support/resistance ones. Besides, they may lose their relevance over time becoming useless. Since we want to get rid of unnecessary graphical objects on charts, let's perform sorting discarding redundant lines.
We will assume that the starting point of the line is A, the second extreme value is B and the point near the last bar is C.
There may be multiple criteria, and their set is constantly changing in different situations. Let us consider only the basic ones. In the future, anyone can improve this indicator at their own discretion. Below are the main criteria:
- АB/BС distances ratio
- Number of times the price crosses the AB segment
- Number of times the price crosses the BC segment
- Distance from С to the current price
- Minimum and maximum line length
- Line slope
- Price location above or below the resistance line
Let's consider the above criteria in more details to better understand the inputs configuration.
- To maintain acceptable proportions, you can use the Fibo ratios and set the minimum allowable ratio to 0.25 or 0.382. According to this criterion, the length ratios should correspond to the condition АB/АС>=02.25 (0.382) and BС/АС>=02.25 (0.382). For convenience, the value of this parameter can be set in the inputs.
- All existing lines should also be thoroughly sorted by the number of times the price crosses the AB line. There are many options for how to conduct such verification. We can consider only the bars that closed breaking through this line, or we can consider a breakthrough by High/Low prices. The second criterion for this verification is the number of bars that crossed this line segment. These parameters are also made as inputs.
- We can evaluate the line importance by a number of breakthroughs, their nature and the current price location relative to the BC segment. All of the above criteria can be used both for forming a line and for forming trading strategies when developing EAs. In this indicator, we will only display the lines that have not yet crossed this segment.
- The distance from the current price to the line in the first place can be filtered according to the line's current relevance. For example, we may plot only the lines, the distance to which does not exceed 50-100 points.
- The minimum length of the line in our case is determined by the inputs of the ZigZag indicator, but this parameter can also be monitored if necessary. The indicator will check the minimum lengths of AB and BC segments.
- Since the support lines are more significant because they are used to open positions, the indicator constructs the lines with zero or positive slope for an uptrend and the lines with zero or negative slope for a downtrend.
- We can use the lines in two ways. The first one is considering only unbroken lines and trade in the direction of a trend. The second one is using only a breakthrough of trend lines for opening trades in the opposite direction. Both types of lines are important, therefore both are to be reflected in the indicator.
Below is the part of a code where resistance lines of downward trends are formed.
// Determine if the lines match our criteria and fill in the matrix for a downtrend.

   for(j=z-1; j>=0; j--)
     {
      if(mass[j].hpoint)
         for(i=j-1; i>=0; i--)
           {
            if(mass[i].hpoint)
               if(i<j)
                 {

                  a=mass[j].pos;
                  b=mass[i].pos;

                  double ratio=double((a-b)*100/a);       // Define the ratio of the AB segment to the AC total length

                  if(ratio>fibo && ratio<(100-fibo))      // Define if the criterion 1 is met, АB/BС segments ratio
                     if(b>Min_dist &&(a-b)>Min_dist)      // Define if the criterion 5 is met, minimum length of the АB and BС segments
                       {

                        ax=mass[j].price;
                        bx=mass[i].price;

                        coef=(ax-bx)/(a-b);

                        price=close[1];

                        deviation=(ax+coef*bx)-price;

                        cross_bc=0;
                        cross_ab=0;


                        if(MathAbs(deviation)<tolerance*_Point)   // Define if the criterion 4 is met (distance between point С to the previous bar's Close)
                          {

                           // Number of crossings from point a to point b
                           for(int n=a; n>b; n--)
                              if((close[n]-(ax+coef*(b-n)))>0)
                                 cross_ab++;
                           // Number of crossings from point b to the end
                           for(int n=b-1; n>=0; n--)
                              if(close[n]>(bx+coef*(b-n)) && close[n+1]<(bx+coef*(b-n+1)))
                                 cross_bc++;

                           if(cross_bc<=Intersection_bc && cross_bc<=Intersection_ab)// Define if the criteria 2 and 3 are met
                             {
                              // Filling in the matrix for a downtrend
                              ArrayResize(DownTrend,y+1);
                              DownTrend[y].a=a;
                              DownTrend[y].b=b;
                              DownTrend[y].ax=ax;
                              DownTrend[y].bx=bx;
                              DownTrend[y].dst=MathAbs(deviation);
                              DownTrend[y].coef=coef;

                              y++;

                             }
                          }
                       }
                 }
           }
     }

// Display the downward lines on the chart using the obtained matrix

   for(j=0; j<ArraySize(DownTrend); j++)
     {

      a=DownTrend[j].a;
      b=DownTrend[j].b;
      ax=DownTrend[j].ax;
      bx=DownTrend[j].bx;
      coef=DownTrend[j].coef;

      if(a>0 && b>0 && MathAbs(a-b)>0)
        {
if(a>0 && b>0 && MathAbs(a-b)>0)
        {
         //--- create trend lines
         TrendCreate(0,"DownTrend "+string(j),0,time[a],ax,time[b],bx,DColor,DStyle,DWidth,DBack,DSelection,DRayLeft,DRayRight,DHidden,DZOrder);
         ChartRedraw();
        }
     }
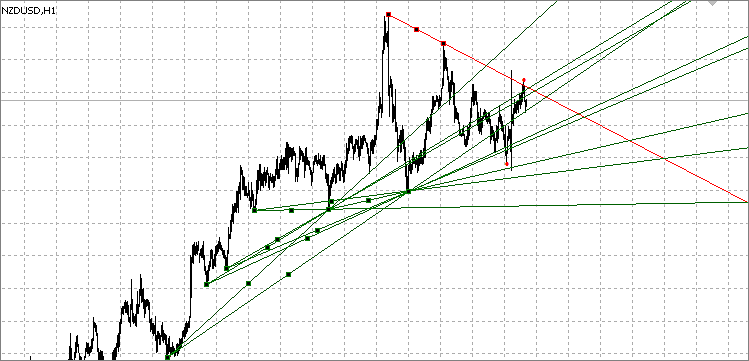
Examples of the indicator construction:
Using support/resistance lines in trading
The main trading principle applying support/resistance levels is to buy near a support line during an uptrend (and sell during a downtrend) or a flat. Some graphical models (patterns) are used as well.
This trading strategy allows you to take advantage of the trend movement, even when the financial instrument is in flat, or when the price forms a pattern. A trend helps to determine a trading direction. For example, if the current trend is downward, but then goes flat, then it is preferable to open sell trades near the resistance line, rather than buying at the support level. The presence of a downward trend means that sell trades have a better chance of success than buy ones. If a trend is upward and is followed by a triangle, then it is better to open buy trades near this triangle's support line.
Opening trend-following trades near support/resistance lines may bring profit, but the price often breaks through these levels. Therefore, we need to wait for confirmation of the significance of this level for a particular financial instrument. Before buying or selling on the line, you need to wait till the price consolidates near it. Alternatively, you can wait for the price rebound from the level, and open a trade only after that.
When opening buy trades from the support line, it is reasonable to wait for the price consolidate near it and open a buy order after the price breaks through the consolidation area's High. This ensures that the level actually affects the price and also that the price starts moving in the necessary direction (up) from the level. This is exactly what we need to perform a buy trade. A similar situation occurs when opening sell trades from the resistance line: you need to wait for the consolidation near the resistance area and open a trade when the price falls below the area's Low.
When open a trade, make sure to forecast the conditions for closing it. When opening a buy trade from a support line, it is advisable to close it before the price reaches a strong resistance line. A similar situation occurs when opening a sell trade. You can also close deals on secondary support/resistance levels. When buying on the support line, you need to sell at the resistance level in an ascending trend channel. You can also try to obtain a bigger profit if you let the price break through the level. For example, when buying from a support level in a triangle (during a general upward trend), you can hold the position until the price breaks the triangle and continues moving up. After that, you may exit a trade on the next resistance line.
The indicator-based EA
Below is the EA with the following functions:
- StopLoss and TakeProfit
- Maximum number of Buy/Sell orders
- Trailing Stop
- Breakeven
- Closing opposite trades by the indicator signals
- Four HTF filters (MACD, RSI, WPR, MA) with an ability to choose
The EA works directly with the trend lines generated by the indicator. Therefore, it needs the indicator to be launched on the same chart to work in real time. The indicator settings are configured in the indicator itself. The EA also has the indicator settings, but they are only used for testing purposes. In order to test the EA, the indicator handle defined when initializing the EA has been created in the code.
There are three EA operation modes:
- from level — trading in direction of a potential price roll-back from a trend line. A trade is opened if the bar's High or Low crossed the level, while the Close price did not break the current trend line, and the price of the next bar closed without breaking the line as well. The EA checks if the line was broken by the price after touching it.
- level breakdown — trading in direction of a trend line potential breakthrough. A trade is opened if the bar's High or Low crossed the level, while the Close price did not break the current trend line, and the candle of the next bar closed breaking the trend line.
- all — both modes described above are used.
Below is a function in the code where signals for buying and selling are formed:
//+------------------------------------------------------------------+
int signal()
  {
   int res=0;

   int macd=0;
   int rsi=0;
   int wpr=0;
   int ma=0;

   if(Use_macd==true)macd=macdS();
   if(Use_rsi==true)rsi=rsiS();
   if(Use_wpr==true)wpr=wprS();
   if(Use_ma==true)ma=maS();

   CopyOpen(NULL,0,1,3,O);
   CopyHigh(NULL,0,1,3,H);
   CopyLow(NULL,0,1,3,L);
   CopyClose(NULL,0,1,3,C);

   Signals=0;
   for(int i=0;i<ObjectsTotal(0,0,OBJ_TREND);i++)
     {
      string sName=ObjectName(0,i,0,OBJ_TREND);
      if(StringFind(sName,"UpTrend")==0 || StringFind(sName,"DownTrend")==0)
        {
         ax=ObjectGetDouble(0,sName,OBJPROP_PRICE,0);
         bx=ObjectGetDouble(0,sName,OBJPROP_PRICE,1);
         p1=(int)ObjectGetInteger(0,sName,OBJPROP_TIME,0);
         p2=(int)ObjectGetInteger(0,sName,OBJPROP_TIME,1);
         a=iBarShift(p1);
         b=iBarShift(p2);
         kkk=(bx-ax)/(a-b);
         lvl=bx+kkk*b;
         plvl=bx+kkk*(b-1);

         if(mode==0 || mode==2)
           {
            if(StringFind(sName,"UpTrend")==0 && L[1]<=plvl && C[1]>plvl && C[0]>lvl)Signals=1;
            if(StringFind(sName,"DownTrend")==0 && H[1]>=plvl && C[1]<plvl && C[0]<lvl)Signals=2;
           }

         if(mode==1 || mode==2)
           {
            if(StringFind(sName,"UpTrend")==0 && L[1]<=plvl && C[1]>plvl && C[0]<lvl)Signals=2;
            if(StringFind(sName,"DownTrend")==0 && H[1]>=plvl && C[1]<plvl && C[0]>lvl)Signals=1;
           }
        }
     }

   if(Signals==1
      &&(macd==1 || Use_macd==false)
      && (rsi==1 || Use_rsi==false)
      && (wpr==1 || Use_wpr==false)
      && (ma==1 || Use_ma==false))res=1;

   if(Signals==2
      &&(macd==2 || Use_macd==false)
      && (rsi==2 || Use_rsi==false)
      && (wpr==2 || Use_wpr==false)
      && (ma==2 || Use_ma==false))res=2;

   return(res);
  }
//+------------------------------------------------------------------+
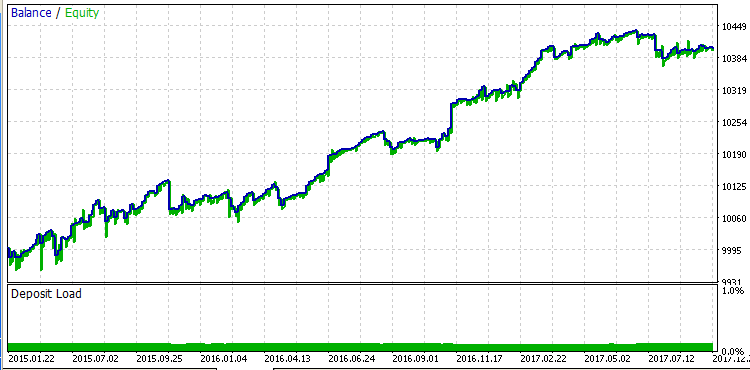
The tests have shown that the profitability of the roll-back trading is lower compared to the breakthrough one.
Below are the test graphs of testing three modes with the following inputs:
input string s="-------------------------------------------"; // Main settings
input int Magic=12345;
input double LotSize=0.1;
input int Slippage=30; //Slippage, points
input int StopLoss=0; //StopLoss, points
input int TakeProfit=0; //TakeProfit, points
input int TrailingStart=0; //Trailing Start, points
input int TrailingStop= 0; //Trailing Stop, points
input int TrailingStep= 0; //Trailing Step, points
input int SL_prof=0; //Start BE, points
input int SL_lev=0; //BE level, points
input int Buy_max=1; //Max Buy orders
input int Sell_max=1; //Max Sell orders
input bool Sig_close=true; //Close counter transactions
input tip mode=0;
input string s0="-------------------------------------------"; // Indicators settings
input int _ExtDepth=12;
input int _ExtDeviation=5;
input int _ExtBackstep=3;

input int _Min_dist=0;                                  // Minimum distance
input int _fibo=30;                                     // Fibo ratio
input int _tolerance=200;                               // Tolerance
input int _Intersection_ab=1;                           // The allowed number of intersections from point a to point b
input int _Intersection_bc=1;                           // The allowed number of intersections from point b to point c

input string s1="-------------------------------------------";     // MACD settings
input ENUM_TIMEFRAMES macd_tf=PERIOD_CURRENT;                      // period
input int fast_ema_period=12;                                      // period of fast ma
input int slow_ema_period=26;                                      // period of slow ma
input int signal_period=9;                                         // period of averaging of difference
input ENUM_APPLIED_PRICE applied_price=PRICE_CLOSE;                // type of price

input string s2="-------------------------------------------";     // RSI settings
input ENUM_TIMEFRAMES rsi_tf=PERIOD_CURRENT;                       // period
input int rsi_period=14;                                           // period
input ENUM_APPLIED_PRICE rsi_applied_price=PRICE_CLOSE;            // type of price
input double rsi_max_s=100;                                        // max price for Sell
input double rsi_min_s=70;                                         // min price for Sell
input double rsi_max_b=30;                                         // max price for Buy
input double rsi_min_b=0;                                          // min price for Buy

input string s3="-------------------------------------------";     // WPR settings
input ENUM_TIMEFRAMES wpr_tf=PERIOD_CURRENT;                       // period
input int calc_period=14;                                          // period
input double wpr_max_s=0;                                          // max price for Sell
input double wpr_min_s=-20;                                        // min price for Sell
input double wpr_max_b=-80;                                        // max price for Buy
input double wpr_min_b=-100;                                       // min price for Buy

input string s4="-------------------------------------------";     // MA settings
input ENUM_TIMEFRAMES ma_tf=PERIOD_CURRENT;                        // period
input int ma_period=10;                                            // period of MA
input int ma_shift=0;                                              // shift
input ENUM_MA_METHOD ma_method=MODE_SMA;                           // type of smoothing
input ENUM_APPLIED_PRICE ma_applied_price=PRICE_CLOSE;             // type of price

input bool Use_macd=true;                                          // Use MACD as a filter
input bool Use_rsi=false;                                          // Use RSI as a filter
input bool Use_wpr=false;                                          // Use WPR as a filter
input bool Use_ma=false;                                           // Use MA as a filter

input int sbar=1;                                                  // Signal bar 0-current, 1-close
During the tests, only one trade of 0.1 lot was opened in one of the directions. In case of an opposite signal, the current trade was closed and the opposite one was opened. The MACD filter was applied, meaning that buy trades were opened with the indicator values less than zero, while sell ones were opened with the indicator values above zero. The test was performed on EURUSD H1 for 2015-2017.
From level:
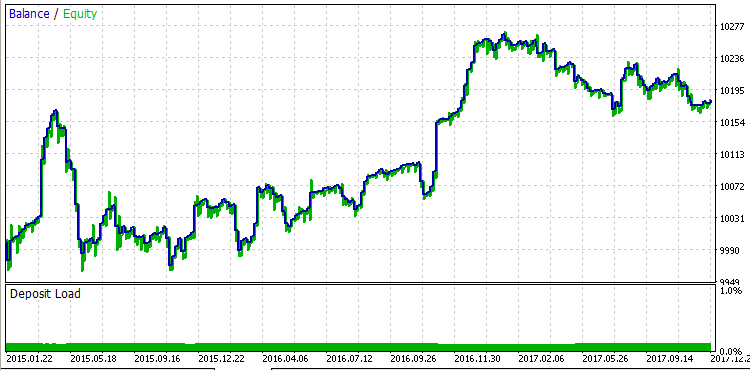
Level breakdown:
Below are the test results with the default settings on several currency pairs.
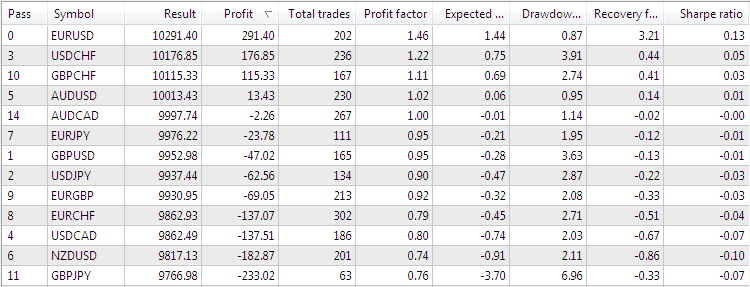
Here we can see that good results are shown only on EURUSD and USDCHF. First of all, this is due to the fact that not all lines should be considered when trading. We also need to consider other factors listed at the beginning of the article.
In addition, we should keep in mind the influence of fundamental analysis, since support/resistance lines are very often broken through after a release of important news.
Therefore, it is possible to add a news filter to the EA and test the work both only at the time of news releases and after disabling trading during news completely. Alternatively, the EA can be used on RENKO charts.
Optimization
In my opinion, the first seven parameters already have the optimal values, therefore I have not optimized them further. ZigZag parameters are set by default and do not fit a bit. When optimizing, it was possible to establish that the most suitable parameter values for all previously tested currencies are the following:
- _ExtDepth=24;
- _ExtDeviation=55;
- _ExtBackstep=9;
To open trades during optimization, we defined which operation mode was more suitable for a certain financial instrument and how strong the filter's impact on the result was. Only MACD indicator was used as a filter. But you can try any other indicators on different timeframes.
The function of closing by an opposite signal was used to close a profitable or loss-making trade. To fix the profit and get the maximum result, the breakeven and take profit functions were used. The optimal parameters for each currency were determined during the test for these functions.
No stop loss was used. Loss-making trades were closed only by an opposite signal.
The optimization is shown in the table. The test was performed with a lot size of 0.1 for 2017. Also, the number of open buy and sell trades was increased to 10, all other parameters were set by default.
| Symbol | Mode |
MACD filter | TakeProfit |
Start BE |
Profit |
Profit Factor: | Recovery Factor: |
Max DD,% |
Total Trades: | Profit Trades,% |
|---|---|---|---|---|---|---|---|---|---|---|
| EURUSD |
level breakdown |
false |
0 |
25 |
117.20 |
1.88 |
1.65 |
0.69 |
79 |
73.42 |
| USDCHF |
level breakdown | false | 20 |
10 |
135.24 |
1.31 |
1.12 |
1.03 |
482 |
72.41 |
| GBPCHF |
from level |
true |
20 |
10 |
91.56 |
1.39 |
0.51 |
1.58 |
246 |
91.06 |
| AUDUSD |
level breakdown | false | 20 |
10 |
139.20 |
1.39 |
1.66 |
0.79 |
485 |
71.96 |
| AUDCAD |
level breakdown | true | 25 |
5 |
117.51 |
1.94 |
1.06 |
0.57 |
246 |
84.96 |
| EURJPY |
level breakdown | false | 20 |
5 |
128.90 |
1.60 |
0.98 |
1.26 |
341 |
78.89 |
| GBPUSD |
from level | false | 100 |
0 |
102.1 |
1.20 |
1.32 |
0.58 |
274 |
52.92 |
| USDJPY |
from level | false | 30 |
0 |
147.75 |
1.56 |
0.79 |
1.73 |
348 |
79.89 |
| EURGBP |
from level | true | 20 |
5 |
124.45 |
1.39 |
1.14 |
1.03 |
341 |
78.01 |
| EURCHF |
from level | true | 20 |
5 |
141.08 |
2.07 |
1.88 |
0.68 |
367 |
63.22 |
| USDCAD |
level breakdown | false |
100 |
25 |
142.57 |
1.46 |
0.45 |
1.22 |
248 |
78.87 |
| NZDUSD |
from level | false | 0 |
25 |
270.50 |
1.37 |
1.04 |
2.37 |
616 |
62.11 |
| GBPJPY |
level breakdown | true | 150 |
20 |
163.62 |
2.56 |
1.10 |
1.41 |
103 |
68.25 |
Conclusion
In this article, we considered the basic principle of automatic construction of support and resistance lines. This principle was used to develop an EA and optimize the inputs on 13 financial instruments. To obtain the maximum result for a specific financial instrument, you need to individually select its optimal parameters. The EA having a number of basic functions and four HTF filters has been developed to find the optimal parameters, automate trading and check the work by support/resistance lines. The indicator and the EA can be expanded and improved depending on specific needs.
It was found out that the roll-back trading is less profitable than the breakthrough one for some currencies. This shows that each financial instrument moves in a unique way requiring an individual approach.