How to conduct a qualitative analysis of trading signals and select the best of them
Rustem Bigeev | 6 September, 2017
Introduction. What to do if you cannot trade on your own?
When we perform a trade, our ultimate goal is to make profit or at least find out whether that is possible if only theoretically. Trading just for the love of it is practically impossible since that would require significant and constant expenses. Almost no one is able to learn all the ins and outs of trading and start obtaining a stable result at an acceptable time interval. To get the desired result, traders need a combination of four main factors, namely Knowledge, Money, Industriousness and Favorable environment. All these factors are necessary for success.
Some traders lose their money and leave (to come back again), some relocate their efforts to the near-market service industry, while others try to find someone more skillful to follow their trades. The objectives in the latter case are different. Some traders want to understand why someone succeeded in the market where they themselves failed. Others want to save their efforts by simply following the path of a more efficient trader, while being able to adjust the speed of the movement according to their needs. The main thing is for the "leading" trader to move in the right direction, and most importantly - without stumbling.
The present-day market development allows anyone having a couple of hundred dollars to join the exciting world of financial markets and become an investor. For example, you can buy shares and other securities. You can also hire a personal manager. Any of these approaches has positive and negative sides. Financial success is always based on two main factors — selection of the right assets and appropriate management. Both factors are equally important. Only an efficient combination of the right assets and competent management leads to growth of funds on a long-term basis.
If we briefly consider the issue of choosing the right assets (there is a huge amount of materials on this topic), we can identify the main theses that characterize them - liquidity, volatility and reliability of an issuer. If the asset you have chosen possesses all these qualities, then it is time to move on to management issues. Out of a huge number of "right assets", the ones issued by a state are considered the most promising nowadays. These are currencies, government bonds and shares of state or state-owned companies. Currencies are considered to be the most efficient asset. Therefore, they have the highest liquidity and volatility.
High liquidity means high opportunity to succeed in the long term. That is why investors and managers are generally attracted by the most liquid and volatile markets.
Now, let's turn to management issues.
Searching for the fastest horse. Signals Service
As noted above, the most appropriate assets are currencies that are traded around the clock and have the highest liquidity, volatility and reliability. Therefore, it would be reasonable to dwell in detail on the currency trading issues. We are not going to discuss here how to trade currencies. Instead, we are going to focus our attention on how to choose someone who can do this incomparably better than us.
Today, there are multiple services where efficient traders offer their services (social trading). There are paid and free offers in this market. Keep in mind that not all paid offers are actually worth their price tags, while some free offers can easily compete with paid ones. Therefore, we will not discard free signals and analyze them together with paid ones. This website already has a number of articles on how to choose signals. The distinguishing feature of the present article is that we are going to apply additional parameters for evaluation. These parameters are not included in the "standard delivery" and signal rating calculation.
To do this, we we will use a custom script providing the necessary parameters.
Most subscribers pay attention only to the three most evident parameters when selecting a suitable signal. These parameters are Growth, Subscribers and Drawdown. We do not take negative growth accounts into account here since they deserve a separate study on how not to trade. Before deciding on subscribing to a signal, we should thoroughly analyze multiple signals and find out how the profit displayed in the report was formed. This will help us develop our custom method of signals analysis and selection.
You may argue that as soon as the balance is growing, there is no point in worrying about how the signal provider earns money. I completely disagree with this. Profit should be earned correctly, otherwise a highly likely loss may ruin the entire previous success. I would rather prefer a signal provider who is not too profitable in percentage terms but trades correctly in terms of trades implementation. If you are concerned about the absolute profit, it can be easily improved by increasing the trades volume or the leverage, thus increasing the risk as well.
As you know, past results cannot guarantee their repetition in the future, but at least the legal activity does not get in trouble with the law. This means, the correct approach to management will not raise questions among qualified investors who analyze signal statistics and decide on subscription.
What is an appropriate management? Let me use the following analogy: appropriate brick laying means that walls are not only level but also solid. This parameter depends much on bricks geometry and quality. Even if you are an 80 level bricklayer, you will not achieve the desired result if bricks are crumbling in your hands. In our case, bricks are trades. In other words, a signal provider should perform perfect trades. In turn, we use that trades to "erect" our own constructions. Preferential distribution of trades in the direction of perfect ones gives us a high degree of confidence that the probability of failure is minimal.
So, we have gradually arrived at the perfect deal concept. Let's introduce some limitations for more objectivity. First, we will consider only the events that happened within opening and closing a trade. Second, taking into account events that happened before opening and after closing a trade (for example, the price has moved 100 500 points after closing a trade) is optional. Considering this, a perfect trade is the one that moves into profit and is closed by take profit. The entire price movement has been fully implemented in a trade during its lifetime, and it did not carry serious risks for an investor by spending most of its time in the red zone.
In real trading, perfect trades are infrequent, therefore, this definition serves as a kind of benchmark for us, relative to which all other trades are evaluated. If distribution of most trades is close to perfect, then this is the signal that we are looking for.
Any complete trade can be estimated by two basic parameters — Entry quality and Exit quality.
Entry quality assumes that a trade did not carry serious risks during its lifetime being in profit most of the time. Exit quality defines the profit percentage fixed relative to the potential maximum profit within the trade's lifetime. The sum of these parameters provides the general trade quality. Quantitatively, these two parameters can be expressed in the following equations.
Entry quality K(In) = 1/(1 + MАE/Result)
Exit quality K(Out) = Result/MFE
where:
Result — trade result.
МFЕ — maximum floating profit.
MАE — maximum floating loss.
The composite parameter K(Deal) = K(In) + K(Out)
As you understand, this parameter is equal to 2 in case of a perfect trade. All other trades should strive to this value.
Another parameter is a trade comfort for an investor. The comfort parameter may seem subjective but it is nevertheless important for someone who invests money in a virtual funds manager. Many who entrusted their funds to a manager have certainly noted a strange and unpleasant feeling when open positions are hovering in the red zone for quite a long time with a probability of further losses increasing. Comfort is an opposite feeling arising when the equity of your account exceeds the balance. At such moments, you may even experience happiness and a strong belief that the Grail has finally been found. I am considering this case from the investor's point of view at the moment. Most probably, my reflections on the matter may not be much to signal providers' liking. Nevertheless, if signal providers want to be popular among investors and establish a long-term cooperation with them, they need to take these psychological features into account.
So, how can we define such subjective parameter as the trade comfort in qualitative form? The key factor here is not price but time. We need to fined out how long the trade was in profit and loss within its lifetime. The more time the trade spent in a loss, the less it is comfortable for an investor, and vice versa.
To define this, we need to analyze trades on minute timeframes. Regardless of a timeframe applied by a signal provider, M1 is the lowest timeframe in MetaTrader 4 providing the most detailed picture.
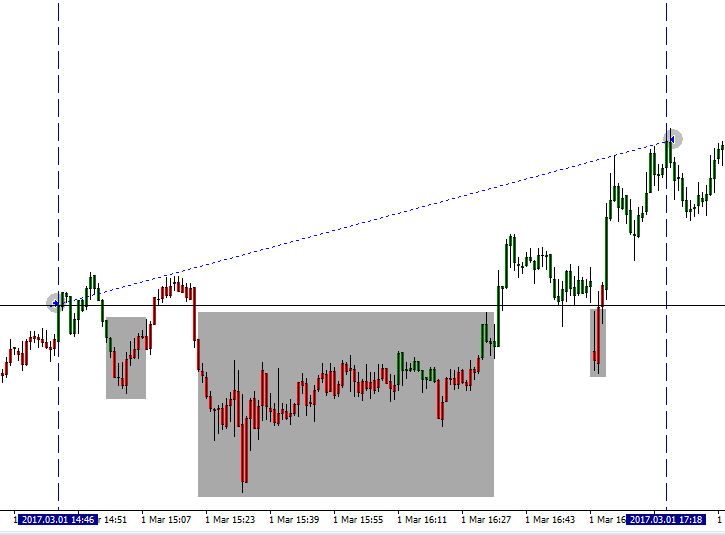
The trade lifetime is highlighted by two vertical lines on the chart. Open and close points are set as well. All further calculations are performed relative to the trade's open level. As can be seen in the figure, there is a certain amount of bars (gray rectangles) fully formed below the buy trade's open level. For such bars, High < OpenPrice. Besides, there are also bars fully formed above the trade's open level (Low > OpenPrice). The first type of bars is the most uncomfortable for investors since the trade was in the red the entire time such bars were forming. The second type of bars is comfortable since the trade showed a floating profit during their forming.
Let's adopt the following conditions to introduce a quantitative parameter. Comfortable bars are equal to 1, while uncomfortable ones are equal to -1. Bars formed near the open price (Low < OpenPrice, High > OpenPrice) are equal to 0.
Next, we calculate the ratio of comfortable and uncomfortable bars according to the following equation:
K(Comfort) = (ProfitBars/TotalBars) - (LossBars/TotalBars)
where:
ProfitBars — number of bars fully formed in the green.
LossBars — number of bars fully formed in the red.
TotalBars — total number of bars within the trade's lifetime.
If a trade was opened and closed within one minute, the parameter is automatically assumed to be equal to 1 since the trade's lifetime was extremely short and an investor simply did not have enough time to evaluate the trade.
Thus, the parameter will have a range of values from -1 (completely uncomfortable) to 1 (most comfortable).
Thus, we have two parameters defining a trade's quality and its comfort from investors' perspective. Now, let's have a look at these parameters in the trading process.
Note. Loss-making trades are not considered since our current objective is to detect factors that generate profit. Losses are perceived as an inevitable part of trading and evaluated only in proportion to obtained profit. The in-depth analysis of loss-making trades is the matter of concern for signal providers if they want to improve the quality of their trading.
Script
The script has been developed to obtain the source data. Its operation principle is as follows: it analyzes data by trades available to a potential signal subscriber on the "Trading history" tab of a signal page. The history file can be downloaded in the *.csv format.
 To do this, click "Export to CSV" and save the file.
Next, the script processes the following trade parameters:
- Trade open date/time
- Symbol
- Trade direction
- Open price
- Trade close date/time
- Trade close price
The script applies these parameters to reproduce all processed trades using quotes provided by my broker. If trade open and close prices do not fit into the range based on historical quotes, such a trade is marked as "Incorrect Open or Close price" and discarded from subsequent calculations. In the course of my work, I also had to solve an issue of synchronizing quote time at different brokers. As it turned out, almost every broker tries to establish its own time shift from GMT.
I used the terminal from the "А..." company with the S... real trade server. All trade parameters were compared with quotes from this server. After processing the data of the top-5 MetaTrader 4 signals, the variation of quote matches among the providers' trade servers and my broker's server comprises 27.3-99.6% of the total number of profitable trades. I have set a fairly large possible slippage equal to 50 (!) points (5 digits). This parameter sets the range of possible price differences at different brokers to take as many trades into account as possible.
I downloaded and re-wrote the entire minute bars history in advance to avoid "broken" bars in time series for as much as possible.
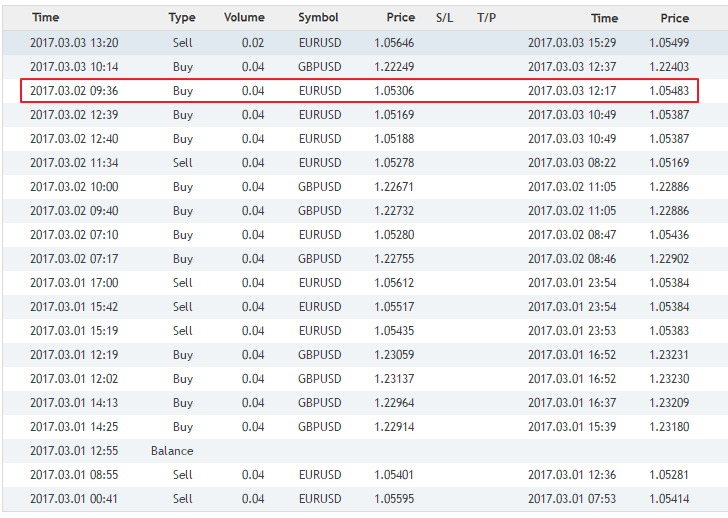
To examine the differences, let's consider one trade with its parameters highlighted on the image.
The differences looked like in the screenshot below.
The vertical dotted lines represent opening and closing the trade, while price labels are trade execution prices on the master account. Now, compare this picture with the prices present on my terminal's chart. The opening is normal (almost at one price) but that is not the case with closing. If there are a lot of such trades relative to their total number, subscribing to such a signal will not bring you anything except headaches and losses.
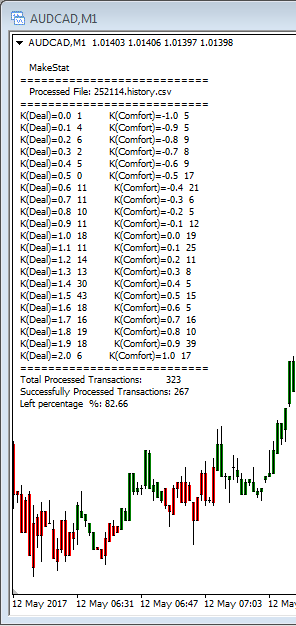
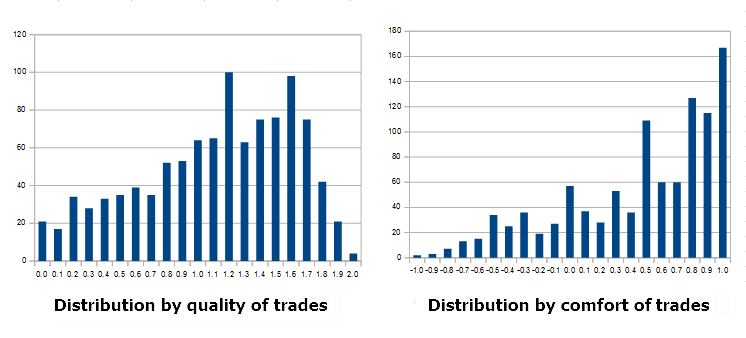
The script operation result is shown on the image below. The table of values for plotting the variation diagram has been calculated and the quotes match percentage is 82.66%. According to the settings, parameters of 56 trades did not fit into the quotes price series provided by my broker even when using slippage.
What are the conclusions?
First. All is not gold that glitters. If the differences are large for most trades, the signal is not suitable for subscription.
Second. To avoid such differences, it is often recommended opening an account with the same broker the master account is working at. But what if I am comfortable with my broker and I do not trust another one? The most reasonable solution is to pay attention to the signals working from the same trade servers as your quotes. The second approach is to search for signals having minimal differences from quotes.
For more clarity, let's analyze several distribution diagrams. The history of trades performed by five MetaTrader 4 top signals from the official rating (at the time of writing this article) is used as a source data.
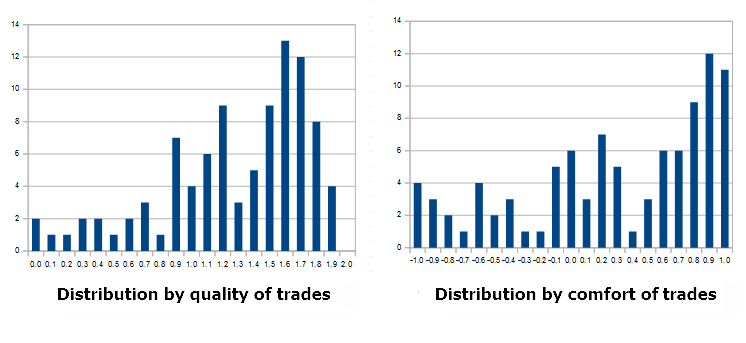
#1 of the rating. Signal ID 129797.
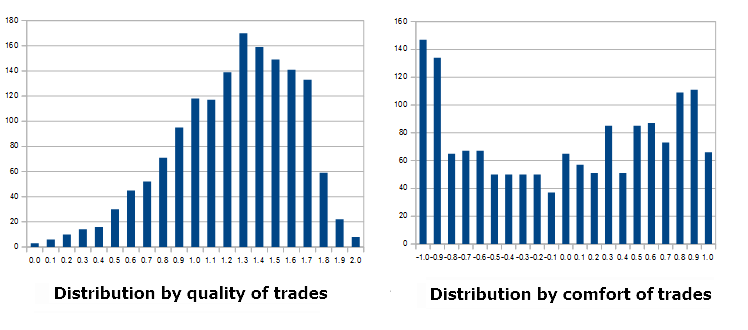
1557 profitable trades successfully processed out of 1563 (99.6%). This means a fairly high match of quotes between the provider's and my broker's servers. 0.4% of trades are differences by prices (the example has been described above). As for the diagram of trades quality variation, we can see that most trades are of fairly high quality. The variation "hunch" falls to "1.3-1.4", which is close to the normal average level. However, I do not like the trade comfort distribution since many trades spent in the red most of their time. Besides, the variation "hunch" is shifted to the left, which is not very good.
#2 of the rating. Signal ID 129369.
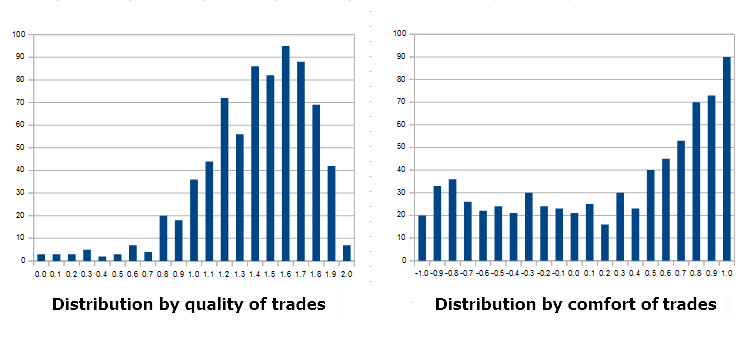
745 profitable trades successfully processed out of 1900 (39%). The quotes match level is very low making the signal unsuitable for me. However, the trades quality and comfort distributions are very good. This signal can be recommended to those traders who have a minimal difference in quotes.
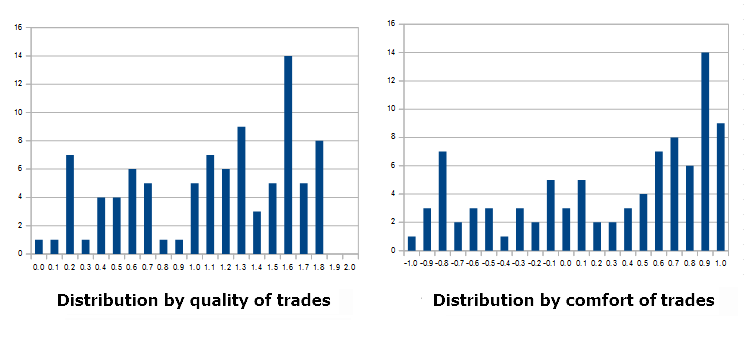
#3 of the rating. Signal ID 252114.
268 profitable trades successfully processed out of 315 (85.6%). In other words, the quotes match level is quite high. Let's turn to the variation diagrams. The trades quality "hunch" falls to "1.5". This is above average and acceptable. However, the picture is not so rosy in terms of the trades comfort. This may indicate that the provider does not have a clear system for exiting trades: some trades are waited out, while some remain comfortable enough for subscribers.
#4 of the rating. Signal ID 274582.
95 profitable trades successfully processed out of 348 (27.3%) at a specified slippage of 50 points! The quotes match level is very low. Meanwhile, the distribution diagrams show the above average level. This means, the signal can be considered for subscription provided there is not such a catastrophic difference in quotes.
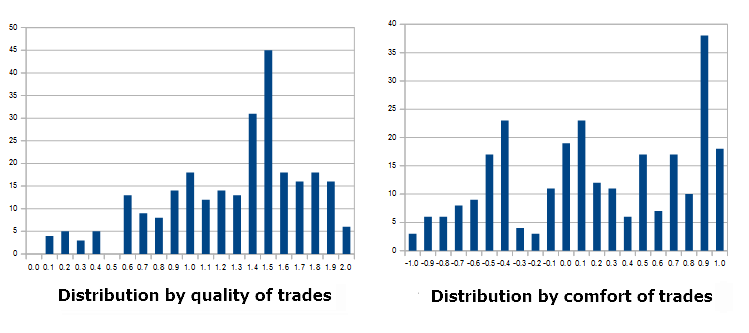
#5 of the rating. Signal ID 250456.
93 profitable trades successfully processed out of 95 (97.9%). The quotes match level is very high: the trades quality variation "hunch" falls to 1.6. This is above average. Distribution by trades comfort looks good as well. The signal can be considered for subscription. The drawback is a very small number of trades closed by TakeProfit.
So, what are the conclusions?
Only two signals clearly fit my conditions out of top five ones, and one of them has an insufficient quotes match level. If we conduct such calculations further into the rating, we will be able to find worthy signals. However, the further we go, the lower the parameters meaning we need to carry out a large amount of calculations in order to find something suitable. The profitability of a signal is not of much importance here. The most important parameters are trades quality, comfort, minimal drawdown and maximum percentage of profitable trades in history.
Before finishing this section, let me provide the results of processing a popular free signal. I am not disclosing its ID, but this is one of the oldest signals in the service (it is already more than 150 weeks old). There is no point in commenting on the results. It is only worth mentioning that the quotes match level between the servers has comprised 71%.
Looking good!
I have already described above how I calculated the quality and comfort ratios. Now, it is time to make the first conclusions.
First of all, you need to pay attention to the quotes matching level between the provider's and your broker's trade servers. Even if the provider shows perfect trades with the ratio of 2, this does not mean you have found a Grail. It may turn out to be unsuitable for you since its trades are not processed the same way as on the master account. If the match level is good enough, you may proceed considering other parameters, including quality and comfort. But first you need to sort out signals by common parameters, such as profit, drawdown, account lifetime, profitable trades percentage, etc.
If you decide to use the same trade server as the signal provider, be prepared for the signal parameters to be average or even below average.
Main difficulties I faced when analyzing signals from different providers
Initially, my goal was to develop a method for calculating a custom signal rating. I was going to select signals that were most suitable for my understanding of how trades should be executed. Given the large number of the signals in the service, I believed that this task would not be too difficult. But that was not the case. There are two circumstances that can greatly complicate the life of a potential subscriber. The first one is the difference (sometimes significant!) between the quotes of various brokers most likely caused by different conditions applied to sorting price flows on trade servers. The second one is a significant reduction of the number of potential signals that not only satisfy investors in terms of trades quality but also have the minimum differences in quotes. The greatest challenge is the necessity to manually shovel tons of information in search of a hidden "gem". I was very surprised by this circumstance, but "you cannot reject what is real" (c).
IMPORTANT! In order for the results of your calculations to be as accurate as possible, pay close attention to the quality of the history of quotes uploaded to your computer. This defines the percentage of successfully processed trades. If your history has gaps, "broken" bars or is simply insufficient, your calculations are not representative. Also, pay attention to the Distribution section of the Statistics tab on the signal's page. It lists all symbols used to generate the signal. Make sure you have high-quality quote history for all of them.
How to find a suitable signal?
First, we need to form two lists of potential signals.
The first list includes signals that fall within conventional criteria offered as the search parameters. These may be Rating, Drawdown, % of profitable trades, Account lifetime, etc. Then we should use the script to calculate other parameters, the main one being the quotes matching percentage between the provider's and your broker's trade servers. If this parameter is suitable, evaluate the trade quality distribution and comfort diagrams. Do this for each signal that passed the initial filter.
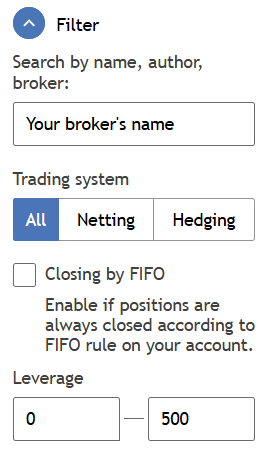
The second list contains potential signals based on the same trade sever. To select such signals, enter the name of your broker in the "Search by name, author, broker:" field of the Filter option.
After that, you will see a list of signals broadcast from your broker's servers. For more confidence, first analyze signals matching the names of your trading servers, then check all the others. Select potentially suitable signals from the list.
The signals selection algorithm looks as follows:
- Forming the list of signals that passed the initial filter.
- Forming the list of instruments traded by selected signals.
- Downloading (preferably — re-writing) the quote history for these instruments.
- Downloading trade history files for selected signals.
- Processing trade history files using the script.
- Analyzing results provided by the script.
- Forming the final list of signals suitable for subscription according to your conditions.
As our research shows, top signals of the service take their positions for a good reason. Unfortunately, not all of them are suitable for me. Changing a broker is a very troublesome task, and it is not always worth it. However, it may be reasonable, for example, if you want to diversify large amounts not just by separate accounts and signals but rather by different brokers.
A few tips for avoiding pitfalls
Manage your risks. Any risk management strategy implies diversification and limitation. Do not put all your funds on one signal. Subscribe to multiple signals. Also, keep in mind that diversification starts with "3". In other words, in order to diversify your risks, you need to divide your funds at least in three parts and invest each of them in an independent asset. The higher the diversification level, the better.
After all signals are selected, it is time to perform tests in real conditions using minimum volumes.
Limit the amount of losses for each part of your capital. If you have reached the loss limit at one of the parts, cancel subscription without any regrets. The steady growth of funds requires systemic approach.
Conclusion
The script may contain some flaws to be fixed, but it currently fulfills its main objective. The most valuable analysis is always based on processing initial data (the "bricks" I mentioned in the beginning) used to obtain results. Now, we know how the profit is formed at different signals, how to define if a provider's approach is systemic and how much randomness is involved in the results.
The script can be found in the Market. The accompanying video shows its work in details. Please write in the comments below if you wish to discuss the signal selection method and related issues.