Comparative Analysis of 10 Trend Strategies
Alexander Fedosov | 24 May, 2017
Contents
- Introduction
- Defining the task when creating a trend following strategy
- Trend strategies
- Strategy #1. The ADXCloud indicator with a confirmation from RSI drawn as a histogram.
- Strategy #2. The Standard Deviation trend indicator drawn as a histogram with RVI used for confirmation.
- Strategy #3. A cloud interpretation of AC by Bill Williams and a combined Bears Power - Bulls Power indicator.
- Strategy #4. Ehlers' gravity center with a confirmation by the average price speed indicator.
- Strategy #5. A complex Binary Wave indicator.
- Strategy #6. A complex Weight Oscillator combined with LeMan Objective.
- Strategy #7. Donchian channel combined with MACD, in which the price series is replaced by Williams' AO values.
- Strategy #8. Schaff cyclical oscillator with a confirmation based on three Tyrone levels.
- Strategy #9. Keltner channel drawn as a histogram and the iTrend indicator drawn as a cloud.
- Strategy #10. The Average Change price momentum and the MA fan FigurelliSeries.
- Testing
- Conclusions
- Conclusion
Introduction
Trend following strategies are very popular on the Forex market. The idea is to determine a strong unidirectional movement, to find good entry points and — what is also very important — to properly determine the exit point. For the purposes outlined in this article, I selected some technical tools that directly or indirectly determine the trend. Based on these tools, 10 trading strategies were implemented in the form of Expert Advisors for MetaTrader 5. Based on the results of these Expert Advisors, I analyzed the advantages and disadvantages of each trading strategy and compared their performance. The purpose of the article is to provide the reader with the fullest possible information about the strong and weak points of trend following trading. Some other trend following strategies are also described in the article Several ways of finding a trend in MQL5.
Defining the task when creating a trend following strategy
At first glance, it may seem that developing a trend following strategy is not a difficult task. You only need to determine trend using technical analysis, open a position and wait for further movement while increasing the position if possible. In theory, this approach cannot be argued. However, some important questions arise in practice.
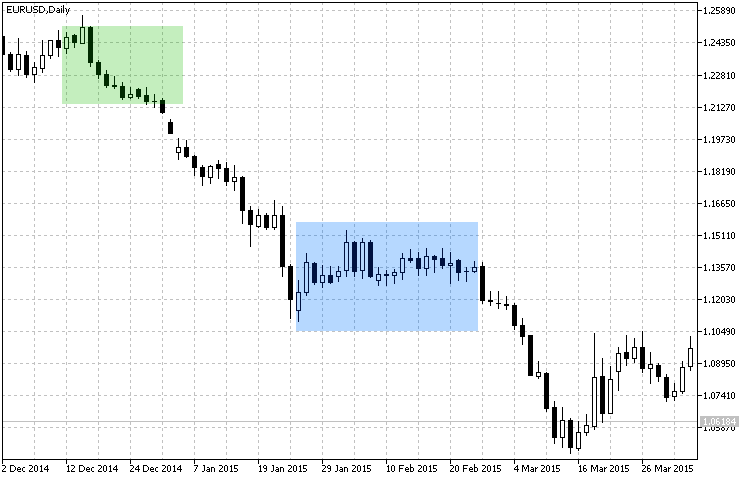
Fig.1 Trend and flat determining zones.
Task 1. Identifying the presence of a trend.
Typically, trend definition and confirmation take time. Therefore, there is no ideal and maximum reliable entry at the very beginning of the trend. See Fig. 1. It is impossible to determine entry as a point on the chart. We only see a favorable area for entering the market. Defining the area is explained by the fact, that signals can be delayed during analysis, while time is required in order to confirm the trend. An example is a trading system, in which one indicator signals a trend, and the other one either confirms it or not after some time. This approach takes time. While time is money. In our case time means missed profit.
Task 2. The targets of an open position.
We have determined the trend and confirmed it. Now we need to enter the market. However, before doing so, we need to define the profit target. We can set the profit target in points or use a dynamic one depending on the trend strength forecast. Here, the support and resistance levels can be used. However, the idea is to clearly know when to exit, before you enter the market. The next task is closely connected with the current one.
Task 3. Determining the end of trend.
Again, we refer to Figure 1. It shows the following situation: we enter the market in the green area, and then trend continues till the flat area. That's where we need to determine whether this is a temporary state or we need to exit. In this case, the flat period was short, and the trend continued. Note, that in strategies with fixed profit targets, the duration and size of the movement is predicted based on an estimation of a confirmed trend as per Task 2.
Trend Strategies
Here is a general condition. In this review of trend strategies, I decided not to use too large and too small timeframes, because too many false signals can be generated on lower timeframes, while on larger ones there would be very few market entries, which might be not enough for an objective analysis of the efficiency of strategies. Therefore, timeframes between M30 and H4 will be used during testing.
Strategy #1: The ADXCloud indicator with a confirmation from RSI drawn as a histogram.
The first analyzed strategy is based on the ADX indicator — ADXCloud. The signal will be confirmed by the RSI oscillator with overbought/oversold levels. It is drawn as a histogram, where green bars of the RSI values refer to the overbought zone, and red ones show the oversold zone.
| Parameter | Description |
|---|---|
| Used indicator | ADXCloud |
| Used indicator | RSIColor |
| TimeFrame | H1 |
| Buy conditions | The cloud color changes from red to green, the RSIColor histogram is green. |
| Sell conditions | The cloud color changes from green to red, the RSIColor histogram is red. |
| Exit conditions | Take Profit/Stop Loss |
The strategy is graphically presented in Fig. 2. On the H1 timeframe, the areas defined as trend last for a few bars, therefore it is not advisable to use large values for the Take Profit and Stop Loss levels in the exit conditions.
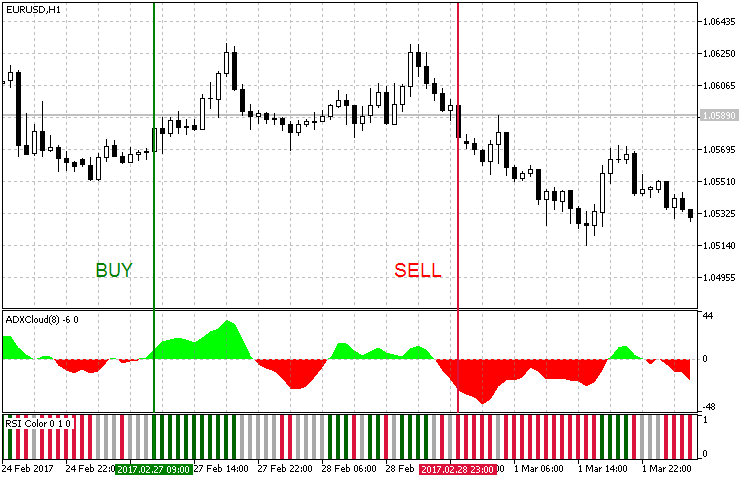
Fig. 2. Entry conditions for the trend strategy #1
Here is the code of an Expert Advisor implemented based on this strategy:
void OnTick()
  {
//--- Checking orders previously opened by the EA
   if(!Trade.IsOpened(Inp_MagicNum))
     {
      //--- Getting data for calculations

      if(!GetIndValue())
         return;
      //--- Opening an order if there is a buy signal

      if(BuySignal())
         Trade.BuyPositionOpen(true,Symbol(),Inp_Lot,Inp_MMode,Inp_Deviation,Inp_StopLoss,Inp_TakeProfit,Inp_MagicNum,Inp_EaComment);
      //--- Opening an order if there is a sell signal

      if(SellSignal())
         Trade.SellPositionOpen(true,Symbol(),Inp_Lot,Inp_MMode,Inp_Deviation,Inp_StopLoss,Inp_TakeProfit,Inp_MagicNum,Inp_EaComment);
     }
  }
//+------------------------------------------------------------------+
//| Buy conditions                                                   |
//+------------------------------------------------------------------+
bool BuySignal()
  {
   return(adx[0]>0 && adx[1]<0 && rsi1[0]==1)?true:false;
  }
//+------------------------------------------------------------------+
//| Sell conditions                                                  |
//+------------------------------------------------------------------+
bool SellSignal()
  {
   return(adx[0]<0 && adx[1]>0 && rsi2[0]==1)?true:false;
  }
//+------------------------------------------------------------------+
//| Getting the current values of indicators                         |
//+------------------------------------------------------------------+
bool GetIndValue()
  {
   return(CopyBuffer(InpInd_Handle1,0,0,2,rsi1)<=0 ||
          CopyBuffer(InpInd_Handle1,1,0,2,rsi2)<=0 ||
          CopyBuffer(InpInd_Handle2,0,0,2,adx)<=0
          )?false:true;
  }
Strategy #2: The Standard Deviation trend indicator drawn as a histogram with RVI used for confirmation.
The strategy is based on the modification of the Standard Deviation trend indicator and the RVI oscillator. To find out more about how these indicators work, please follow the links in the table.
| Parameter | Description |
|---|---|
| Used indicator | ColorStdDev |
| Used indicator | ColorZerolagRVI |
| TimeFrame | H1 |
| Buy conditions | The ColorStdDev histogram is red (a strong trend), the ColorZerolagRVI cloud is green. |
| Sell conditions | The ColorStdDev histogram is red (a strong trend), the ColorZerolagRVI cloud is red. |
| Exit conditions | Take Profit/Stop Loss |
The strategy is presented visually in Fig. 3. The areas of strong movement are determined using Standard Deviation. The trend is confirmed by the modified RVI oscillator, which is based on four standard RVIs with different periods and weights.
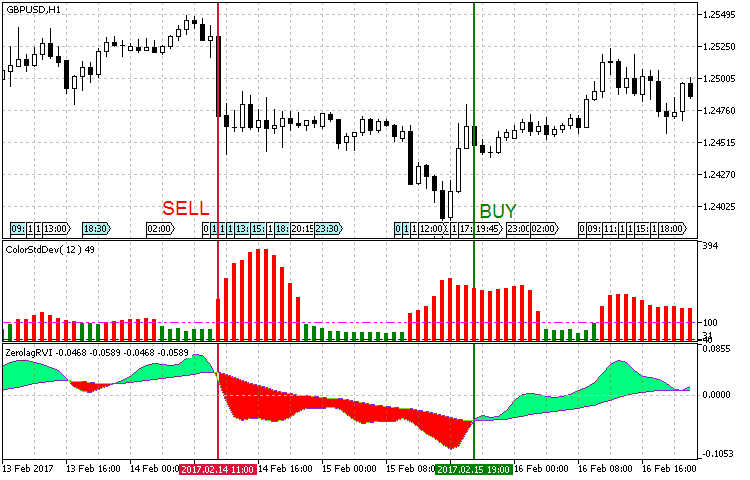
Fig. 3. Entry conditions for the trend strategy #2
Note that in the software implementation of this strategy, the values of the strong trend, the medium trend and the flat in the ColorStDev settings should be determined empirically. We will use the default values, but for convenience, let us add the Used Trend option, which allows to select the type of trend to trade — medium or strong one. This way, we will not need to redefine the following three values each time, instead we will only need to choose one. The use of a strong trend signal suits better for the current strategy, because we use it on the H4 timeframe. The medium trend option is more suitable for testing on higher timeframes. At the same time, keep in mind that there will be more signals to enter at a medium trend. Therefore it is necessary to take into account the profit targets and the current timeframe, in order to filter out false signals and have positive results.
//--- ColorStDev indicator parameters

input int                  period = 12;                               //Smoothing period StDev
input ENUM_MA_METHOD       MA_Method=MODE_EMA;                        //Histogram smoothing method
input ENUM_APPLIED_PRICE   applied_price=PRICE_CLOSE;                 //Applied price
input int                  MaxTrendLevel=100;                         //Maximum trend level
input int                  MiddLeTrendLevel=40;                       //Middle trend level
input int                  FlatLevel=10;                              //Flat level
input Trend                TrendLevel=Maximum;                                //Used trend
The idea of the strategy is presented in the code:
void OnTick()
  {
//--- Checking orders previously opened by the EA
   if(!Trade.IsOpened(Inp_MagicNum))
     {
      //--- Getting data for calculations

      if(!GetIndValue())
         return;
      //--- Opening an order if there is a buy signal

      if(BuySignal())
         Trade.BuyPositionOpen(true,Symbol(),Inp_Lot,Inp_MMode,Inp_Deviation,Inp_StopLoss,Inp_TakeProfit,Inp_MagicNum,Inp_EaComment);
      //--- Opening an order if there is a sell signal

      if(SellSignal())
         Trade.SellPositionOpen(true,Symbol(),Inp_Lot,Inp_MMode,Inp_Deviation,Inp_StopLoss,Inp_TakeProfit,Inp_MagicNum,Inp_EaComment);
     }
  }
//+------------------------------------------------------------------+
//| Buy conditions                                                   |
//+------------------------------------------------------------------+
bool BuySignal()
  {
   return(stdev[0]>trend && rvi_fast[0]>rvi_slow[0])?true:false;
  }
//+------------------------------------------------------------------+
//| Sell conditions                                                  |
//+------------------------------------------------------------------+
bool SellSignal()
  {
   return(stdev[0]>trend && rvi_fast[0]<rvi_slow[0])?true:false;
  }
//+------------------------------------------------------------------+
//| Getting the current values of indicators                         |
//+------------------------------------------------------------------+
bool GetIndValue()
  {
   return(CopyBuffer(InpInd_Handle1,0,0,2,stdev)<=0 ||
          CopyBuffer(InpInd_Handle2,0,0,2,rvi_fast)<=0 ||
          CopyBuffer(InpInd_Handle2,1,0,2,rvi_slow)<=0
          )?false:true;
  }
Strategy #3: A cloud interpretation of AC by Bill Williams and a combined Bears Power + Bulls Power indicator.
In the next strategy, I decided to try a bunch of a cloud interpretation of Bill Williams' Accelerator Oscillator (AC), and a combination of the Bears Power + Bulls Power oscillators.
| Parameter | Description |
|---|---|
| Used indicator | Bear_Bulls_Power |
| Used indicator | CronexAC |
| TimeFrame | H1 |
| Buy conditions | The histogram shows growth (its color changes from pink to blue, and the indicator value is less than zero), the CroneAC cloud is blue. |
| Sell conditions | The histogram shows drop (its color changes from blue to pink, and the indicator value is greater than zero), the CroneAC cloud is orange. |
| Exit conditions | Take Profit/Stop Loss |
The strategy is represented graphically in Fig. 4. When searching for signals, it is necessary to monitor the early growth of the histogram. In other words, we need to find the moment when bulls are replaced by bears or vice versa, and then need a signal confirmation from an oscillator.
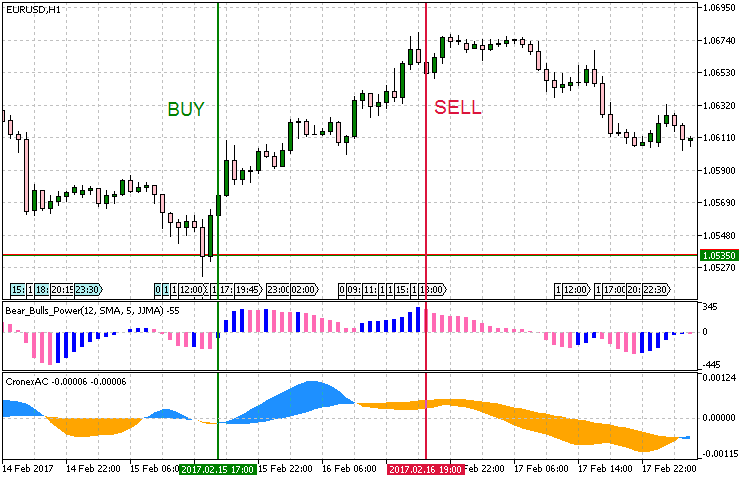
Fig.4 Entry conditions for the trend strategy #3
The strategy allows using different entry conditions: instead of searching for an "early" growth of the histogram, we can use a later signal: for example, when the indicator crosses zero, or the sign of its value changes. Maybe, even the change of the color histogram can produce a result. The strategy implementation according to initially described conditions is provided in the below listing:
void OnTick()
  {
//--- Checking orders previously opened by the EA
   if(!Trade.IsOpened(Inp_MagicNum))
     {
      //--- Getting data for calculations

      if(!GetIndValue())
         return;
      //--- Opening an order if there is a buy signal

      if(BuySignal())
         Trade.BuyPositionOpen(true,Symbol(),Inp_Lot,Inp_MMode,Inp_Deviation,Inp_StopLoss,Inp_TakeProfit,Inp_MagicNum,Inp_EaComment);
      //--- Opening an order if there is a sell signal

      if(SellSignal())
         Trade.SellPositionOpen(true,Symbol(),Inp_Lot,Inp_MMode,Inp_Deviation,Inp_StopLoss,Inp_TakeProfit,Inp_MagicNum,Inp_EaComment);
     }
  }
//+------------------------------------------------------------------+
//| Buy conditions                                                   |
//+------------------------------------------------------------------+
bool BuySignal()
  {
   return(ac_fast[0]>ac_slow[0] && bb_power[0]>bb_power[1] && (bb_power[0]<0 && bb_power[1]<0))?true:false;
  }
//+------------------------------------------------------------------+
//| Sell conditions                                                  |
//+------------------------------------------------------------------+
bool SellSignal()
  {
   return(ac_fast[0]<ac_slow[0] && bb_power[0]<bb_power[1] && (bb_power[0]>0 && bb_power[1]>0))?true:false;
  }
//+------------------------------------------------------------------+
//| Getting the current values of indicators                         |
//+------------------------------------------------------------------+
bool GetIndValue()
  {
   return(CopyBuffer(InpInd_Handle1,0,0,2,bb_power)<=0 ||
          CopyBuffer(InpInd_Handle2,0,0,2,ac_fast)<=0 ||
          CopyBuffer(InpInd_Handle2,1,0,2,ac_slow)<=0
          )?false:true;
  }
Strategy #4: Ehlers' Gravity Center with a confirmation by the average price speed indicator.
The strategy uses the J. F. Ehlers' Center of Gravity indicator represented by a colored OSMA histogram — CenterOfGravityOSMA. Its signal is confirmed by an indicator that calculates the average price speed.
| Parameter | Description |
|---|---|
| Used indicator | CenterOfGravityOSMA |
| Used indicator | Average Speed |
| TimeFrame | H1 |
| Buy conditions | The histogram of the Gravity Center shows growth (the indicator value is less than zero), and the Average Speed value is above the threshold (pre-set in the parameters) |
| Sell conditions | The histogram of the Gravity Center shows drop (the indicator value is greater than zero), and the Average Speed value is above the threshold (pre-set in the parameters) |
| Exit conditions | Take Profit/Stop Loss |
The strategy is represented graphically in Fig. 5. Like in the previous strategy, we monitor an early change of the histogram and wait for a confirmation from the price change speed.
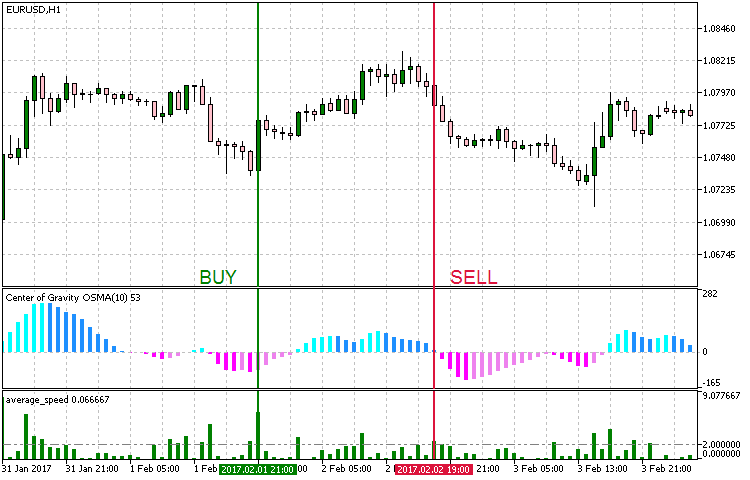
Fig. 5. Entry conditions for the trend strategy #4
The implementation of the strategy:
void OnTick()
  {
//--- Checking orders previously opened by the EA
   if(!Trade.IsOpened(Inp_MagicNum))
     {
      //--- Getting data for calculations

      if(!GetIndValue())
         return;
      //--- Opening an order if there is a buy signal

      if(BuySignal())
         Trade.BuyPositionOpen(true,Symbol(),Inp_Lot,Inp_MMode,Inp_Deviation,Inp_StopLoss,Inp_TakeProfit,Inp_MagicNum,Inp_EaComment);
      //--- Opening an order if there is a sell signal

      if(SellSignal())
         Trade.SellPositionOpen(true,Symbol(),Inp_Lot,Inp_MMode,Inp_Deviation,Inp_StopLoss,Inp_TakeProfit,Inp_MagicNum,Inp_EaComment);
     }
  }
//+------------------------------------------------------------------+
//| Buy conditions                                                   |
//+------------------------------------------------------------------+
bool BuySignal()
  {
   return(avr_speed[0]>Trend_lev && cog[1]<cog[0] &&(cog[1]<0 && cog[0]<0))?true:false;
  }
//+------------------------------------------------------------------+
//| Sell conditions                                                  |
//+------------------------------------------------------------------+
bool SellSignal()
  {
   return(avr_speed[0]>Trend_lev && cog[1]>cog[0] &&(cog[1]>0 && cog[0]>0))?true:false;
  }
//+------------------------------------------------------------------+
//| Getting the current values of indicators                         |
//+------------------------------------------------------------------+
bool GetIndValue()
  {
   return(CopyBuffer(InpInd_Handle1,0,0,2,cog)<=0 ||
          CopyBuffer(InpInd_Handle2,0,0,2,avr_speed)<=0
          )?false:true;
  }
Strategy #5. A complex Binary Wave indicator.
The first four strategies were based on the model of selecting a combination of the main indicator showing the trend, and an additional confirmation signal. In this strategy, I decided to use another scheme base on one indicator: Binary wave. It looks like an oscillator, but in fact it visualizes the result of signals generated by seven indicators, including MA, MACD, OsM, CCI, Momentum, RSI and ADX. It is a full-featured trading strategy with a flexible system of parameters. In addition to the standard sets of parameter for the selected indicators, weights are additionally used here to show the effect of a particular component.
| Parameter | Description |
|---|---|
| Used indicator | Binary_Wave |
| TimeFrame | H1 |
| Buy conditions | Crossing the zero value upwards |
| Sell conditions | Crossing the zero value downwards |
| Exit conditions | Take Profit/Stop Loss |
Examples of entries based on this strategy are provided in Fig. 6. Note: In order to optimize the strategy for H1, the default values of the MA_Period, CCIPeriod, MOMPeriod, RSIPeriod and ADX_Period periods in the software implementation were changed from 14 to 10 (faster). If you need to test with classical periods, you can use a timeframe H3 or H4.
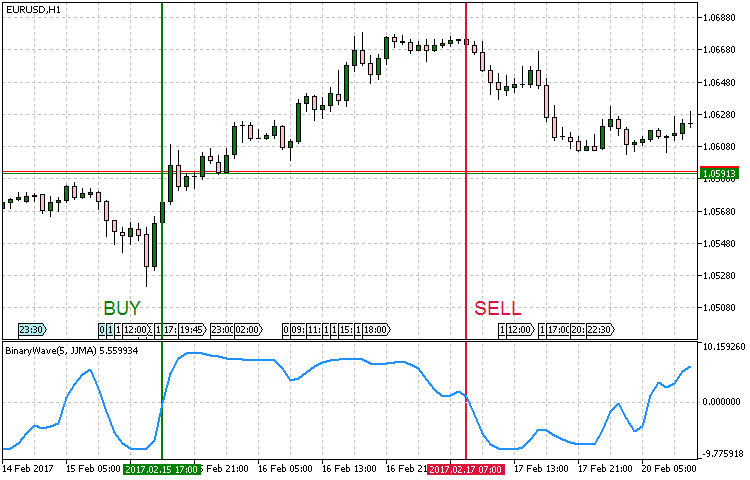
Fig.6 Entry conditions for the trend strategy #5
Implementation result:
void OnTick()
  {
//--- Checking orders previously opened by the EA
   if(!Trade.IsOpened(Inp_MagicNum))
     {
      //--- Getting data for calculations

      if(!GetIndValue())
         return;
      //--- Opening an order if there is a buy signal

      if(BuySignal())
         Trade.BuyPositionOpen(true,Symbol(),Inp_Lot,Inp_MMode,Inp_Deviation,Inp_StopLoss,Inp_TakeProfit,Inp_MagicNum,Inp_EaComment);
      //--- Opening an order if there is a sell signal

      if(SellSignal())
         Trade.SellPositionOpen(true,Symbol(),Inp_Lot,Inp_MMode,Inp_Deviation,Inp_StopLoss,Inp_TakeProfit,Inp_MagicNum,Inp_EaComment);
     }
  }
//+------------------------------------------------------------------+
//| Buy conditions                                                   |
//+------------------------------------------------------------------+
bool BuySignal()
  {
   return(wave[0]>0 && wave[1]<0)?true:false;
  }
//+------------------------------------------------------------------+
//| Sell conditions                                                  |
//+------------------------------------------------------------------+
bool SellSignal()
  {
   return(wave[0]<0 && wave[1]>0)?true:false;
  }
//+------------------------------------------------------------------+
//| Getting the current values of indicators                         |
//+------------------------------------------------------------------+
bool GetIndValue()
  {
   return(CopyBuffer(InpInd_Handle,0,0,2,wave)<=0)?false:true;
  }
Strategy #6: A complex Weight Oscillator combined with LeMan Objective.
It combines the principles of strategies used in the previous five examples. Then we combine the ready system and add a signal confirmation to it. We will use the Weighted Oscillator, representing the weighted smoothed sum of four indicators: RSI, MFI, WPR and DeMarker. The signal will be confirmed by LeMan Objective, which calculates the distance from the open price to Highs and Lows, and displays the quartiles of the deviation. On the given number of bars, the indicator also provides a moving average of the summary statistics of price changes in 75, 50, 25 % of cases, and shows the maximum deviation. We will monitor the growth of the Weight Oscillator histogram for buys; the price breaking the quartile of deviation with the value of 75% is used for confirmation.
| Parameter | Description |
|---|---|
| Used indicator | Weight Oscillator |
| Used indicator | LeMan Objective |
| TimeFrame | H1 |
| Buy conditions | Weight Oscillator is growing, and the price breaks the upper level at 75% of the deviation quartile value. |
| Sell conditions | Weight Oscillator is falling, and the price breaks the lower level at 75% of the deviation quartile value. |
| Exit conditions | Take Profit/Stop Loss |
The entry points are shown in Fig. 7. The levels of 75% are displayed as bold lines. Close prices break through these levels, and the conditions of Weight Oscillator growth/fall are met.
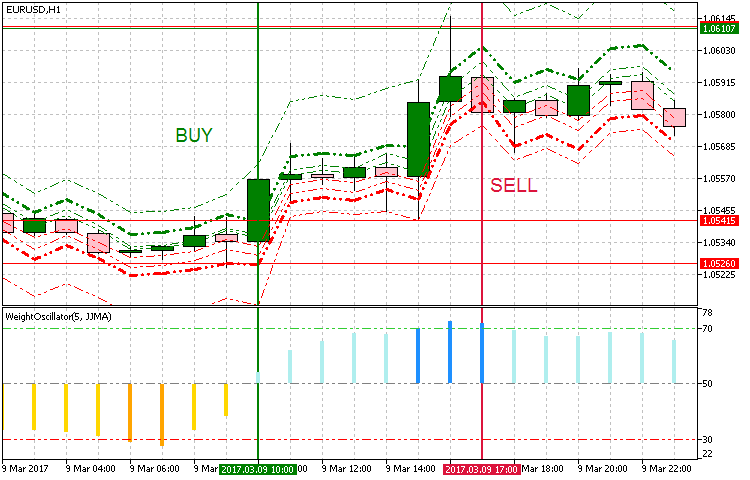
Fig. 7. Entry conditions for the trend strategy #6
The LeMan Objective indicator uses 8 indicator buffers for drawing levels:
- Quartile 1 corresponds to the average value of price reduction in relation to the sample in 25% of cases.
- Quartile 2 corresponds to the average value of price reduction in relation to the sample in 50% of cases.
- Quartile 3 corresponds to the average value of price reduction in relation to the sample in 75% of cases. It is used in our strategy.
- Quartile 4 corresponds to a maximum deviation of the average price value.
- Quartile 1 corresponds to the average value of price growth in relation to the sample in 25% of cases.
- Quartile 1 corresponds to the average value of price growth in relation to the sample in 50% of cases.
- Quartile 1 corresponds to the average value of price growth in relation to the sample in 75% of cases. It is used in our strategy.
- Quartile 8 corresponds to a maximum deviation of the average price value.
In the implementation, we need buffers 2 and 6 in addition to Weight Oscillator and the Close price.
void OnTick()
  {
//--- Checking orders previously opened by the EA
   if(!Trade.IsOpened(Inp_MagicNum))
     {
      //--- Getting data for calculations

      if(!GetIndValue())
         return;
      //--- Opening an order if there is a buy signal

      if(BuySignal())
         Trade.BuyPositionOpen(true,Symbol(),Inp_Lot,Inp_MMode,Inp_Deviation,Inp_StopLoss,Inp_TakeProfit,Inp_MagicNum,Inp_EaComment);
      //--- Opening an order if there is a sell signal

      if(SellSignal())
         Trade.SellPositionOpen(true,Symbol(),Inp_Lot,Inp_MMode,Inp_Deviation,Inp_StopLoss,Inp_TakeProfit,Inp_MagicNum,Inp_EaComment);
     }
  }
//+------------------------------------------------------------------+
//| Buy conditions                                                   |
//+------------------------------------------------------------------+
bool BuySignal()
  {
   return(wo[0]>wo[1] && close[0]>obj_q3_b[0])?true:false;
  }
//+------------------------------------------------------------------+
//| Sell conditions                                                  |
//+------------------------------------------------------------------+
bool SellSignal()
  {
   return(wo[0]<wo[1] && close[0]<obj_q3_s[0])?true:false;
  }
//+------------------------------------------------------------------+
//| Getting the current values of indicators                         |
//+------------------------------------------------------------------+
bool GetIndValue()
  {
   return(CopyBuffer(InpInd_Handle1,6,0,2,obj_q3_b)<=0 ||
         CopyBuffer(InpInd_Handle1,2,0,2,obj_q3_s)<=0 ||
         CopyBuffer(InpInd_Handle2,0,0,2,wo)<=0 ||
         CopyClose(Symbol(),PERIOD_CURRENT,0,2,close)<=0
          )?false:true;
  }
Strategy #7: Donchian channel combined with MACD, in which the price series is replaced by Williams' AO values.
The Donchian channel is used for determining a strong unidirectional movement. The channel breakout will be used as the sign of trend. To confirm the trend, we use a modified MACD, in which the price series is replaced by Bill Williams' AO values.
| Parameter | Description |
|---|---|
| Used indicator | Donchian Channel System |
| Used indicator | CronexAO |
| TimeFrame | H1 |
| Buy conditions | Breakout of the upper border of the Donchian channel and the blue color of the CronexAO cloud |
| Sell conditions | Breakout of the lower border of the Donchian channel and the pink color of the CronexAO cloud |
| Exit conditions | Take Profit/Stop Loss |
In Figure 8, this trend strategy is displayed graphically. For a more convenient display and clarity, we use an indicator with a changing color for the candlestick that breaks the upper or lower channel of the Donchian channel. The colors of CronexAO match the colors of the candlesticks that break the channel borders.
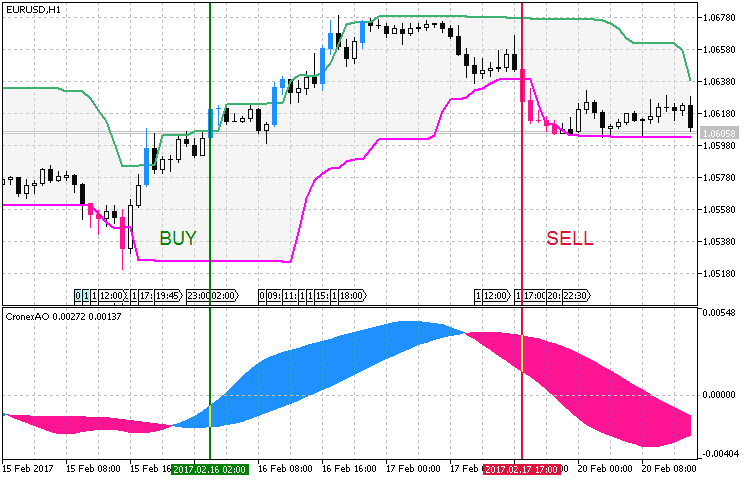
Fig. 8. Entry conditions for the trend strategy #7
When implementing this strategy, it is important to note that the candlestick High and Low values are used as extremes. Nevertheless, if a symbol price often jumps in one direction or other (long candlestick shadows) and then returns back to the mean values, it is better to use Open or Close values of candlesticks, or a combination of Open+High/Open+Low. This will reduce the effect of long shadows.
void OnTick()
  {
//--- Checking orders previously opened by the EA
   if(!Trade.IsOpened(Inp_MagicNum))
     {
      //--- Getting data for calculations

      if(!GetIndValue())
         return;

      //--- Opening an order if there is a buy signal

      if(BuySignal())
         Trade.BuyPositionOpen(true,Symbol(),Inp_Lot,Inp_MMode,Inp_Deviation,Inp_StopLoss,Inp_TakeProfit,Inp_MagicNum,Inp_EaComment);
      //--- Opening an order if there is a sell signal

      if(SellSignal())
         Trade.SellPositionOpen(true,Symbol(),Inp_Lot,Inp_MMode,Inp_Deviation,Inp_StopLoss,Inp_TakeProfit,Inp_MagicNum,Inp_EaComment);
     }
  }
//+------------------------------------------------------------------+
//| Buy conditions                                                   |
//+------------------------------------------------------------------+
bool BuySignal()
  {
   return(cao_fast[0]>cao_slow[0] && close[0]>dcs_up[0])?true:false;
  }
//+------------------------------------------------------------------+
//| Sell conditions                                                  |
//+------------------------------------------------------------------+
bool SellSignal()
  {
   return(cao_fast[0]<cao_slow[0] && close[0]<dcs_low[0])?true:false;
  }
//+------------------------------------------------------------------+
//| Getting the current values of indicators                         |
//+------------------------------------------------------------------+
bool GetIndValue()
  {
   return(CopyBuffer(InpInd_Handle1,0,0,2,dcs_up)<=0 ||
          CopyBuffer(InpInd_Handle1,1,0,2,dcs_low)<=0 ||
          CopyBuffer(InpInd_Handle2,0,0,2,cao_fast)<=0 ||
          CopyBuffer(InpInd_Handle2,1,0,2,cao_slow)<=0 ||
          CopyClose(Symbol(),PERIOD_CURRENT,0,2,close)<=0
          )?false:true;
  }
Strategy #8: Schaff cyclical oscillator with a confirmation based on three Tyrone levels.
This strategy is based on the Schaff cyclical oscillator, utilizing its exits from the overbought/oversold areas. Three Tirone levels are used for checks. Interesting results were obtained on higher basic timeframes. H4 was chosen for testing.
| Parameter | Description |
|---|---|
| Used indicator | Schaff Trend Cycle |
| Used indicator | Three Tirone levels |
| TimeFrame | H4 |
| Buy conditions | Exit from the oversold zone, while the current price should be higher than the upper Titone level. |
| Sell conditions | Exit from the overbought zone, while the current price should be lower than the lower Titone level. |
| Exit conditions | Take Profit/Stop Loss |
A graphic representation of this trend following strategy is shown in Fig. 9.
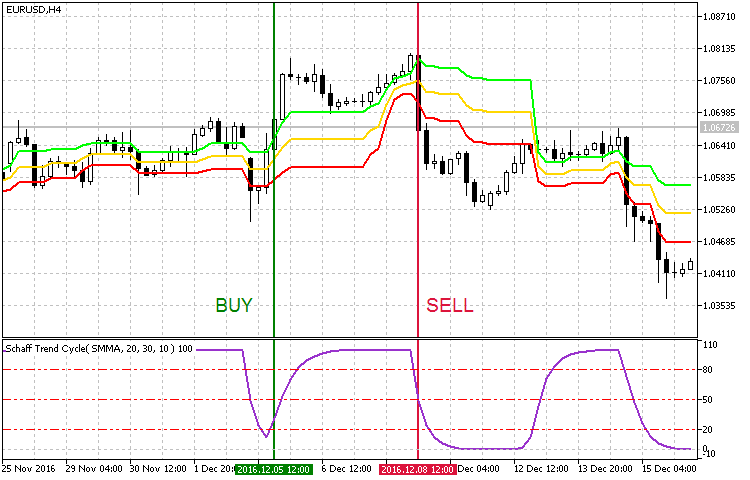
Fig. 9 Entry conditions for the trend strategy #8
In this strategy implementation, in addition to the main parameters of two indicators, it was necessary to add numeric values of overbought/oversold levels. I didn't change them and used the default 20 and 80. But I changed the smoothing parameter and the periods (in the figure, it is shown in the upper left corner of Schaff indicator). These settings are optional, you can use default settings or set your own values.
//+------------------------------------------------------------------+
//| Expert Advisor input parameters                                  |
//+------------------------------------------------------------------+
input string               Inp_EaComment="Strategy #8";                  //EA Comment
input double               Inp_Lot=0.01;                                 //Lot
input MarginMode           Inp_MMode=LOT;                                //MM
input int                  Inp_MagicNum=1111;                            //Magic number
input int                  Inp_StopLoss=400;                             //Stop Loss(points)
input int                  Inp_TakeProfit=600;                           //Take Profit(points)
input int                  Inp_Deviation = 20;                           //Deviation(points)

input double               Overbuying=80;                                //Overbuying zone
input double               Overselling=20;                               //Overselling zone
//--- Schaff Trend Cycle indicator parameters

input Smooth_Method        MA_SMethod=MODE_SMMA_;                        //Histogram smoothing method
input int                  Fast_XMA = 20;                                //Fast moving average period
input int                  Slow_XMA = 30;                                //Slow moving average period
input int                  SmPhase= 100;                                 //Moving averages smoothing parameter
input Applied_price_       AppliedPrice=PRICE_CLOSE_;                    //Price constant
input int                  Cycle=10;                                     //Stochastic oscillator period
The principle of the strategy is the following:
void OnTick()
  {
//--- Checking orders previously opened by the EA
   if(!Trade.IsOpened(Inp_MagicNum))
     {
      //--- Getting data for calculations

      if(!GetIndValue())
         return;
      //--- Opening an order if there is a buy signal

      if(BuySignal())
         Trade.BuyPositionOpen(true,Symbol(),Inp_Lot,Inp_MMode,Inp_Deviation,Inp_StopLoss,Inp_TakeProfit,Inp_MagicNum,Inp_EaComment);
      //--- Opening an order if there is a sell signal

      if(SellSignal())
         Trade.SellPositionOpen(true,Symbol(),Inp_Lot,Inp_MMode,Inp_Deviation,Inp_StopLoss,Inp_TakeProfit,Inp_MagicNum,Inp_EaComment);
     }
  }
//+------------------------------------------------------------------+
//| Buy conditions                                                   |
//+------------------------------------------------------------------+
bool BuySignal()
  {
   return(schaff[1]<Overselling && schaff[0]>Overselling && close[0]>tirone_b[0])?true:false;
  }
//+------------------------------------------------------------------+
//| Sell conditions                                                  |
//+------------------------------------------------------------------+
bool SellSignal()
  {
   return(schaff[1]>Overbuying && schaff[0]<Overbuying && close[0]<tirone_s[0])?true:false;
  }
//+------------------------------------------------------------------+
//| Getting the current values of indicators                         |
//+------------------------------------------------------------------+
bool GetIndValue()
  {
   return(CopyBuffer(InpInd_Handle1,0,0,2,schaff)<=0 ||
          CopyBuffer(InpInd_Handle2,0,0,2,tirone_b)<=0 ||
          CopyBuffer(InpInd_Handle2,2,0,2,tirone_s)<=0 ||
          CopyClose(Symbol(),PERIOD_CURRENT,0,2,close)<=0
          )?false:true;
  }
Strategy #9: Keltner channel drawn as a histogram and the iTrend indicator drawn as a cloud.
The trend is identified using i-KlPrice based on the Keltner channel drawn as a histogram. For trend confirmation, we will use the iTrend indicator in the cloud form, in which the cloud color and width characterize the current trend. Like in the previous strategy, here a signal is generated as a crossover of a certain level. The default values of such levels for i-KlPrice are 50 and -50. Therefore, it also makes sense to add the BuyLevel and SellLevel parameters: crossing these levels will indicate a buy or a sell signal.
The signal will be confirmed by iTrend. In this indicator, we will watch the color of the cloud determined by the values of two lines. The upper line is the difference between the smoothed price value and one of Bollinger Bands selected in the parameters. The lower one is the difference between (High + Low) and the moving average value on the current candlestick multiplied by -1.
| Parameter | Description |
|---|---|
| Used indicator | i-KlPrice |
| Used indicator | iTrend |
| TimeFrame | H1 |
| Buy conditions | The value of the i-KlPrice histogram is greater than BuyLevel, and the iTrend cloud is green. |
| Sell conditions | The value of the i-KlPrice histogram is lower than SellLevel, and the iTrend cloud is pink. |
| Exit conditions | Take Profit/Stop Loss |
Fig. 10 shows examples of entry points for this trend following strategy.
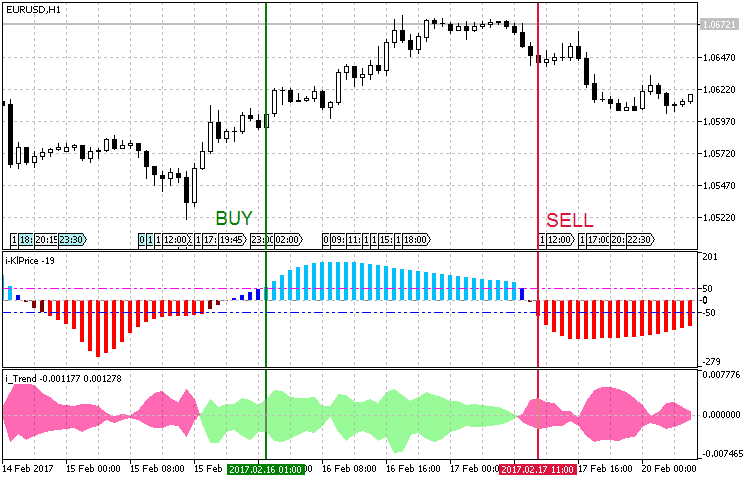
Fig. 10. Entry conditions for the trend strategy #9
Here is my code of this strategy:
void OnTick()
  {
//--- Checking orders previously opened by the EA
   if(!Trade.IsOpened(Inp_MagicNum))
     {
      //--- Getting data for calculations

      if(!GetIndValue())
         return;
      //--- Opening an order if there is a buy signal

      if(BuySignal())
         Trade.BuyPositionOpen(true,Symbol(),Inp_Lot,Inp_MMode,Inp_Deviation,Inp_StopLoss,Inp_TakeProfit,Inp_MagicNum,Inp_EaComment);
      //--- Opening an order if there is a sell signal

      if(SellSignal())
         Trade.SellPositionOpen(true,Symbol(),Inp_Lot,Inp_MMode,Inp_Deviation,Inp_StopLoss,Inp_TakeProfit,Inp_MagicNum,Inp_EaComment);
     }
  }
//+------------------------------------------------------------------+
//| Buy conditions                                                   |
//+------------------------------------------------------------------+
bool BuySignal()
  {
   return(klprice[0]>BuyLevel && itrend_h[0]>itrend_l[0])?true:false;
  }
//+------------------------------------------------------------------+
//| Sell conditions                                                  |
//+------------------------------------------------------------------+
bool SellSignal()
  {
   return(klprice[0]<SellLevel && itrend_h[0]<itrend_l[0])?true:false;
  }
//+------------------------------------------------------------------+
//| Getting the current values of indicators                         |
//+------------------------------------------------------------------+
bool GetIndValue()
  {
   return(CopyBuffer(InpInd_Handle1,0,0,2,klprice)<=0 ||
          CopyBuffer(InpInd_Handle2,0,0,2,itrend_h)<=0 ||
          CopyBuffer(InpInd_Handle2,1,0,2,itrend_l)<=0
          )?false:true;
  }
Strategy #10: The Average Change price momentum and the MA fan FigurelliSeries.
And the last version analyzes trend using the Average Change indicator. FigurelliSeries as a histogram will be used for momentum confirmation. The basic value of Average Change is equal to one. Based on this value, the price momentum signal goes up or down. An entry condition under this strategy is crossing the value of 1. In order to understand what the values of the FigurelliSeries indicator mean, you need to study its algorithm and inputs:
//+----------------------------------------------+
//| Indicator input parameters                   |
//+----------------------------------------------+
input uint StartPeriod=6;                              // initial period
input uint Step=6;                                     // periods calculation step
input uint Total=36;                                   // number of Moving Averages
input  ENUM_MA_METHOD   MAType=MODE_EMA;               // Moving Averages smoothing type
input ENUM_APPLIED_PRICE   MAPrice=PRICE_CLOSE;        // price timeseries of Moving Averages
input int Shift=0;                                     // Horizontal shift of the indicator in bars
First StartPeriod (the starting period of the Moving Average) is set, and then values for other 36 Moving Averages with a period equal to the starting one plus Step are specified. Then we select the Moving Average type and price used for calculations. This is actually a fan of MAs, the values of which are compared to the current close price. The value of the histogram shows the difference between the number of MAs above and below the close price:
//---- main cycle of calculation of the indicator
   for(bar=limit; bar>=0 && !IsStopped(); bar--)
     {
      double tot_Ask=0;
      double tot_Bid=0;

      for(int count=0; count<int(Total); count++)
        {
         //---- copy newly appeared data into the arrays
         if(CopyBuffer(MA_Handle[count],0,bar,1,MA)<=0) return(RESET);

         if(close[bar]<MA[0]) tot_Ask++;
         if(close[bar]>MA[0]) tot_Bid++;
        }

      IndBuffer[bar]=tot_Bid-tot_Ask;
     }
By summarizing the operating principles of the two indicators, we formulate entry rules for the strategy:
| Parameter | Description |
|---|---|
| Used indicator | Average Change |
| Used indicator | Figurelli Series |
| TimeFrame | H4 |
| Buy conditions | Average Change crosses the threshold value upwards, and the value of the Figurelli Series histogram is above zero. |
| Sell conditions | Average Change crosses the threshold value downwards, and the value of the Figurelli Series histogram is below zero. |
| Exit conditions | Take Profit/Stop Loss |
Fig. 11 shows examples of market entry based on this strategy:
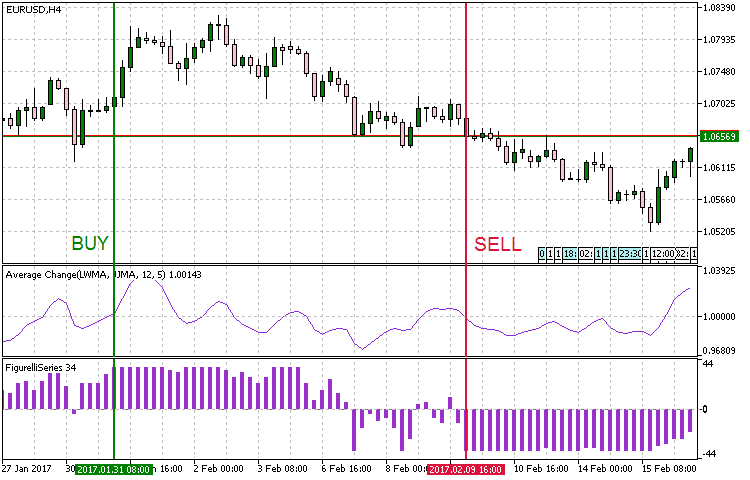
Fig. 11. Entry conditions for the trend strategy #10
The code of the strategy:
void OnTick()
  {
//--- Checking orders previously opened by the EA
   if(!Trade.IsOpened(Inp_MagicNum))
     {
      //--- Getting data for calculations

      if(!GetIndValue())
         return;
      //--- Opening an order if there is a buy signal

      if(BuySignal())
         Trade.BuyPositionOpen(true,Symbol(),Inp_Lot,Inp_MMode,Inp_Deviation,Inp_StopLoss,Inp_TakeProfit,Inp_MagicNum,Inp_EaComment);
      //--- Opening an order if there is a sell signal

      if(SellSignal())
         Trade.SellPositionOpen(true,Symbol(),Inp_Lot,Inp_MMode,Inp_Deviation,Inp_StopLoss,Inp_TakeProfit,Inp_MagicNum,Inp_EaComment);
     }
  }
//+------------------------------------------------------------------+
//| Buy conditions                                                   |
//+------------------------------------------------------------------+
bool BuySignal()
  {
   return(avr_change[1]<1 && avr_change[0]>1 && fig_series[0]>0)?true:false;
  }
//+------------------------------------------------------------------+
//| Sell conditions                                                  |
//+------------------------------------------------------------------+
bool SellSignal()
  {
   return(avr_change[1]>1 && avr_change[0]<1 && fig_series[0]<0)?true:false;
  }
//+------------------------------------------------------------------+
//| Getting the current values of indicators                         |
//+------------------------------------------------------------------+
bool GetIndValue()
  {
   return(CopyBuffer(InpInd_Handle1,0,0,2,avr_change)<=0 ||
          CopyBuffer(InpInd_Handle2,0,0,2,fig_series)<=0
          )?false:true;
  }
Testing
In the previous section, we formalized 10 trend following strategies and prepared their code. In order to test and compare the results obtained, we need to select the same conditions and testing modes.
- Interval: 01.01.2016 — 01.03.2017 .
- Currency pair: EURUSD.
- Trading mode: Without delay. These are not high-frequency trading strategies, so the effect of delays would be very small.
- Testing: M1 OHLC. Pre-testing on real ticks shows nearly the same results.
- Initial deposit: 1000 USD.
- Leverage: 1:500.
- Server: MetaQuotes-Demo.
- Quotes: 5-digit.
In almost all strategies, the exit condition is triggering of Take Profit/Stop Loss, 8 strategies run on H1. Therefore, we can use the same Take Profit and Stop Loss values for these strategies. Let us set Take Profit to 600 (5-digit quotes), and Stop Loss to 400. In addition to the conditions specified above, let us set preset parameters for indicators used in the strategies.
Test of Strategy #1 (the ADXCloud indicator with a confirmation from RSI drawn as a histogram).
Preset:
//--- RSI_Color indicator parameters

input int                  Inp_RSIPeriod=11;                            //RSI Period
input double               Inp_Overbuying=70;                           //Overuying zone
input double               Inp_Overselling=30;                          //Overselling zone
//--- ADX_Cloud indicator parameters

input int                  Inp_ADXPeriod=8;                             //ADX Period
input double               Inp_alpha1 = 0.25;                           //alpha1
input double               Inp_alpha2 = 0.25;                           //alpha2
//--- RSI_Color indicator parameters input int Inp_RSIPeriod=11; //RSI Period input double Inp_Overbuying=70; //Overuying zone input double Inp_Overselling=30; //Overselling zone //--- ADX_Cloud indicator parameters input int Inp_ADXPeriod=8; //ADX Period input double Inp_alpha1 = 0.25; //alpha1 input double Inp_alpha2 = 0.25; //alpha2
Testing result:
Fig. 12 Strategy #1. Testing results
Fig. 12 Strategy #1. Testing results
Test of Strategy #2: (The Standard Deviation trend indicator drawn as a histogram with RVI used for confirmation).
Preset:
//--- ColorStDev indicator parameters

input int                  period = 12;                                  //Smoothing period StDev
input ENUM_MA_METHOD       MA_Method=MODE_EMA;                           //Histogram smoothing method
input ENUM_APPLIED_PRICE   applied_price=PRICE_CLOSE;                    //Applied price
input int                  MaxTrendLevel=90;                             //Maximum trend level
input int                  MiddLeTrendLevel=50;                          //Middle trend level
input int                  FlatLevel=20;                                 //Flat level
input Trend                TrendLevel=Maximum;                           //Used trend
//--- Параметры индикатора ColorZerolagRVI

input uint                 smoothing=15;                                 //Smoothing period RVI
input double               Factor1=0.05;                                 //Weight coef.1
input int                  RVI_period1=14;                               //RVI Period 1
input double               Factor2=0.10;                                 //Weight coef.2
input int                  RVI_period2=28;                               //RVI Period 2
input double               Factor3=0.16;                                 //Weight coef.3
input int                  RVI_period3=45;                               //RVI Period 3
input double               Factor4=0.26;                                 //Weight coef.4
input int                  RVI_period4=65;                               //RVI Period 4
input double               Factor5=0.43;                                 //Weight coef.5
input int                  RVI_period5=75;                               //RVI Period 5
Testing result:
Fig. 13 Strategy #2. Testing results
Test of Strategy #3 (A cloud interpretation of AC by Bill Williams and a combined Bears Power - Bulls Power indicator).
Preset:
//--- Bears_Bull_power indicator parameters

input Smooth_Method        MA_Method1=MODE_AMA;                         //Averaging method
input uint                 Length1=12;                                  //Averaging depth
input int                  Phase1=15;                                   //Averaging parameter
input Smooth_Method        MA_Method2=MODE_ParMA;                       //Smoothing period
input uint                 Length2=5;                                   //Smoothing depth
input int                  Phase2=15;                                   //Smoothing parameter
input Applied_price_       IPC=PRICE_WEIGHTED_;                         //Applied price
input int                  Shift=0;                                     //Shift
//--- CronexAC indicator parameters

input Smooth_Method        XMA_Method=MODE_SMMA_;                       //Smoothing Method
input uint                 FastPeriod=9;                                //Fast smoothing period
input uint                 SlowPeriod=21;                               //Slow smoothing period
input int                  XPhase=15;                                   //Smoothing parameter
Testing results:
Fig. 14 Strategy #3. Testing results
Test of Strategy #4 (Ehlers' Gravity Center with a confirmation by the average price speed indicator).
Preset:
//--- CenterOfGravityOSMA indicator parameters

input uint                 Period_=9;                                   //Averaging period
input uint                 SmoothPeriod1=3;                             //Smoothing period1
input ENUM_MA_METHOD       MA_Method_1=MODE_SMA;                        //Averaging method1
input uint                 SmoothPeriod2=3;                             //Smoothing period2
input ENUM_MA_METHOD       MA_Method_2=MODE_SMA;                        //Averaging method2
input Applied_price_       AppliedPrice=PRICE_OPEN_;                    //Applied price
//--- Average Speed indicator parameters

input int                  Inp_Bars=1;                                  //Days
input ENUM_APPLIED_PRICE   Price=PRICE_CLOSE;                           //Applied price
input double               Trend_lev=2;                                 //Trend Level
Testing results:
Fig. 15 Strategy #4. Testing results
Test of Strategy #5 (A complex Binary Wave indicator).
Preset:
//--- Binary_Wave indicator parameters

input double               WeightMA    = 1.0;
input double               WeightMACD  = 1.0;
input double               WeightOsMA  = 1.0;
input double               WeightCCI   = 1.0;
input double               WeightMOM   = 1.0;
input double               WeightRSI   = 1.0;
input double               WeightADX   = 1.0;
//---- Moving Average

input int                  MAPeriod=10;
input ENUM_MA_METHOD       MAType=MODE_EMA;
input ENUM_APPLIED_PRICE   MAPrice=PRICE_CLOSE;
//---- MACD

input int                  FastMACD     = 12;
input int                  SlowMACD     = 26;
input int                  SignalMACD   = 9;
input ENUM_APPLIED_PRICE   PriceMACD=PRICE_CLOSE;
//---- OsMA

input int                  FastPeriod   = 12;
input int                  SlowPeriod   = 26;
input int                  SignalPeriod = 9;
input ENUM_APPLIED_PRICE   OsMAPrice=PRICE_CLOSE;
//---- CCI

input int                  CCIPeriod=10;
input ENUM_APPLIED_PRICE   CCIPrice=PRICE_MEDIAN;
//---- Momentum

input int                  MOMPeriod=14;
input ENUM_APPLIED_PRICE   MOMPrice=PRICE_CLOSE;
//---- RSI

input int                  RSIPeriod=14;
input ENUM_APPLIED_PRICE   RSIPrice=PRICE_CLOSE;
//---- ADX

input int                  ADXPeriod=10;
Testing results:
Fig. 16 Strategy #5. Testing results
Test of Strategy #6 (A complex Weight Oscillator combined with LeMan Objective).
Preset:
//--- LeMan Objective indicator parameters

input int                  Sample=20;
input int                  Quartile_1 = 25;
input int                  Quartile_2 = 50;
input int                  Quartile_3 = 75;
input int                  Shift=0;
//--- Weight Oscillator indicator parameters
//---- RSI
input double               RSIWeight=1.0;
input uint                 RSIPeriod=14;
input ENUM_APPLIED_PRICE   RSIPrice=PRICE_CLOSE;
//---- MFI
input double               MFIWeight=1.0;
input uint                 MFIPeriod=14;
input ENUM_APPLIED_VOLUME  MFIVolumeType=VOLUME_TICK;
//---- WPR
input double               WPRWeight=1.0;
input uint                 WPRPeriod=12;
//---- DeMarker
input double               DeMarkerWeight=1.0;
input uint                 DeMarkerPeriod=10;
//----
input Smooth_Method        bMA_Method=MODE_SMMA_;
input uint                 bLength=5;
input int                  bPhase=100;
Testing result:
Fig. 17 Strategy #6. Testing results
Test of Strategy #7 (Donchian channel combined with MACD, in which the price series is replaced by Williams' AO values).
Preset:
input string               Inp_EaComment="Strategy #7";                 //EA Comment
input double               Inp_Lot=0.01;                                //Lot
input MarginMode           Inp_MMode=LOT;                               //MM
input int                  Inp_MagicNum=1111;                           //Magic number
input int                  Inp_StopLoss=400;                            //Stop Loss(points)
input int                  Inp_TakeProfit=600;                          //Take Profit(points)
input int                  Inp_Deviation = 20;                          //Deviation(points)
//--- Donchian Channel System indicator parameters

input uint                 DonchianPeriod=12;                           //Period of Averaging
input Applied_Extrem       Extremes=HIGH_LOW_CLOSE;                     //Type of Extremum

//--- CronexAO indicator parameters

input Smooth_Method        XMA_Method=MODE_ParMA;                        //Method of Averaging
input uint                 FastPeriod=14;                               //Period of Fast averaging
input uint                 SlowPeriod=25;                               //Period of Flow averaging
input int                  XPhase=15;                                   //Smoothing parameter
Testing result:
Fig. 18 Strategy #7. Testing results
Test of Strategy #8 (Schaff cyclical oscillator with a confirmation based in three Tyrone levels).
Preset:
input string               Inp_EaComment="Strategy #8";                 //EA Comment
input double               Inp_Lot=0.01;                                //Lot
input MarginMode           Inp_MMode=LOT;                               //MM
input int                  Inp_MagicNum=1111;                           //Magic number
input int                  Inp_StopLoss=400;                            //Stop Loss(points)
input int                  Inp_TakeProfit=600;                          //Take Profit(points)
input int                  Inp_Deviation = 20;                          //Deviation(points)

input double               Overbuying=90;                               //Overbuying zone
input double               Overselling=15;                              //Overselling zone
//--- Schaff Trend Cycle indicator parameters

input Smooth_Method        MA_SMethod=MODE_SMMA_;                        //Histogram smoothing method
input int                  Fast_XMA = 20;                               //Fast moving average period
input int                  Slow_XMA = 30;                               //Slow moving average period
input int                  SmPhase= 100;                                //Moving averages smoothing parameter
input Applied_price_       AppliedPrice=PRICE_CLOSE_;                   //Price constant
input int                  Cycle=10;                                    //Stochastic oscillator period

//--- Tirone Levels indicator parameters

input int                  TirPeriod=13;                                //Period of the indicator
input int                  Shift=0;                                     //Horizontal shift of the indicator in bars
Testing result:
Fig. 19 Strategy #8. Testing results
Test of Strategy #9 (Keltner channel drawn as a histogram and the iTrend indicator drawn as a cloud).
Preset:
input string               Inp_EaComment="Strategy #9";                 //EA Comment
input double               Inp_Lot=0.01;                                //Lot
input MarginMode           Inp_MMode=LOT;                               //MM
input int                  Inp_MagicNum=1111;                           //Magic number
input int                  Inp_StopLoss=400;                            //Stop Loss(points)
input int                  Inp_TakeProfit=600;                          //Take Profit(points)
input int                  Inp_Deviation = 20;                          //Deviation(points)

input uint                 BuyLevel=50;                                 //Overbuying zone
input double               SellLevel=-50;                               //Overselling zone
//--- i-KlPrice indicator parameters

input Smooth_Method        MA_Method1=MODE_ParMA;                       //smoothing method of moving average
input uint                 Length1=100;                                 //smoothing depth of moving average
input int                  Phase1=15;                                   //moving average smoothing parameter

input Smooth_Method        MA_Method2=MODE_SMMA_;                        //candles size smoothing method
input uint                 Length2=20;                                  //smoothing depth of candles size
input int                  Phase2=100;                                  //candles size smoothing parameter

input double               Deviation=2.0;                               //channel expansion ratio
input uint                 Smooth=20;                                   //indicator smoothing period

input Applied_price_       IPC=PRICE_TYPICAL_;                          //price constant
input int                  Shift=0;                                     //horizontal shift of the indicator in bars

//--- iTrend indicator parameters

input Applied_price_       Price_Type=PRICE_TYPICAL_;
//--- Moving Average parameters
input uint                 MAPeriod=14;
input ENUM_MA_METHOD        MAType=MODE_EMA;
input ENUM_APPLIED_PRICE     MAPrice=PRICE_CLOSE;
//--- Bollinger parameters
input uint                 BBPeriod=14;
input double               deviation_=2.0;
input ENUM_APPLIED_PRICE    BBPrice=PRICE_CLOSE;
input Mode                BBMode=Mode_1;
Testing result:
Fig. 20 Strategy #9. Testing results
Test of Strategy #10 (The Average Change price momentum and the MA fan FigurelliSeries).
Preset:
//--- Average Change indicator parameters
input Smooth_Method        MA_Method1=MODE_SMMA_;                       //smoothing method of moving average
input int                  Length1=12;                                  //smoothing depth of moving average
input int                  Phase1=15;                                   //moving average smoothing parameter
input Applied_price_       IPC1=PRICE_CLOSE_;                           //moving average price constant

input Smooth_Method        MA_Method2=MODE_EMA_;                        //indicator smoothing method
input int                  Length2 = 5;                                 //indicator smoothing depth
input int                  Phase2=100;                                  //indicator smoothing parameter
input Applied_price_       IPC2=PRICE_CLOSE_;                           //price constant for smoothing

input double               Pow=5;                                       //power
input int                  Shift=0;                                     //horizontal shift of the indicator in bars

//--- Indicator parameters
input uint                 StartPeriod=6;                               //initial period
input uint                 Step_=6;                                     //periods calculation step
input uint                 Total=36;                                    //number of Moving Averages
input ENUM_MA_METHOD        MAType=MODE_EMA;                            //Moving Averages smoothing type
input ENUM_APPLIED_PRICE     MAPrice=PRICE_CLOSE;                       //price timeseries of Moving Averages
input int                  Shift1=0;                                    //Horizontal shift of the indicator in bars
Testing result:
Fig. 21 Strategy #10. Testing results
Conclusions
Testing and optimization of the analyzed trend following strategies showed the following results.
- In most strategies, the total profit was obtained when trading during strong or prolonged unidirectional movements.
- The total loss and appropriate areas with several losing trades in a row were obtained when trading during a flat period.
- In some strategies, losses were obtained due to unmodifiable and identical Take Profit and Stop Loss.
- In some cases, trend identification was lagging, so it was necessary to change the timeframe.
Conclusion
Dee below a summary table with the names of Expert Advisor that were developed and used in this article, as well as auxiliary classes and a list of indicators used in the above trend following strategies. The attached archive contains all the listed files, which are located in appropriate folders. For their proper operation, you only need to save the MQL5 folder into the terminal root folder.
Programs used in the article:
| # |
Name |
Type |
Description |
|---|---|---|---|
| 1 |
Strategy_1.mq5 |
Expert Advisor |
Strategy #1. The ADXCloud indicator with a confirmation from RSI drawn as a histogram. |
| 2 |
Strategy_2.mql5 |
Expert Advisor |
Strategy #2. The Standard Deviation trend indicator drawn as a histogram with RVI used for confirmation. |
| 3 |
Strategy_3.mq5 |
Expert Advisor | Strategy #3. A cloud interpretation of AC by Bill Williams and a combined Bears Power - Bulls Power indicator. |
| 4 |
Strategy_4.mq5 |
Expert Advisor |
Strategy #4. Ehlers' gravity center with a confirmation by the average price speed indicator. |
| 5 |
Strategy_5.mq5 | Expert Advisor | Strategy #5. A complex Binary Wave indicator. |
| 6 |
Strategy_6.mq5 |
Expert Advisor |
Strategy #6. A complex Weight Oscillator combined with LeMan Objective. |
| 7 | Strategy_7.mq5 |
Expert Advisor |
Strategy #7. Donchian channel combined with MACD, in which the price series is replaced by Williams' AO values. |
| 8 | Strategy_8.mq5 | Expert Advisor | Strategy #8. Schaff cyclical oscillator with a confirmation based on three Tyrone levels. |
| 9 | Strategy_9.mq5 | Expert Advisor | Strategy #9. Keltner channel drawn as a histogram and the iTrend indicator drawn as a cloud. |
| 10 | Strategy_10.mq5 | Expert Advisor | Strategy #10. The Average Change price momentum and the MA fan FigurelliSeries. |
| 11 | TradeFunctions.mqh | Code Base | A class of trading functions. |
| 12 | smoothalgorithms.mqh | Code Base | Classes with the smoothing algorithms used in the indicators. |
| 13 | adxcloud.mq5 | Indicator | Used in Strategy #1. |
| 14 | rsi_сolor.mq5 | Indicator | Used in Strategy #1. |
| 15 | colorstddev.mq5 | Indicator | Used in Strategy #2. |
| 16 | colorzerolagrvi.mq5 | Indicator | Used in Strategy #2. |
| 17 | Bear_Bulls_Power.mq5 | Indicator | Used in Strategy #3. |
| 18 | cronexao.mq5 | Indicator | Used in Strategy #3. |
| 19 | centerofgravityosma.mq5 | Indicator | Used in Strategy #4. |
| 20 | average_speed.mq5 | Indicator | Used in Strategy #4. |
| 21 | binarywave.mq5 | Indicator | Used in Strategy #5. |
| 22 | objective.mq5 | Indicator | Used in Strategy #6. |
| 23 | WeightOscillator.mq5 | Indicator | Used in Strategy #6. |
| 24 | donchian_channels_system.mq5 | Indicator | Used in Strategy #7 |
| 25 | cronexao.mq5 | Indicator | Used in Strategy #7 |
| 26 | schafftrendcycle.mq5 | Indicator | Used in Strategy #8 |
| 27 | tirone_levels_x3.mq5 | Indicator | Used in Strategy #8 |
| 28 | i-klprice.mq5 | Indicator | Used in Strategy #9 |
| 29 | i_trend.mq5 | Indicator | Used in Strategy #9 |
| 30 | averagechange.mq5 | Indicator | Used in Strategy #10 |
| 31 | figurelliseries.mq5 | Indicator | Used in Strategy #10 |