How to Develop an Expert Advisor using UML Tools
Denis Kirichenko | 18 April, 2012
Scientists investigate that which already is; Engineers create that which has never been.
Albert Einstein
Introduction
In my article Simulink: a Guide for the Developers of Expert Advisors I suggested modeling an Expert Advisor using dynamic systems. However, this approach represents only one aspect of the designer of trading systems - the dynamic behavior of the system. Professionals have specific tool that expand the methodology of a trading system developer. In this article we will discuss how to develop an Expert Advisor using the universal tool - graphical language UML.
In general, being a graphical language, UML is used for visual modeling of object-oriented software systems. But, as I see it, we can use its tools to develop a trading system. Moreover, MQL5 belongs to the family of object-oriented languages, and this makes our task easier.
For the modeling purposes, I chose free for non-commercial software Software Ideas Modeler.
1. UML Basics
How UML can help to create an Expert Advisor? First, the graphics - the problem of multi-aspect modeling can be solved using the graphic images that are available in the language. Second, the readability. Even is an Expert Advisor is large and complex, the universality of UML allows to present its model using diagrams.
As the developers of UML say, the specific feature of the human perception lies in the fact that a text with images is more easily perceived than a bare text.
Let's briefly discuss the basics of UML. If you are interested in the subject, you can learn the UML tools from the numerous publications that are freely available on the web.
The UML structure can be displayed in a diagram (Fig. 1).

Fig. 1. The UML structure
Building blocks include the following: entities (the elements of the model), relationships (that bind the things) and diagrams (representing UML models).
UML diagrams allow to visualize the representation of the designed system from different points of view.
Common mechanisms include: specifications (description of the semantics), adornments (marking the important characteristics of the model), common divisions (abstraction and its instances, interfaces and implementation), extensibility mechanisms (constraints, stereotypes and tagged values).
Architecture is responsible for the high-level presentation of the system in its environment. The UML architecture can be best described by the "4+1 architecture view" (Fig. 2):
- Logical view
- Process view
- Development view
- Physical view
- Scenarios

Fig. 2. 4+1 Architecture view
It should also be noted that the UML has its own hierarchy of canonical diagrams (Fig. 3). Language version 2.2 uses 14 types of UML diagrams.

Fig. 3. Canonical UML diagrams
Further I propose to consider some special cases of the use of UML diagrams. Thus, we can move from an abstraction to a specific variant of using any of the diagrams for EA development purposes. Once again, the principle of multi-aspects design of trading systems, which is provided by the hierarchy of UML diagrams, contributes to the systematical and comprehensive solution of the TS creation task.
2. UML diagrams
2.1 Use Case diagrams
As the saying goes, a good start is half the battle. Usually, though not necessarily, analytical work begins with use case diagrams. It describes the system from the perspective of users.
When creating it, we can:
- specify the variants of the TS use
- specify the boundaries of the TS
- determine TS actors
- define the relationship between the actors and TS versions.
Use case is a list of steps, typically defining interactions between a role (known in UML as an "actor") and a system, to achieve a goal .
An actor "specifies a role played by a user or any other system that interacts with the subject. Actors may represent roles played by human users, external hardware, or other subjects.
Relationship is a semantic connection between individual elements of a model.
You may notice that this type of diagram is fairly general, and reflects the conceptual nature of the TS, rather than its implementation. But that's the point - moving from general to specific, from abstract to concrete. Who said that we are not artists? We draw a picture, starting with general ideas and sketches. First we draw strokes in a canvas. Then add colors. Draw details...
So, let's try to create a use case diagram for a trading system.
As input actors, I've chosen the following roles: Developer, System analyst, Risk manager and Administrator. It should be noted that these roles can be played by one or more persons. What actions does our trading system take and what actions are taken in relation to it?
Thus, the Developer can create and implement a TS. Additionally, he or she can participate in the optimization of the TS. The System analyst optimizes the TS. The Risk manager is responsible for risk management. The Administrator monitors the overall work of the TS. On the output side, we see that the User makes a profit as a result of the functioning of the TS. This role is a sum of such roles as the Trader and Investor. And the Manager as well as the Administrator supervises the work of the TS.
The diagram contains the block "Trading System". It expresses the TS boundary and separates it from the outside world.
Now a few words about the relationship between the actors and the use cases, as well as between the actors and other actors, and the use cases and other use cases. Most of the relationships are represented by associations, marked by a solid line. This means that a certain actor initiates a use case. Thus, the Risk manager initiates the process of risk management, etc. The actors that initiate the use cases are principal, and those that use the results of actions committed - are secondary. For example, a secondary actor is the Manager on the output side.
Association may indicate that the actor initiates the appropriate use case.
Generalization simulates the appropriate generality of roles.
Extension is a kind of dependency relationship between the base use case and its special case.
Include defines the relationship of the base use case to another use case, the functional behavior of which is not always used by the base case, but only under additional conditions.
However, note that a secondary role with respect to the use case does not mean that this role is of secondary importance. In addition, in the diagram we see that the role of the TS User consists of the roles of the Trader and Investor through the relations of generalization, shown as a line with the "unpainted" triangular arrowhead.

Fig. 4. Use-case diagram of the TS
Use cases "Open position" and "Close position", in turn, are related by a generalization with the "Trading". The latter case is the base one for the other two. Thus, it includes the use case "Manage risk". And its behavior is complementary to the dependent case "Profit".
Since the TS profit is formed on the condition that the Sell price of an asset is larger than its Buy price, I used the extend relationship for these cases. The diagram also shows the extension point, i.e. a specific condition, under which the case "To profit" is used. Dependency relationships are displayed by the dashed line with an arrow with the corresponding stereotypes "include" and "extend".
For each use case you need to create a scenario, that is to describe a sequence of steps that leads to the intended target. The use case can be described in several forms. The commonly accepted forms include the following: text descriptions, pseudocode, activity diagram, interaction diagram.
It should be noted that a trader is interested in a TS in its strict sense, rather than that which is shown in Fig. 4. Therefore, further I suggest to focus on the use case "Trading" with the extension "To profit".
2.2 Class Diagram
Using the class diagram we will describe the TS structure. Namely, we will present a model of a static structure of the trading system in terms of classes of object-oriented programming. Thus, we will reflect the programming logic of the TS.
In UML a class diagram is a type of static structure diagrams. It describes the structure of the system by showing its classes, their attributes and operators, as well as the relationship of the classes.
What are the advantages of this type of diagram? Those who are a bit familiar with the object-oriented programming languages, will immediately notice the familiar notion of "class". The class acts in the UML class diagram as the basic building block. For example, when generating a C++ code, the UML class block is automatically created in the form of a class template. You will only need to finish the implementation of each method and property.
Now let's try to design something as an example. But first I would like to draw your attention to article "Prototype of a Trading Robot", in which the author describes the advantages of using a straight logic. In my opinion, very effective and productive is the principle of nesting - "macros-functions-trade modules".
For example, we need an Expert Advisor that uses the possibility of trading classes of the standard library.
Using the Class block, create a class model in the class diagram. I called it CTradeExpert. We add some attributes (in MQL5 they are data members of the class) for the new class. They are: Magic_No, e_trade, e_account, e_deal, e_symbol, e_pnt. We also insert a constructor method of class CTradeExpert. Graphically, the operation will be as shown in Fig. 5.

Fig. 5. UML model of class CTradeExpert
The character "-" in front of an attribute indicates that the attribute has the access right in the mode «private», «#» - «protected», «+» - «public». Thus, for attribute Magic_No the access specifier is set as private, for e_pnt - as public, and for others - as protected. A colon that follows the attribute name, indicates a data type for attributes and type of data returned for methods. For example, the attribute Magic_No is of type int, e_trade - CTrade, etc.
We are not adding any methods and attributes now, simply show how our class CTradeExpert is connected with the classes of the Standard Library. To do this, add 6 blocks of classes to the diagram and call them as follows: CTrade, CAccountInfo, CDealInfo, CSymbolInfo, CObject. Now we associate the model of the CTradeExpert class with 4 blocks of trade classes through dependence relations with the "use" stereotype (the dash-dotted line with an arrow).
Dependency is a semantic relationship between two entities, in which a change in the independent one of them can affect the semantics of the other dependent one.
Stereotype in UML is a description of the object behavior.
Then, we link these blocks with the block CObject by the generalization relation using a line with an "unpainted" triangular arrowhead. Add comments to the standard library classes. Now, our UML diagram looks like shown in Figure 6.

Fig. 6. UML class diagram
We now only need to generate the code using the "Generate" function of the "Generate" tab on the sidebar (Fig. 7).

Fig. 7. Generated Code
The most suitable is the С++ language. We will use C++ the generate the code of the Expert Advisor class, and then we will easily translate it into MQL5.
For this diagram the generated code is as follows:
//
class CTradeExpert
{

private:
        int Magic_No;

protected:
        CTrade e_trade;

protected:
        CAccountInfo e_account;

protected:
        CDealInfo e_deal;

protected:
        CSymbolInfo e_symbol;

public:
        double e_pnt;

public:
        void CTradeExpert ()
    {

    }

};


//
class CObject
{
};

//
class CTrade : public CObject
{
};

//
class CDealInfo : public CObject
{
};

//
class CSymbolInfo : public CObject
{
};

//
class CAccountInfo : public CObject
{
};
A really familiar syntax, isn't it? We just need to fit the body of the class. For this purpose in MetaEditor we create a file for the new class TradeExpert.mqh. Copy the previously generated code to it. For readability we delete the repeated access specifier protected for the members of the CTradeExpert class.
Delete the lines connected with the declaration of the standard library classes. After that, add the file including instruction # Include for each used class of the standard library, because these classes are already defined by the developer. And add our comments. As a result, we obtain the code like this:
//includes
#include <Trade\Trade.mqh>
#include <Trade\AccountInfo.mqh>
#include <Trade\DealInfo.mqh>
#include <Trade\SymbolInfo.mqh>
//+------------------------------------------------------------------+
//|                                                                  |
//+------------------------------------------------------------------+
class CTradeExpert
  {
private:
   int               Magic_No;   // Expert Advisor magic

protected:
   CTrade            e_trade;    // An object for executing trade orders
   CAccountInfo      e_account;  // An object for receiving account properties
   CDealInfo         e_deal;     // An object for receiving deal properties
   CSymbolInfo       e_symbol;   // An object for receiving symbol properties

public:
   double            e_pnt;      // Value in points

public:
                     CTradeExpert()
     {
     }
  };
//+------------------------------------------------------------------+
now let's add some more trading function modules to our Expert Advisor class.
These may be: CheckSignal, OpenPosition, CheckPosition, ClosePosition etc. I hope that you already know the principle of "condition serving". In this case our test class CTradeExpert would not seem difficult to you. I specifically focused on some already familiar example of an Expert Advisor to make it easier for you to understand the mechanisms of UML.
So, now the model of the class looks like is shown in Fig. 8.

Fig. 8. UML model of class CTradeExpert
For the updated model of the class we can also generate a code using the method already described.
2.3 Activity Diagram
Using this type of UML-diagrams, we can study the behavior of the system using the models of data flow and control flow. Activity diagrams are graphical representations of workflows of stepwise activities and actions.
The activity diagram differs from the flowchart, which describes only the steps of the algorithm. The activity diagram notation is wider. For example, it is possible to specify the state of objects in it.
Activity diagrams are used by developers for describing:
- business rules
- single use cases
- complex series of multiple use cases
- processes with of solutions and alternative streams
- parallel operations
- program flows and logic control structures
Assume that the created expert class CTradeExpert will be used in the file of the Expert Advisor Test_TradeExpert.mq5. As we remember, the default template when creating an EA in the MetaEditor 5 provides three default event handler functions: OnInit, OnDeinit and OnTick. Let's dwell on them.
Let's try to display a diagram with our EA operation accounting for the file Test_TradeExpert.mq5. Here it should be noted that the Expert Advisor, or rather its structure, is rather primitive. We are only training now. A simple EA structure is ok for this purpose.
Let's design a diagram for a use of our Expert Advisor, the algorithm of which is represented in the file Test_TradeExpert.mq5.
So, it all starts with the initial node (Fig. 9). From this node, a control token moves to the node calling the action "Create an Expert Advisor instance". This action initiates the flow of the object (blue arrow), which changes the state of the object node (myTE=created), and control flow to a node that calls "Initialize the Expert Advisor".
A control flow is represented in the form of an activity edge, which connects the two nodes of activity and over which only control tokens are passed.
An object flow is represented as an activity edge, to which only object or data tokens are passed.
An activity node is an abstract class for individual points in the flow of activities connected by edges.
A decision node is a control node, which chooses between outgoing flows.
An object node represents objects used in the activity.
An activity edge is an abstract class for directed connections between two activity nodes.
The initial node shows where the activity begins.
The final node of an activity completes all the activity flows.It, in turn, changes the state of the object myTE (myTE=initialized) and passes the control token to the decision node. If the Expert Advisor is initialized successfully, the control flow goes to the node "Process the trade event NewTick». If the initialization fails, then the control token first enters the generalization node, and then the action node "Deinitialize Expert Advisor".
Tokens are abstract constructions that are introduced for convenience in describing the dynamic process of execution of a statistically defined activity graph. The token can not contain any additional information (an empty token); in this case it is called a control flow token, or it may contain a reference to an object or data structure, and in this case it is called a data flow token.
Let's look at the first control flow that comes from the decision node. It is directed to an area with an interrupted action, as indicated by a rectangle with rounded corners drawn by the red dotted line and the stereotype of "interruptible". When the control flow is in this area, it may unexpectedly stop. If you activate the action node (orange flag) that receives the event "Unload Expert Advisor", it will interrupt all the flows. The control token moves to the interrupt edge (orange zigzag arrow), and then to the connection node. After that the EA is deinitialized. Then, the control token goes to the node "Delete global variables", then the flow will be completed in the final activity node.
The action node "Deinitalize Expert Advisor" also changes the state of the object myTE (myTE=deinitsialized) by an object flow. The node "Delete global variables", in turn, removes the object myTE (myTE=deleted).

Fig. 9. Activity diagram for Test_TradeExpert.mq5
Assume that the control flow is stable: the EA is not unloaded. From the node "Process the trade event NewTick» the flow moves to another block - expansion area, the stereotype of which is defined as "iterative" (green rectangle with dotted lines).
I call this area "Trading block", to reflect the basic characteristics and improve the perception of the diagram. A characteristic feature of the block is cyclical execution of operations for incoming objects. We need only 2 cycles - handle the long and short directions. At the entrance to the block and the output from the block there are expansion nodes that include trade direction objects (long or short).
An expansion node is a collection of objects which enters or comes out of the expansion area, which is run once for each object.
The action node that sends a signal (send signal action) represents signal sending.
The action node that accepts an event (accept event action), waits for receiving of an event of the appropriate type.
Thus, each direction is handled by such nodes as: "Check signal" (signal sending node), "Receive signal" (signal receiving node), "Open position" (signal sending node), "Check position" (signal sending node), "Close position" (signal sending node). It should be noted that the direction object (dir) can be passed in the object flow between action nodes, as indicated by violet arrows. Operations in a block will continue as long as the Expert Adviser is unloaded.
2.4 The Sequence Diagram
We use the sequence diagram to describe the object interaction sequence. A very important aspect of this type of diagram is time.
So, the diagram has two scales in an implicit form. The horizontal one is responsible for the sequence of object interactions. The vertical one is a time axis. The beginning of the time interval is the upper part of the diagram.
The top of the diagram contains diagram objects, which interact. An object has its own lifeline as a vertical dotted line. The objects exchange messages. They are represented by arrows. When an object is active, it receives the control focus. Graphically, this focus is expressed as a narrow rectangle on the lifeline.
An object is a rectangle that contains an underlined object name and class name (optional) separated by a colon.
An object lifeline is a line that shows the existence of an object for some period of time; the longer the line is, the longer the object exists.
The control focus is drawn as a narrow rectangle, the upper side of which denotes the beginning of receiving of the control focus by the object (activity start), and its downside - the end of the control focus (end of activity).
In UML, each interaction is described by a set of messages, which the objects participating in it exchange.
Let's have some practice.
The terminal is an actor. It initiates the operation of the Expert Advisor. Other objects marked with the "event" stereotype are the events of the client terminal: Init, Deinit, NewTick. Of course, if you want you can extend the range of events. When starting an Expert Advisor, the myTE object is created at the global level. It is an instance of the CTradeExpert class. The class object is slightly lower than other objects in the diagram, which indicates that it is created after the constructor function.
A creation command is marked with a dash-dotted line an with open arrow and a message 1.1 CTradeExpert(). The dash-dotted line with an arrow indicates the "create" type of the default constructor CTradeExpert(). After creating an instance of CTradeExpert step 1.2 is activated - the control focus is returned to the terminal. For readability, I indicate synchronous messages in the format of #.#, such as 1.1, and asynchronous - #. Then, the terminal handles the Init event using the OnInit() function in step 2.1, the focus is returned on step 2.2. "Call" type messages are shown as lines with a "painted" triangle arrow at the end.
If the Init event returns a nonzero value to the terminal, it means that the initialization failed: step 3.1 is used which leads to the generation and handling of the Deinit event. In step 3.2 the control focus is returned to the terminal. Then the CTradeExpert class object is deleted (step 4.1). By the way, when creating a class diagram, I have not included the destructor function CTradeExpert in the class. This can be done later. This is one of the advantages of diagram construction - the process of construction of several diagrams is iterative. What has been done first for one diagram, can be done then for another, and later you can modify the first one.
It should be noted that the MQL5 code of a standard EA template does not contain a block that handles failed initialization. I've specified it to save the logic of sequence. The UML sequence diagram uses the opt block with a guard condition OnInit()!=0, which is equivalent to the MQL5 construction if(OnInit()!= 0) {}.
In step 4.2, control is transferred to the terminal.
Now the terminal is ready to handle the event NewTick.
Processing of this event is in the block loop meaning an infinite loop. That is, the EA will handle this event until we disable it. The terminal processes the NewTick event using the OnTick function (step 5). In step 6, the control focus is transferred to the Expert Advisor myTE. Using 4 reflexive messages, it implements the following functions: CheckSignal, OpenPosition, CheckPosition, ClosePosition. The reflexivity is due to the fact that the Expert Advisor object sends messages to itself.
In addition, these functions of the CTradeExpert class are enclosed in the loop(2) block. Two means that the loop consists of two passes. Why two? Because it handles two directions of trade - long and short (from step 7 to 10). In the 11th step, the focus is passed to the terminal.
Steps 12 and 13 are responsible for deinitialization and deletion of the Expert Advisor object, respectively.
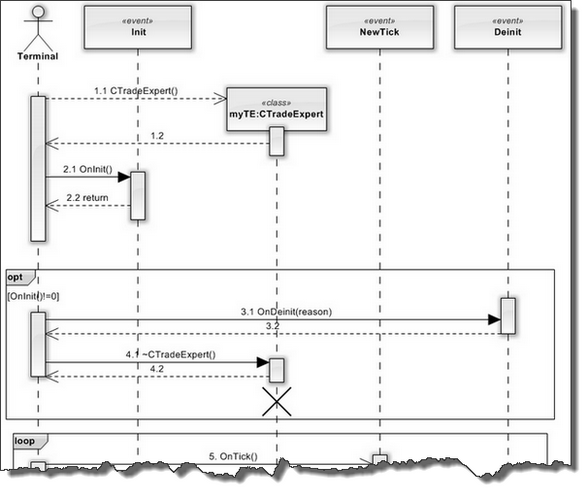

Fig. 10. SD diagram for Test_TradeExpert.mq5
Thus, we have got the primary design skills. With the help of diagrams the created, the work of the developer is optimized. We can now start writing a code for the file Test_TradeExpert.mq5. Of course, you can do without diagrams. But when you have a complex Expert Advisor, the use of diagrams reduces the likelihood of errors and allows you to efficiently manage the development of your TS.
Using the Expert Advisor template, we now create Test_TradeExpert.mq5.
We create an instance of the CTradeExpert myTE class at the global level.
Now let's fill the body of the OnTick() function.
We write the functions of the class as follows:
for(long dir=0;dir<2;dir++)

     {

      myTE.CheckSignal(dir);

      myTE.OpenPosition(dir);

      myTE.CheckPosition (dir);

      myTE.ClosePosition(dir);

     }
Something like this will be the handling of the NewTick event. Of course, we still need to specify each of the functions that will be used by the class data members, among others. But let's leave this job for the future. Now our goal is to transfer the logic of UML diagrams into the MQL5 code.
3. Development and Presentation of an Expert Advisor Based on the UML Diagrams
As an example, let's create diagrams for a complex Expert Advisor. Let's define its features in the context of a given strategy implemented in the MQL5. In general, our Expert Advisor will perform trade operations; in particular it will generate trading signals, maintain open positions and money management. It is rather a template trading strategy. However, for training purposes we will try to work with this one.
First, we create a use case diagram for our EA. Only to some extent will it be different from the one discussed earlier. I paid attention to the internal environment of the TS, ignoring the outside (Fig. 11), as in the code we will implement only the trading tasks.

Fig. 11. Use-case diagram of the TS
Now let us define the structure of the Expert Advisor. Assume that we will use the standard library developments, because it is consistent with the stated objectives of the TS. Recently, it has been substantially expanded. And above all it concerns the classes of trading strategies. So, our goal is to create a class diagram. It will not be simple, so you need patience.
Here I would like to note that we consider the standard library for a few reasons. First, on its basis we try to create a trading robot. And, second, which is also important, we have some practice working with UML diagrams. Third, perhaps the library itself is very valuable. So we can learn many useful things from the libraryt, and at the same time try to understand its not quite simple structure.
The conversion of a code in the structure of a UML diagram is called reverse engineering. In fact, we are doing this manually. There is professional software that allows you to do this automatically (IBM Rational Rose, Visual Paradigm for UML, etc.). But for practical purposes, I think we need to work "manually".
Let's create a model of the base class to implement trading strategies CExpert using the "Class" block. Let's see what other classes and constructions are used in the body of the CExpert class. First, it should be noted that the CExpert class is derived from the base class CExpertBase, which, in turn, is derived from the base class CObject.
In the diagram we create blocks for these classes, and define the relationship between the classes using a line with an "unpainted" triangular arrowhead (generalization). Add a comment to the model of the CExpert class (a yellow rectangle with a bent corner). The intermediate class structure now looks like this - Fig. 12. Let's call the diagram Expert.

Fig. 12. The Expert diagram, the initial view
Let's see the code in the Expert.mqh file. The class CExpert, among other things, involves enumerations ENUM_TRADE_EVENTS and ENUM_TIMEFRAMES, one of the 8 predefined structures MqlDateTime. The class also uses other class instances, such as: CExpertTrade, CExpertSignal, CExpertMoney, CExpertTrailing, CIndicators, CPositiontInfo, COrderInfo.
Now we need to make some changes to the diagram. First, we specify that the classes CExpertSignal, CExpertMoney, CExpertTrailing are derived from a base class CExpertBase, and classes CPositiontInfo, COrderInfo are derived from CObject (I've set the stereotype "metaclass" for it).
Let's mark the dependency relations with the "use" stereotype between the block of the CExpert class and other classes, do not forget about the MqlDateTime structure and enumerations. We change the color style of the blocks and obtain the following structure - Fig. 13.

Fig. 13. The Expert diagram, the initial view
However, this structure does not reflect the full picture, because there are a number of classes that are indirectly used by the already mentioned classes. What kind of classes are they? First, the CExpertTrade class is derived from CTrade. The latter is a subclass of CObject.
The CExpertTrade class uses the ENUM_ORDER_TYPE_TIME enumeration, classes CSymbolInfo and CAccountInfo are also children of CObject. The CTrade class also uses instances of the CSymbolInfo classes. Let's make changes to the diagram. Now our diagram has the following form - Fig. 14.

Fig. 14. The Expert diagram, the initial view
Again, the diagram is not complete. For example, if you look in the standard library file Trade.mqh, you will see that CTrade uses several different structures, enumerations and the CSymbolInfo class. If they are all displayed on one diagram, it will be too much loaded. And this will make it hard to understand.
To cope with this difficulty, I used a package for the diagram. It encapsulates related classes, enumerations, other packages, etc. I connected the package with the diagram elements through the interface. For example, the diagram for the package CTrade can be represented as follows - Fig. 15.

Fig. 15. The class diagram for the CTrade package
The diagram of the CTrade package shows dependence relations of the CTrade class with enumerations and structure.
Relations with the CObject base class and the used CSymbolInfo class is implemented through an interface.
Near the interfaces there is an icon of relation with the class diagram that contains the CTrade package as a single element. Clicking on any of the interfaces automatically brings to the original diagram (Fig. 16).

Fig. 16. The Expert diagram with interfaces
Interface relations are orange. The icon of the class diagram next to the CTrade package indicates the possibility of moving to this diagram. Thus, using the encapsulation, we can significantly improve the readability of the class diagram.
So, let's move on. The CObject class uses pointers to instances of the same class in its body. Therefore, we can set the dependence relationship for the CObject block with the stereotype "use" relative to itself.
Let's look at the block of the CExpertBase class model. Based on the first lines of the header file ExpertBase.mqh we can say that this class uses multiple instances of various classes, and enumerations. Therefore, for the class model and its relationships it is reasonable to create the package CExpertBase.
So, first we define the CExpertBase class model in the package diagram. Through the interface we show relationship with the base class CObject, and the relationship of use with the classes CSymbolInfo and CAccountInfo. Then, using blocks of classes and relations of dependence, we specify that the CExpertBase class uses the following classes: CiOpen, CiHigh, CiLow, CiSpread, CiTime, CiTickVolume, CiRealVolume.
The first four classes are derived from CPriceSeries, and the latter four – from CSeries. Moreover, the CSeries class has a child CPriceSeries and is, in turn, a child of CArrayObj. The inheritance relationships have been used before, as we remember. Denote them as a generalization relationship in the diagram.
Do not forget that the class CExpertBase uses in its body such enumerations as: ENUM_TYPE_TREND, ENUM_USED_SERIES, ENUM_INIT_PHASE, ENUM_TIMEFRAMES. The last enumeration is also used by the children of the class CPriceSeries and class CSeries. Not to lose the relationships, and to make the diagram clear, let's adjust the style for each of the elements of the diagram. As a result, we obtain the following diagram (Fig. 17).
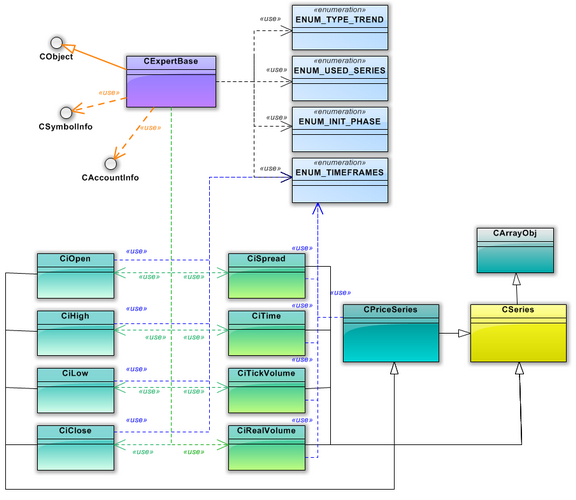
Fig.. 17. The class diagram for the CExpertBase package
It is not complete yet, and we will have to work some more on it. It turns out that the four classes, which inherit the CPriceSeries class also use the CDoubleBuffer class. In addition, each of the four classes uses its buffer class that derives from CDoubleBuffer. Thus, COpen uses COpenBuffer etc.. CDoubleBuffer has a base class (CArrayDouble) and uses ENUM_TIMEFRAMES.
CArrayDouble inherits CArray, uses pointers to the instances of its same class and the ENUM_DATATYPE enumeration. The COpenBuffer class and other buffer classes of price series (CHighBuffer, CLowBuffer, CCloseBuffer) use the ENUM_TIMEFRAMES enumeration.
The four classes that inherit the CSeries class only use their own buffer classes (CSpreadBuffer, CTimeBuffer, CTickVolumeBuffer, CRealVolumeBuffer). The first of the class buffers CSpreadBuffer inherits CArrayInt, others – CArrayLong. The last two classes use the pointers to the instances of their own class, the ENUM_DATATYPE enumeration and are derived from CArray, which, in turn, is a child of class CObject.
The CPriceSeries class and its children use the CDoubleBuffer class and the ENUM_TIMEFRAMES enumeration.
CSeries uses enumerations ENUM_SERIES_INFO_INTEGER, ENUM_TIMEFRAMES. It inherits CArrayObj. The latter one inherits CArray, uses ENUM_POINTER_TYPE, pointers at the instances of its own class and the CObject class. As a result, we obtain the diagram shown in Figure 18.

Fig. 18. Extended class diagram for the CExpertBase package
And the original diagram Expert for classes and packages CExpert, CExpertBase, CSymbolInfo, CAccountInfo and CObject with interfaces looks as follows (Fig.19).

Fig. 19. The Expert diagram with interfaces
I've also added the ENUM_ORDER_TYPE enumeration used by CExpertTrade. For readability, I've marked the group of relationships with different colors.
We continue our work. I hope that you understand the logic. The model of a class on the diagram may have many relationships with other classes and other entities. So I just replace some set with a package in the base diagram.
So, let's study CSymbolInfo. If you look at the code of SymbolInfo.mqh, you will see that the base class CSymbolInfo uses some MQL5 enumerations and structures. It's good to use a package for it and its relationships (Fig. 20).

Fig. 20. Diagram of the CSymbolInfo package
Some free space in the diagram can be used for comments. Also, I've marked the interface of relation with the parent class CObject. The original Expert diagram of packages and classes will be slightly modified. I will give its updated version later on, when all the classes and packages are reflected in the diagram.
So, let's move on. Let's look at the MQL5 code in AccountInfo.mqh. As it turns out, CAccountInfo also uses some enumerations. We reflect them on the diagram of the package that will create for this class and its relationships with other entities (Fig. 21).

Fig. 21. CAccountlInfo package diagram
Now let's deal with the CExpert class. For this class, we also create a package CExpert, which will appear as shown in Fig. 22. We continue to improve the readability of our main diagram. The CExpert class is connected with several other classes, as indicated by the orange interface lines with an arrow.

Fig. 22. CExpert package diagram
Let's explore other remaining classes. We will creaet more packages for them.
CExpertSignal derives from CExpertBase. This relationship has already been shown on the original diagram Expert. In addition, the CExpertSignal class uses CArrayObj, COrderInfo, CIndicators and instances of its own class (Fig .23). In particular, the interface of relationship with the CArrayObj class will bring us to the CExpertBase package diagram, which shows the relationship of the CArrayObj class with other entities.

Fig. 23. CExpertSignal package diagram
I am not showing all the diagrams now - they are all available in the attached file Expert.simp. Now let's take a look at our updated diagram of packages and classes Expert (Fig. 24).
As you can see, almost all the key classes in the diagram have been encapsulated into packages to make the diagram easier to understand. I have changed the color of the generalization line into brown, to distinguish it from the line of the dependency relationship.

Fig. 24. The diagram of packages and classes Expert
So, we have reflected all that can be taken from the code available in the standard library for creating diagrams. We only need to add some more blocks, which specify the trading operations of the Expert Advisor.
The very first block is the block of CmyExpert that inherits trading "skills" from the CExpert class. This is the block, for which we have so long been engaged in reverse engineering. He will implement a specific trading strategy. We also need to specify the virtual functions of the base classes of the EA.
for this purpose, we create a block of classes CmyExpertSignal, CmyExpertMoney, CmyExpertTrailing and indicate that they are derived from the appropriate (Fig. 25).

Fig. 25. Expanded diagram of packages and classes Expert
What functions and data should each of the classes include is up to the developer. Here, I'm trying to show the more general scheme, not a specific implementation of a derived class. Thus, for each of the derived classes we can create a separate diagram with a detailed list of included methods and properties, as has been done, for example, in Fig. 8.
Now let's see how we can use the sequence diagram in our work. Let me remind you that it shows how our EA operates with respect to the timeline.
So, we write details of the EA work in chronological order (Fig. 26).

Fig. 26. The Sequence diagram of the Expert Advisor
The terminal serves as an actor. At the global level it creates the myTrader object - an instance of CmyExpert (Step 1.1). Green denotes predefined events of the client terminal (Init, Deinit, NewTick, Trade.) The sequence diagram logic has been described earlier. Here I would like to point out some specific points. When the body of the Expert Advisor grows, and there is more and more code, it becomes more difficult to display it in a diagram.
To solve this problem, use the block approach. A set of some common functions is visualizes in the form of a block. As a rule, it is another sequence diagram. It is said to be an interaction use.
Thus, in this case, I created a sequence diagram called OnInit in order to reflect the logic of handling of the terminal event Init in a separate diagram. Syntactically it is defined as a border with the keyword ref ( reference) and is used when the control token passes from OnInit (step 2.1) to the lifeline of the Init object.
In addition, I've set an interface move to this sequence diagram for OnInit. That is, if you click 2 times on the border, you can actually open a detailed sequence diagram of OnInit (Fig. 27).

Fig. 27. The sequence diagram of OnInit
Moves to other sequence diagrams is very convenient for repetitions of some actions.
For example, the OnInit diagram contains actions connected with EA deinitialization, the processing of which is done in myTrader_Deinit (Fig. 28).

Fig. 28. The sequence diagram of myTrader_Deinit
In general, at this stage of EA design I have four sequence diagrams. Naturally, during a more serious development you may need additional diagrams. For example, I haven't handled other events of the client terminal (NewTick, Trade).
Conclusions
In this article, I suggested to take into account the multidimensional nature of the Expert Advisor development process using the graphical language UML, which is used for visual modeling of object-oriented software systems. The main advantage of this approach is the visualization of the designer.
As with any complex phenomenon, UML has its own disadvantages that the developer should be aware of (redundancy, imprecise semantics, etc.).
I hope that the described methodology of EA development is interesting for you. I would be grateful for any comments and constructive criticism.
Location of files:
| # | File | Path |
Description |
|---|---|---|---|
| 1 | TradeExpert.mqh | %MetaTrader%\MQL5\Include | Expert Advisor class |
| 2 | Test_TradeExpert.mq5 | %MetaTrader%\MQL5\Experts | Expert Advisor |
| 3 | Expert.simp | %Documents%\UML projects | Project of UML diagrams |
| 4 | SoftwareIdeasModeler.4.103.zip | %Program Files%\SoftwareIdeasModeler | Software Ideas Modeler distribution file |
Reference:
- Free UML courses. The Internet University of Information Technology
- Jim Arlow, Ila Neutstadt. UML2 and the Unified Process Practical: Object-Oriented Analysis and Design
- Leonenkov A. Object-Oriented Analysis and Design Using UML and IBM Rational Rose.
- Martin Fowler UML Distilled: A Brief Guide to the Standard Object Modeling Language. - 192 стр.
- Paul Kimmel. UML Demystified. - 272 стр.
- F. A. Novikov, D. Y. Ivanov. Modeling in UML
- Mark Priestly. Practical Object-Oriented Design With Uml, Mcgraw Hill Higher Education; 2nd edition, 2007.