Universal Trend with the Graphical Interface
Dmitry Fedoseev | 27 April, 2017
Contents
- Introduction
- Types of Indicators
- Trend Display
- Used Indicators
- External Parameters
- Creating an Indicator
- Creating a Graphical Interface
- Combining the GUI with the indicator
- Conclusion
- Attachments
Introduction
Two previous articles contained descriptions of how to create a universal oscillator with a graphical interface, and how to develop a universal channel on its basis.
A universal trend indicator can also be created on the basis of the universal oscillator. In order to avoid repetition, we will use a slightly different approach. Some of you may like the new approach.
In the universal oscillator and universal channel, all objects of controls were created in the form class using automatic pointers, their visibility and position were managed using an additional class. Now we will create a universal compound control using the principles described in the "Custom Graphical Controls" series (article 1, article 2, article 3). However, only methods required for this particular article will be created.
Types of Indicators
We will not be limited to the indicators that are traditionally considered to be trend indicators. Any indicator that depends on price direction (moving averages, the RSI indicator and others) can be applied both for determining the entry and for determining the trend. For example, if the price is above the moving average, we may assume that there is an upward trend, and vice versa (Fig. 1).
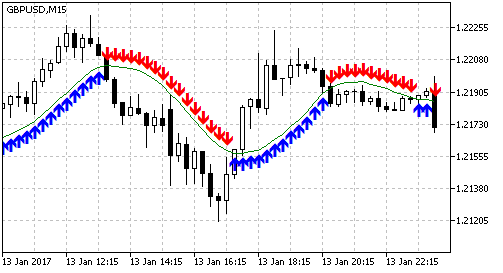
Fig. 1. Using the moving average and the price to determine the trend. Blue upwards arrows indicate the intervals when
we can buy (the price is above the MA), red downwards arrows show intervals, when it is possible to sell (the price is below the MA).
The MA slope can be used similarly: upward slope — uptrend, downward slope — downtrend (Fig. 2).
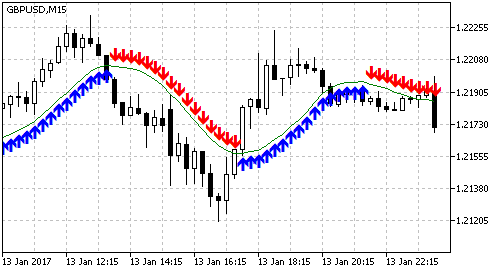
Fig. 2. Using the moving average slope to determine the trend. Blue upwards arrows indicate the intervals when
we can buy (the MA Is directed upwards), red downwards arrows show intervals when selling is possible (the MA is directed downwards)
If a bar is determined, on which the price crossed the MA (the close price on one bar was below the MA, on the next one it is above the MA), in this case the Moving Average is used for determining the entry point. In this case a trading signal exists during one bar (Fig. 3).
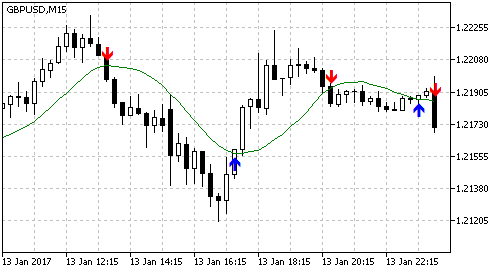
Fig. 3. Using the moving average and the price to determine entry points. Blue upwards arrows indicate the bars
to buy (the price on one bar was below the MA, on the next one it is above the MA), red downwards arrows show
sell bars (the price on one bar was above the MA, on the next one it is below the MA)
The MA slope can be used similarly: bars on which the MA direction changes are entry points (Fig. 4).
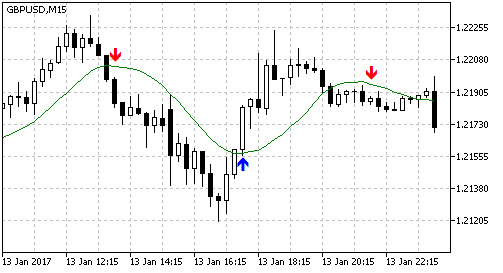
Fig. 4. Using the moving average slope to determine entry points. Blue upwards arrows show the bars to
buy (lower extremes of the MA), red downwards arrows show bars to sell (upper extremes)
In this article, we are interested in trend determining options (like in Fig. 1 and Fig. 2). The options for determining entry bars are given here for comparison and completeness of understanding.
Oscillators are normally used to determine entry points, usually by crossing the level, e.g. RSI (Fig. 5). There are at least two ways of using the Stochastic oscillator for determining entry points: level crossover and intersection of the main and signal lines.
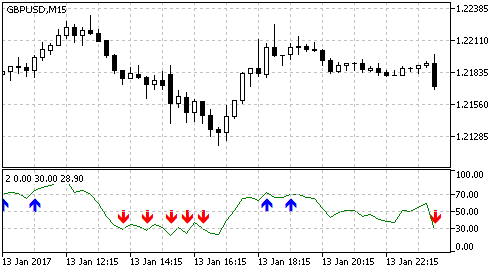
Fig. 5. Determining bars for entry based on the RSI indicator. Blue arrows indicate bars to enter Buy (crossing the level of
70 upwards), red arrows show bars to enter Sell (crossing the level if 30 downwards)
Let us consider how oscillators can be used to identify trend. The answer is obvious for the stochastic: based on the position of the main and signal line, when the main line is above the signal one, we can buy; when the main line is below the signal one — sell (Fig. 6).
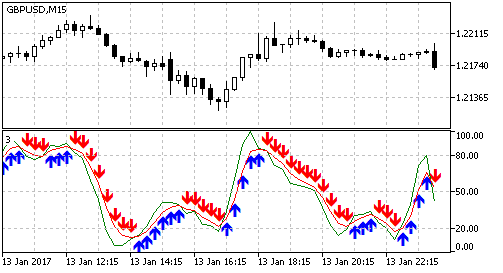
Fig. 6. Positions of the main and signal lines of the Stochastic oscillator for determining the trend. The blue arrows indicate
the uptrend (main line above signal), read arrows mean downtrend (main line below signal)
Similarly, we can use the levels: if the oscillator is above a certain level, we can buy, if it is below — we can sell (Fig. 7).
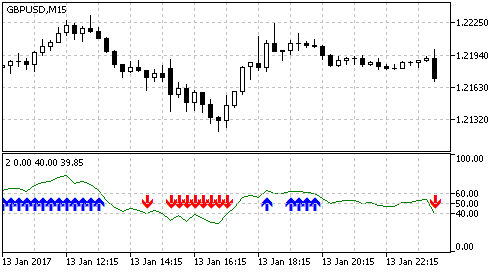
Fig. 7. Using the RSI oscillator and levels for determining the trend. Blue arrows indicate the uptrend
(RSI above 60), red arrows show the downtrend (RSI below 40)
Trend Display
Let us find the most convenient way to display the trend. The very first idea is to plot a line, the color of which changes depending on the trend. Let us consider trend detection using RSI and the levels of 60 and 40. If the RSI line is above 60, we can buy, and if it is below 40, we can sell (Fig. 7). In this case, when the RSI line is between the levels of 40 and 60, we can neither buy nor sell. Now let us interchange the levels: the buy level is equal to 40 (we can buy if values are greater than 40), the sell level is 60 (selling is possible below 60). In this case, both selling and buying are possible between the levels of 40 and 60 (Fig. 8).
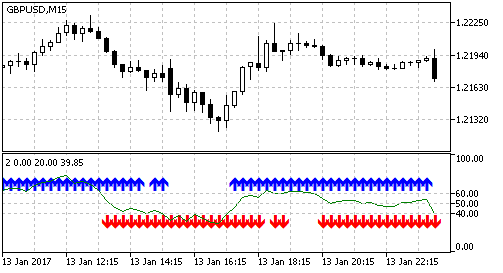
Fig. 8. Using the RSI oscillator to determine the trend. When the buy level is set to 40, and the sell level is 60
there are zones when we can both buy and sell (both blue and red arrows exist).
Therefore, the trend should be displayed as two independent data sets. We will use two indicator buffers: one buffer is slightly shifted to the top, the other one to the bottom (in this case the two buffers can be displayed simultaneously). Since the buffers will not be displayed continuously, it is better to use histograms or icons. Let us select icons. In this case, in addition to different colors for different buffers, we can use different icons. Fig. 9 shows how the indicator will look like.
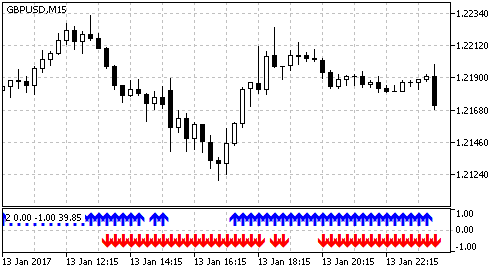
Fig. 9. A convenient way to display the trend
Such a trend display method allows to expand the number of indicators used. For example, you can add indicators that do not depend on the direction, but that only allow/prohibit to trade at various intervals. For example, we can use ATRor STD. If its value is above a certain threshold, then both arrows (up and down) will be displayed. Thus, a universal indicator becomes even more universal.
Used Indicators
Before we begin to create a universal trend indicator, let us define a complete list of indicators used for determining the trend. This will also let us find the necessary set of external parameters (the number and type of variables). Of course, all possible options cannot be easily fit into one indicator — there are too many of them. Even a Moving Average can be used in two different ways. Moreover, two Moving Averages can be used. Therefore, it is necessary to initially provide a simple possibility to modify the indicator.
Some indicator use options can be identical, although it may look not so obvious. For example, use of two MAs (fast and slow) for determining the trend makes the option of trend detection based on MA and price unnecessary. If we set the period of the fast MA equal to 1, this MA will correspond to the price. Therefore, each indicator should be considered separately. Moreover, it is necessary to consider each use variant of each of the indicators.
The indicator has no parameters, it is identical to the OsMA indicator with certain parameters, so it will not be used.
iAD (Accumulation/Distribution)
A very specific indicator. The range of indicator values is not defined, its line is heavily broken, and it is not suitable for determining the trend without appropriate handling (e.g. smoothing). It will not be used.
iADX (Average Directional Index)
Variant 1. The position of lines PDI and MDI. PDI above MDI — uptrend, PDI below MDI — downtrend.
Parameters:
- int adx_period.
Variant 2. Does not depend on the direction. ADX line position relative to a certain level. ADX above the level — buying and selling is allowed. In addition to the indicator parameter, we will need an additional parameter for the level.
Parameters:
- int adx_period — period;
- double level — level.
iADXWilder (Average Directional Index by Welles Wilder)
Similar to ADX.
The indicator consists of three moving averages with different periods and different shift values. There are many ways to use this indicator. We will only use on of them.
Variant 1. The fast line (lips) is above the middle line (teeth), the middle line is above the slow one (jaw) — uptrend, if lines are positioned in the reverse order — downtrend.
Parameters:
- int jaw_period — period of the jaw line;
- int jaw_shift — shift of the jaw line;
- int teeth_period — period of the teeth line;
- int teeth_shift — shift of the teeth line;
- int lips_period — period of the lips line;
- int lips_shift — shift of the lips line;
- ENUM_MA_METHOD ma_method — smoothing type;
- ENUM_APPLIED_PRICE applied_price — price type.
iAMA (Adaptive Moving Average)
The indicator is a moving average. We will use two application variants of all MAs.
Variant 1. Line slope. In addition to the standard indicator parameters, we need a parameter determining the shift of the second indicator point relative to which the slope is checked.
Parameters:
- int ama_period — AMA period;
- int fast_ma_period — fast Moving Average period;
- int slow_ma_period — slow Moving Average period;
- int ama_shift — horizontal shift of the indicator;
- ENUM_APPLIED_PRICE applied_price — price type;
- int shift2 — shift of the point relative to which the slope is checked.
Variant 2. Two lines: fast and slow. The first line is above the slow one — uptrend, fast below slow — downtrend. Two identical sets of standard parameters are required.
Parameters:
- int ama_period1 — AMA period;
- int fast_ma_period1 — fast Moving Average period;
- int slow_ma_period1 — slow Moving Average period;
- int ama_shift1 — horizontal shift of the indicator;
- ENUM_APPLIED_PRICE applied_price1 — price type;
- int ama_period2 — AMA period;
- int fast_ma_period2 — fast Moving Average period;
- int slow_ma_period2 — slow Moving Average period;
- int ama_shift2 — horizontal shift of the indicator;
- ENUM_APPLIED_PRICE applied_price2 — price type.
Note: Variables with the number 1 at the end are used for the fast line, with 2 are used for the slow one.
The indicator has no parameters, it is identical to the MACD indicator with certain parameters, so it will not be used.
The indicator does not depend on the direction, one variant will be used.
Variant 1: does not depend on the direction. The position of the ATR line relative to the level. ATR above the level — buying and selling is allowed. In addition to the indicator parameter, we will need an additional parameter for the level.
Parameters:
- int ma_period — period;
- double level — level.
iBearsPower (Bears Power) and iBullsPower (Bulls Power)
The BearsPower and BullsPower indicators are not symmetrical, i.e. they should be used together: one for Buys signals, the other one for sell signals. We will use BullsPower for determining the uptrend, and BearsPower for determining the downtrend. We will use two variants: the indicator's position relative to the level, and slope.
Variant 1. If BullsPower is above the set level — buying is allowed, if BearsPower is below the same level — selling is allowed. In addition to the standard parameters, we will need an additional parameter for the level.
Parameters:
- int ma_period — period;
- double level — level.
Variant 2. Indicator direction. For this variant, we need an additional parameter determining the shift of the second point relative to which the slope is defined.
Parameters:
- int ma_period — period;
- int shift2 — shift of the second point.
The indicator is a channel.
Variant 1. If the price crosses the upper border upwards, an uptrend starts; when the price crosses the central line downwards, trend is canceled. The indicator works similarly in the other direction for the lower line and downtrend.
Parameters:
- int bands_period — central line calculation period;
- int bands_shift — horizontal shift of the indicator;
- double — number of standard deviations;
- ENUM_APPLIED_PRICE applied_price — price type.
iCCI (Commodity Channel Index)
The indicator is an oscillator in a sub-window. The indicator line is strongly broken even with large periods, so the version with the slope will not be used.
Variant 1. Position relative to a level. If the indicator is above the level — uptrend, if below the negative value of that level — downtrend.
Parameters:
- int ma_period — averaging period;
- ENUM_APPLIED_PRICE applied_price — price type or handle;
- double level — level.
The indicator application is similar to CCI.
Variant 1. Position relative to a level. If the indicator is above the level — uptrend, if below the negative value of that level — downtrend.
Parameters:
- int fast_ma_period — fast period;
- int ow_ma_period — slow period;
- ENUM_MA_METHOD ma_method — smoothing type;
- ENUM_APPLIED_VOLUME applied_volume — used volume;
- double level — level.
iDEMA (Double Exponential Moving Average)
The indicator is a moving average and is applied similar to the previously discussed AMA.
Variant 1. Line slope.
Parameters:
- int ma_period — averaging period;
- ENUM_APPLIED_PRICE applied_price — price type;
- int ma_shift — horizontal shift of the indicator;
- int shift2 — shift of the point relative to which the slope is checked.
Variant 2. Two lines: fast and slow.
Parameters:
- int ma_period1 — averaging period;
- ENUM_APPLIED_PRICE applied_price1 — price type;
- int ma_shift1 — horizontal shift of the indicator;
- int ma_period2 — averaging period;
- ENUM_APPLIED_PRICE applied_price2 — price type;
- int ma_shift2 — horizontal shift of the indicator.
Note: Variables with the number 1 at the end are used for the fast line, with 2 are used for the slow one.
The indicator is an oscillator in a sub-window ranging between 0 and 1. The indicator's neutral level is 0.5. The indicator line is very uneven, so it doesn't suit for the slope variant.
Variant 1. Position relative to a level. A sell level will be set using the parameters, and the buy level will be calculated symmetrically relative to the level of 0.5.
Parameters:
- int ma_period — averaging period;
- double level — sell level.
The indicator is a channel similar to Bollinger Bands, but its application is easier.
Variant 1. If the price is above the upper border of the channel, buying is allowed. If it is below the lower channel, selling is allowed.
Parameters:
- int ma_period — central line calculation period;
- int ma_shift — horizontal shift of the indicator;
- ENUM_MA_METHOD ma_method — smoothing type;
- ENUM_APPLIED_PRICE applied_price — price type;
- double deviation — deviation of channel borders from the central line.
The indicator is an oscillator in a sub-window ranging around the 0 level. The indicator application is similar to CCI.
Variant 1. Position relative to a level.
Parameter:
- int ma_period — averaging period;
- ENUM_MA_METHOD ma_method — smoothing type;
- ENUM_APPLIED_VOLUME applied_volume — type of volume used for calculations;
- double level — level.
The indicator has no parameters.
Variant 1. Defining based on the last fractal type. If the last fractal is above, selling is allowed. If it is below — buying is allowed.
iFrAMA (Fractal Adaptive Moving Average)
The indicator is a moving average. It is applied similar to AMA.
Variant 1. Line slope.
Parameters:
- int ma_period — averaging period;
- int ma_shift — horizontal shift of the indicator;
- ENUM_APPLIED_PRICE applied_price — price type;
- int shift2 — shift of the point relative to which the slope is checked.
Variant 2. Two lines: fast and slow.
Parameters:
- int ma_period1 — averaging period;
- int ma_shift1 — horizontal shift of the indicator;
- ENUM_APPLIED_PRICE applied_price1 — price type;
- int ma_period2 — averaging period;
- int ma_shift2 — horizontal shift of the indicator;
- ENUM_APPLIED_PRICE applied_price2 — price type.
Note: Variables with the number 1 at the end are used for the fast line, with 2 are used for the slow one.
The indicator is calculated based on the Alligator indicator. The information provided by the indicator can be obtained from Alligator, that is why we will not use it.
iIchimoku (Ichimoku Kinko Hyo)
The following pair of indicator lines may be of interest: Tenkan — Kijun and the cloud. In the cloud, we can define two lines with changing positions (the line on top changes). There are two indicator use variants.
Variant 1. The position of the Tenkan and Kijun lines. If the Tenkan line (red) is above Kijun (blue), there is an uptrend. If Tenkan is below Kijun — there is a downtrend.
Parameters:
- int tenkan_sen — Tenkan-sen line period;
- int kijun_sen — Kijun-sen line period;
- int senkou_span_b — Senkou Span B period.
Variant 2. Based on the cloud direction. The cloud if defined by two lines: SpanA and SpanB. If SpanA is above SpanB — uptrend, of the opposite — downtrend.
Parameters:
- int tenkan_sen — Tenkan-sen line period;
- int kijun_sen — Kijun-sen line period;
- int senkou_span_b — Senkou Span B period.
We will not use this indicator due to its highly specific nature.
The indicator is an oscillator in a sub-window. The indicator line is very uneven, it does not suit for determining trend based on the slope. A version with a level will be used.
Variant 1. Level. Neutral level: 100. In addition to standard indicator parameters, we need a sell level. The buy level will be calculated symmetrically relative to the level of 100.
Parameters:
- int mom_period — averaging period;
- ENUM_APPLIED_PRICE applied_price — price type or handle;
- double level — sell level.
The indicator is an oscillator in a sub-window ranging between 0 and 100. Neutral level: 50. The indicator line is very uneven, it does not suit for determining trend based on line direction.
Variant 1. By level. In addition to standard parameters, we need a parameter to determine the sell level. The buy level will be calculated symmetrically relative to the level of 50. If the indicator line is above the buy level — uptrend, if below the sell value — downtrend.
Parameters:
- int ma_period — averaging period;
- ENUM_APPLIED_VOLUME applied_volume — type of volume used for calculations;
- double level — sell level.
This is a simple moving average.
Variant 1. Line slope.
Parameters:
- int ma_period — averaging period;
- int ma_shift — horizontal shift of the indicator;
- ENUM_MA_METHOD ma_method — smoothing type;
- ENUM_APPLIED_PRICE applied_price — price type;
- int shift2 — shift of the point relative to which the slope is checked.
Variant 2. Two lines: fast and slow.
Parameters:
- int ma_period1 — averaging period;
- int ma_shift1 — horizontal shift of the indicator;
- ENUM_MA_METHOD ma_method1 — smoothing type;
- ENUM_APPLIED_PRICE applied_price1 — price type;
- int ma_period2 — averaging period;
- int ma_shift2 — horizontal shift of the indicator;
- ENUM_MA_METHOD ma_method2 — smoothing type;
- ENUM_APPLIED_PRICE applied_price2 — price type.
Note: Variables with the number 1 at the end are used for the fast line, with 2 are used for the slow one.
iOsMA (Moving Average of Oscillator (MACD histogram)
The OsMA oscillator is a histogram in a sub-window. Two variants are possible: based on level and direction.
Variant 1. By level. If the histogram is above the level, buying is allowed, if below the negative value of the same level — selling is allowed.
Parameters:
- int fast_ema_period — fast Moving Average period;
- int slow_ema_period — slow Moving Average period;
- int signal_period — difference averaging period;
- ENUM_APPLIED_PRICE applied_price — price type or handle;
- double level — level.
Variant 2. Based on direction. If the histogram is directed upwards, buying is allowed; if downwards — selling is allowed. We need an additional parameter determining the shift of the second point relative to which the direction is defined.
Parameters:
- int fast_ema_period — fast Moving Average period;
- int slow_ema_period — slow Moving Average period;
- int signal_period — difference averaging period;
- ENUM_APPLIED_PRICE applied_price — price type or handle;
- int shift2 — the shift of the second point for determining the direction.
iMACD (Moving Averages Convergence-Divergence)
The MACD histogram draws a histogram and a signal line in a sub-window. There are three ways to use the indicator: based on the histogram level, its direction and its position relative to the signal line. However, the latter is a special case of OsMA checking by level (when its level is set to 0), and therefore will not be used.
Variant 1. By level. If the histogram is above the level, buying is allowed, if below the negative value of the same level — selling is allowed.
Parameters:
- int fast_ema_period — fast Moving Average period;
- int slow_ema_period — slow Moving Average period;
- int signal_period — difference averaging period;
- ENUM_APPLIED_PRICE applied_price — price type or handle;
- double level — level.
Variant 2. Based on direction. If the histogram is directed upwards — buying; if downwards — selling. We need an additional parameter determining the shift of the second point relative to which the direction is defined.
Parameters:
- int fast_ema_period — fast Moving Average period;
- int slow_ema_period — slow Moving Average period;
- int signal_period — difference averaging period;
- ENUM_APPLIED_PRICE applied_price — price type or handle;
- int shift2 — the shift of the second point for determining the direction.
Similar to AD, this indicator does not have a specific range of values and is very choppy. Will not be used.
iSAR (Parabolic Stop And Reverse System)
The indicator is displayed on the price chart, it draws one line of dots. Depending on the price movement direction, the line can be positioned above and below.
Variant 1. Position relative to the price. Price above the indicator line — uptrend, price below the indicator line — downtrend.
Parameters:
- double step — price change step — acceleration factor;
- double maximum — maximum step.
iRSI (Relative Strength Index)
An oscillator in a sub-window. One application variant similar to MFI.
Variant 1. By level.
Parameters:
- int ma_period — averaging period;
- ENUM_APPLIED_PRICE price — price type;
- double level — sell level.
An oscillator in a sub-window with a signal line. The value varies around zero.
Variant 1. By level. Above the level — buying, below the negative value of the level — selling.
Parameters:
- int ma_period — averaging period;
- double level — level.
Variant 2. The main and the signal line.
Parameters:
- int ma_period — averaging period.
The indicator does not depend on the direction. Similar to ATR.
Variant 1. By level.
Parameters:
- int ma_period — averaging period;
- int ma_shift — horizontal shift of the indicator;
- ENUM_MA_METHOD ma_method — smoothing type;
- ENUM_APPLIED_PRICE applied_price — price type;
- double level — level.
iStochastic (Stochastic Oscillator)
An oscillator in a sub-window with a main and a signal line.
Variant 1. The slope of the main line.
Parameters:
- int Kperiod — K-period;
- int Dperiod — D-period;
- int slowing — final smoothing;
- ENUM_MA_METHOD ma_method — smoothing type;
- ENUM_STO_PRICE price_field — price;
- int shift2 — the shift of the second point for determining the slope.
Variant 2. By level. The indicator values vary from 0 to 100, the neutral level is 50. An additional parameter is needed for the sell level; the buy level will be calculated.
Parameters:
- int Kperiod — K-period;
- int Dperiod — D-period;
- int slowing — final smoothing;
- ENUM_MA_METHOD ma_method — smoothing type;
- ENUM_STO_PRICE price_field — price;
- double level — level.
Variant 3. The position of the main and signal lines.
Parameters:
- int Kperiod — K-period;
- int Dperiod — D-period;
- int slowing — final smoothing;
- ENUM_MA_METHOD ma_method — smoothing type;
- ENUM_STO_PRICE price_field — price.
iTEMA (Triple Exponential Moving Average)
Another moving average.
Variant 1. Line slope.
Parameters:
- int ma_period — averaging period;
- int ma_shift — horizontal shift of the indicator;
- ENUM_APPLIED_PRICE applied_price — price type;
- int shift2 — shift of the point relative to which the slope is checked.
Variant 2. Two lines: fast and slow.
Parameters:
- int ma_period1 — averaging period;
- int ma_shift1 — horizontal shift of the indicator;
- ENUM_APPLIED_PRICE applied_price1 — price type;
- int ma_period2 — averaging period;
- int ma_shift2 — horizontal shift of the indicator;
- ENUM_APPLIED_PRICE applied_price2 — price type.
Note. Variables with the number 1 at the end are used for the fast line, with 2 are used for the slow one.
iTriX (Triple Exponential Moving Averages Oscillator)
An oscillator in a sub-window. One variant — line slope. For a change, we will try a second variant with two lines: fast and slow
Variant 1. Line slope.
Parameters:
- int ma_period — averaging period;
- int ma_shift — horizontal shift of the indicator;
- ENUM_APPLIED_PRICE applied_price — price type;
- int shift2 — shift of the point relative to which the slope is checked.
Note: The iTriX function does not have the ma_shift parameter, but the indicator can still be shifted. In any case, shifting will not be performed though the shift parameter (it will be set to 0 for all indicators), but by calculating the bar index.
Variant 2. Two lines: fast and slow.
Parameters:
- int ma_period1 — averaging period;
- int ma_shift1 — horizontal shift of the indicator;
- ENUM_APPLIED_PRICE applied_price1 — price type;
- int ma_period2 — averaging period;
- int ma_shift2 — horizontal shift of the indicator;
- ENUM_APPLIED_PRICE applied_price2 — price type.
Note. Variables with the number 1 at the end are used for the fast line, with 2 are used for the slow one.
iWPR (Williams' Percent Range)
The indicator is identical to the main stochastic line with the slowing set to 1, but with an inverted scale. It will not be used.
iVIDyA (Variable Index Dynamic Average)
Another moving average.
Variant 1. Line slope.
Variant 2. Two lines: fast and slow.Parameters:
- int cmo_period — CMO period
- ema_period — smoothing period
- ma_shift — horizontal shift of the indicator
- ENUM_APPLIED_PRICE applied_price — price type
- int shift2 — shift of the point relative to which the slope is checked.
Parameters:
- int ma_period1 — averaging period;
- int ma_shift1 — horizontal shift of the indicator;
- ENUM_APPLIED_PRICE applied_price1 — price type;
- int ma_period2 — averaging period;
- int ma_shift2 — horizontal shift of the indicator;
- ENUM_APPLIED_PRICE applied_price2 — price type.
Note: Variables with the number 1 at the end are used for the fast line, with 2 are used for the slow one.
The indicator values do not depend on the price direction. The indicator can be used similar to ATR or STD.
Variant 1. Level. If the indicator values are above the level, buying and selling is allowed.
Parameters:
- ENUM_APPLIED_VOLUME applied_volume — type of volume;
- double level — level.
We have defined the indicators and their application variants. Now let us write an enumeration of all types. In the Includes folder, we create the UniTrend folder, and create the UniTrendDefines.mqh file with an enumeration in it:
enum EType{
   Type_ADX_PDIMDI,          // position of PDI and MDI lines of the ADX indicator
   Type_ADX_Level,           // position of ADX lines relative to the level
   Type_ADXW_PDIMDI,         // position of PDI and MDI lines of the ADX Wilder indicator
   Type_ADXW_Level,          // position of ADX lines relative to the level for ADX Wilder
   Type_Alligator,           // Alligator
   Type_AMA_Dir,             // direction of АМА
   Type_AMA_2MA,             // two АМАs
   Type_ATR_Level,           // ATR
   Type_BuBe_Level,          // Bulls/Bears Power and a level
   Type_BuBe_Dir,            // direction of Bulls/Bears Power
   Type_Bands,               // Bollinger Bands
   Type_CCI_Level,           // CCI and a level
   Type_Chaikin_Level,       // Chaikin oscillator and a level
   Type_DEMA_Dir,            // direction of DEMA
   Type_DEMA_2MA,            // two DEMAs
   Type_DeMarker_Level,      // DeMarker and a level
   Type_Envelopes,           // Envelope
   Type_Force_Level,         // Force oscillator and a level
   Type_Fractals,            // fractals
   Type_FrAMA_Dir,           // direction of FrAMA
   Type_FrAMA_2MA,           // two FrAMAs
   Type_Ichimoku_TK,         // Ichimoku: Tenkan and Kijun
   Type_Ichimoku_SASB,       // Ichimoku: cloud
   Type_Momentum_Level,      // Momentum and a level
   Type_MFI_Level,           // MFI and a level
   Type_MA_Dir,              // direction of MA
   Type_MA_2MA,              // two MAs
   Type_OsMA_Dir,            // direction of OsMA
   Type_OsMA_Level,          // OsMA and a level
   Type_MACD_Dir,            // direction of MACD
   Type_MACD_Level,          // MACD and a level
   Type_SAR,                 // SAR
   Type_RSI_Level,           // RSI and a level
   Type_RVI_Level,           // RVI and a level
   Type_RVI_MS,              // the main and signal lines of RVI
   Type_STD_Level,           // standard deviation and a level
   Type_Sto_Dir,             // direction of stochastic
   Type_Sto_Level,           // stochastic and a level
   Type_Sto_MS,              // the main and signal lines of stochastic
   Type_TEMA_Dir,            // direction of TEMA
   Type_TEMA_2MA,            // two TEMAs
   Type_TriX_Dir,            // direction of TriX
   Type_TriX_2MA,            // two TriXs
   Type_VIDyA_Dir,           // direction of VIDyA
   Type_VIDyA_2MA,           // two VIDyAs
   Type_Volumes              // volume
            };
External Parameters
By analyzing the above indicator descriptions, we can determine the required set of external parameters. All required parameters and their types are given in Table 1. We will basically use variables with the prefix "f_" (which means fast). For variants with the fast and slow moving averages, we will use the second group of parameters with the prefix "s_" (which means slow).
Table 1. External parameters and their types
| Type | Name |
|---|---|
| int | f_period1 |
| int | f_shift1 |
| int | f_period2 |
| int | f_shift2 |
| int | f_period3 |
| int | f_shift3 |
| ENUM_MA_METHOD | f_method |
| ENUM_APPLIED_PRICE | f_price |
| ENUM_APPLIED_VOLUME | f_volume |
| ENUM_STO_PRICE | f_sto_price |
| double | f_level |
| int | f_dot2shift |
| double | f_step |
| double | f_maximum |
| int | s_period1 |
| int | s_shift1 |
| int | s_period2 |
| int | s_shift2 |
| int | s_period3 |
| int |
s_shift3 |
| ENUM_MA_METHOD | s_method |
| ENUM_APPLIED_PRICE | s_price |
| int | mult |
| int | level_digits |
| int | sar_step_digits |
| int | sar_maximum_digits |
In addition to the parameters specified in indicator descriptions, a few additional parameters are available at the bottom of the table:
- mult — multiplier of parameters measured in points depending on the number of digits in quotes. The values of some indicators, such as MACD and OsMA, are connected with the price, so it is more convenient to set them in points. Parameter values need to be corrected depending on the number of digits in quotes.
- level_digits — the number of decimal places in the level parameter. In the graphical interface, the level value is set using the CSpinBox control (input field with the "+" and "-" buttons), so it would be convenient to set different minimum changes for different indicators (the amount by which the value changes when "+" or "-" is pressed).
- sar_step_digits — the number of decimal places for the step parameter of the SAR indicator.
- sar_maximum_digits — the number of decimal places for the maximum parameter of the SAR indicator.
#define ADX_LEVEL_DIGITS         0 // for the ADX indicator
#define ADXW_LEVEL_DIGITS        0 // for the ADX Wilder indicator
#define ATR_LEVEL_DIGITS         1 // for the ATR indicator
#define BUBE_LEVELS_DIGITS       1 // for the Bulls/Bears Power indicators
#define CCI_LEVEL_DIGITS         0 // for the CCI indicator
#define CHAIKIN_LEVEL_DIGITS     0 // for the Chaikin oscillator
#define DEMARKER_LEVEL_DIGITS    2 // for the Demarker indicator
#define FORCE_LEVEL_DIGITS       3 // for the Force indicator
#define MOMENTUM_LEVEL_DIGITS    2 // for the Momentum indicator
#define MFI_LEVEL_DIGITS         0 // for the MFI indicator
#define OSMA_LEVBEL_DIGITS       2 // for the OsMA indicator
#define MACD_LEVEL_DIGITS        2 // for the MACD indicator
#define RSI_LEVEL_DIGITS         0 // for the RSI indicator
#define RVI_LEVEL_DIGITS         2 // for the RVI indicator
#define STD_LEVEL_DIGITS         1 // for the STD indicator
#define STO_LEVEL_DIGITS         0 // for the Stochastic indicator
#define BANDS_LEVEL_DIGITS       1 // for Bollinger Bands
#define ENVELOPES_LEVEL_DIGITS   2 // for the Envelopes indicator
#define SAR_STEP_DIGITS          3 // for the SAR indicator (the step parameter)
      #define SAR_MAXIMUM_DIGITS       2 // for the SAR indicator (the maximum parameter)
Let us create the following structure based on the Table 1:
struct SExtParams{
   int                 f_period1;
   int                 f_shift1;
   int                 f_period2;
   int                 f_shift2;
   int                 f_period3;
   int                 f_shift3;
   long                f_method;
   long                f_price;
   long                f_volume;
   long                f_sto_price;
   double              f_level;
   int                 f_dot2shift;
   double              f_step;
   double              f_maximum;
   int                 s_period1;
   int                 s_shift1;
   int                 s_period2;
   int                 s_shift2;
   int                 s_period3;
   int                 s_shift3;
   long                s_method;
   long                s_price;
   int                 mult;
   int                 level_digits;
   int                 sar_step_digits;
   int                 sar_maximum_digits;
            };
Combining parameters into a structure allows us to separate them from the rest of the code. It will be very convenient if we need to revise the indicator by adding new trend detection types, in case the available options are not enough. Also, this greatly simplifies the transfer of parameters to functions and class methods.
Since the indicator generated in the article will show the trend as a row of characters (this is the same for all indicators), we can easily add to the indicator a function notifying about the beginning of the trend. Someone may be interested in being notified of a completely formed trend (indications on a completed bar), and someone wants to catch the first moment of new trend emergence (on the emerging bar). Therefore, we will write enumerations for selecting the type of notification:
enum EAlerts{
   Alerts_off=0, // notification disabled
   Alerts_Bar0=1, // notification on the emerging bar
   Alerts_Bar1=2 // notification on a completed bar
            };
Creating an Indicator
Creation of classes for universal indicators is considered in detail in articles "Universal oscillator with a graphical interface" and "Universal channel with the graphical interface". Let's consider the specific features of their creation in relation to this article.
All of the above methods for determining the trend are divided into two categories: one or two indicators. In one group, after loading the indicator we need to check one handle, and in the second one we check two of them. This means that the base class will have two child classes with different ways to check the handles. In turn, these child classes will have their own child classes, in which trend will be determined.
The base class:
class CUniTrend{
   protected:

      int m_handle1;
      int m_handle2;

      string m_name;
      string m_help;

      int m_ci;

      double m_b1[1];
      double m_b2[1];
      double m_b3[1];
      double m_b4[1];

      int m_shift;
      int m_shift1;
      int m_shift2;
      int m_shift3;

      int m_dot2shift;

      double m_level;

   public:

      void CUniTrend(){
         m_handle1=INVALID_HANDLE;
         m_handle2=INVALID_HANDLE;
      }

      void ~CUniTrend(){
         if(m_handle1!=INVALID_HANDLE){
            IndicatorRelease(m_handle1);
         }
         if(m_handle2!=INVALID_HANDLE){
            IndicatorRelease(m_handle2);
         }
      }

      virtual int Calculate( const int rates_total,
                     const int prev_calculated,
                     double & upBuffer[],
                     double & dnBuffer[]
      ){
         return(rates_total);
      }

      virtual bool Calculated(){
         return(false);
      }

      virtual bool CheckHandles(){
         return(true);
      }

      string Name(){
         return(m_name);
      }
      string Help(){
         return(m_help);
      }
            };
The protected section contains declarations of various auxiliary variables, which will be useful in child classes. Variables for indicator handles are initialized in the constructor, the handles are released in the destructor. The remaining methods are virtual.
A child class for a variant with one indicator:
class CUniTrend1:public CUniTrend{
   public:
      bool Calculated(){
         if(BarsCalculated(m_handle1)>0){
            return(true);
         }
         else{
            return(false);
         }
      }

      bool CheckHandles(){
         return(m_handle1!=INVALID_HANDLE);
      }
            };
The class has two real methods: CheckHandle() — it allows to check whether the indicator could be loaded, and Calculated() — allows to find out if the indicator is fully calculated and if the contents of buffers displaying the trend can be updated.
A child class for a variant with two indicators:
class CUniTrend2:public CUniTrend{
   public:
      bool Calculated(){
         if(BarsCalculated(m_handle1)>0 && BarsCalculated(m_handle2)>0){
            return(true);
         }
         else{
            return(false);
         }
      }

      bool CheckHandles(){
         return(m_handle1!=INVALID_HANDLE && m_handle2!=INVALID_HANDLE);
      }
            };
All classes with different variants of trend identification will be child classes of CUniTrend1 or CUniTrend2. Consider the following child class:
class CUniTrend_ADX_PDIMDI:public CUniTrend1{
   private:
   public:

      void CUniTrend_ADX_PDIMDI( bool use_default,
                                 bool keep_previous,
                                 SExtParams & par){

         // setting default parameters

         if(use_default){
            if(keep_previous){
               if(par.f_period1==PARAMETER_EMPTY)par.f_period1=14;
            }
            else{
               par.f_period1=14;
            }
         }
         // loading the indicator
         m_handle1=iADX(Symbol(),Period(),par.f_period1);
         // forming the name of the indicator and a hint for parameters
         m_name=StringFormat( "iADX_PDIMDI(%i)",
                              par.f_period1
                            );

         m_help=StringFormat( "adx_period - f_period1(%i)",
                              par.f_period1
                            );
      }

      int Calculate( const int rates_total,
                     const int prev_calculated,
                     double & upBuffer[],
                     double & dnBuffer[]
      ){
         int start;

         if(prev_calculated==0){
            start=1;
         }
         else{
            start=prev_calculated-1;
         }

         for(int i=start;i<rates_total;i++){

            upBuffer[i]=EMPTY_VALUE;
            dnBuffer[i]=EMPTY_VALUE;

            m_ci=rates_total-i-1;

            if(CopyBuffer(m_handle1,PLUSDI_LINE,m_ci,1,m_b1)==-1){
               return(0);
            }

            if(CopyBuffer(m_handle1,MINUSDI_LINE,m_ci,1,m_b2)==-1){
               return(0);
            }

            if(m_b1[0]>m_b2[0]){
               upBuffer[i]=1;
            }
            else if(m_b1[0]<m_b2[0]){
               dnBuffer[i]=-1;
            }

         }

         return(rates_total);
      }
            };
The main important points in the class constructor are commented, and the Calculate() method is an analog of the standard OnCalculate() function of the indicator. The code of this function is created similar to the indicator code.
In the article attachments, all indicator classes are located in the file Include/UniTrend/UniTrendIndicators.mqh.
Now that we have prepared all classes, we can create a simple indicator for determining the trend, just as we did in the articles about the universal oscillator and the universal channel. A ready indicator without a graphical interface is available in the attachment, in the Indicators/iUniTrend.mq5 file.
Creating a Graphical Interface
All classes of the graphical interface are located in files UniTrendForm.mqh and UniTrendControl.mqh. The form class is available in the UniTrendForm.mqh file, and the UniTrendControl.mqh file contains classes of the universal control for entering the indicator parameters. No need to discuss the creation of a form class in detail, because it has already been considered in articles about the universal oscillator and the universal channel. It is also considered in detail in the article "Custom Graphical Controls. Part 3. Forms". Let us consider creating a universal control.
The basis of the universal control is the CUniTrendControl base class. The public section of the class only contains virtual methods, the protected section contains some auxiliary methods for working with drop-down lists: methods for filling the lists with variants and methods for setting selected items in the list. Here is the base class code with comments:
class CUniTrendControl{
   protected:

      /* Function for calculating the minimal value change
         by the number of decimal places for the level parameter
      */
      double SolveChange(int d){
         return(NormalizeDouble(1.0/pow(10,d),d));
      }

      // filling the list with ENUM_MA_METHOD variants
      void AddVariantsMethod(CComBox & cb){
         for(int i=0;i<ArraySize(e_method);i++){
            cb.AddItem(EnumToString((ENUM_MA_METHOD)e_method[i]));
         }
      }

      // filling the list with ENUM_APPLIED_PRICE variants
      void AddVariantsPrice(CComBox & cb){
         for(int i=0;i<ArraySize(e_price);i++){
            cb.AddItem(EnumToString((ENUM_APPLIED_PRICE)e_price[i]));
         }
      }

      // filling the list with ENUM_APPLIED_VOLUME variants
      void AddVariantsVolume(CComBox & cb){
         for(int i=0;i<ArraySize(e_volume);i++){
            cb.AddItem(EnumToString((ENUM_APPLIED_VOLUME)e_volume[i]));
         }
      }

      // filling the list with ENUM_STO_PRICE variants
      void AddVariantsStoPrice(CComBox & cb){
         for(int i=0;i<ArraySize(e_sto_price);i++){
            cb.AddItem(EnumToString((ENUM_STO_PRICE)e_sto_price[i]));
         }
      }

      // getting the value index for ENUM_MA_METHOD
      int MethodIndex(long val){
         for(int i=ArraySize(e_method)-1;i>=0;i--){
            if(e_method[i]==val){
               return(i);
            }
         }
         return(-1);
      }

      // getting the value index for ENUM_APPLIED_PRICE
      int PriceIndex(long val){
         for(int i=ArraySize(e_price)-1;i>=0;i--){
            if(e_price[i]==val){
               return(i);
            }
         }
         return(-1);
      }

      // getting the value index for ENUM_APPLIED_VOLUME
      int VolumeIndex(long val){
         for(int i=ArraySize(e_volume)-1;i>=0;i--){
            if(e_volume[i]==val){
               return(i);
            }
         }
         return(-1);
      }

      // getting the value index for ENUM_STO_PRICE
      int StoPriceIndex(long val){
         for(int i=ArraySize(e_sto_price)-1;i>=0;i--){
            if(e_sto_price[i]==val){
               return(i);
            }
         }
         return(-1);
      }

   public:

      // Initialization of controls
      virtual void Init(SExtParams & par){}

      // setting values
      virtual void SetValues(SExtParams & par){}

      // getting values
      virtual void GetValues(SExtParams & par){}

      // displaying controls
      virtual void Show(int x,int y){}

      // hiding controls
      virtual void Hide(){}

      // number of controls for calculating the form height
      virtual int ControlsCount(){
         return(0);
      }

      // handling events
      virtual int Event(int id,long lparam,double dparam,string sparam){
         return(0);
      }

};
Let us consider a child class for trend detection based on ADX and the level (two controls):
class CUniTrendControl_ADX_Level: public CUniTrendControl{
   private:

      // pointers to simple controls
      CSpinInputBox m_f_period1;
      CSpinInputBox m_f_level;

   public:

      // Initialization of controls
      void Init(SExtParams & par){
         m_f_period1.Init("f_period1",SPIN_BOX_WIDTH,1," adx_period");
         m_f_period1.SetMinValue(1);
         m_f_period1.SetReadOnly(false);
         m_f_level.Init("f_level",COMBO_BOX_WIDTH,this.SolveChange(par.level_digits)," level");
         m_f_level.SetMinValue(0);
         m_f_level.SetReadOnly(false);
      }

      // setting values
      void SetValues(SExtParams & par){
         m_f_period1.SetValue(par.f_period1);
         m_f_level.SetValue(par.f_level);
      }

      // getting values
      void GetValues(SExtParams & par){
         par.f_period1=(int)m_f_period1.Value();
         par.f_level=m_f_level.Value();
      }

      // displaying controls
      void Show(int x,int y){
         m_f_period1.Show(x,y);
         y+=20;
         m_f_level.Show(x,y);
      }

      // hiding controls
      void Hide(){
         m_f_period1.Hide();
         m_f_level.Hide();
      }

      // number of controls for calculating the form height
      int ControlsCount(){
         return(2);
      }

      // executing the control events
      int Event(int id,long lparam,double dparam,string sparam){
         int e1=m_f_period1.Event(id,lparam,dparam,sparam);
         int e2=m_f_level.Event(id,lparam,dparam,sparam);
         if(e1!=0 || e2!=0){
            return(1);
         }
         return(0);
      }
};
A variable of type SExtParam is passed to methods SetValues() and GetValues(), only required fields of the structure are used in each child class. We need to set the minimum change value for the level control; this can be done during the control initialization, therefore a structure with parameters is also passed to the Init() method. In general, the creation of child classes corresponds to all the principles of controls creation described in the article "Custom Graphical Controls. Part 1: Creating a Simple Control", expect that here only the necessary methods are created, not all of them.
Combining the GUI with the indicator
This stage of indicator creation is much similar to the corresponding stage of universal trend indicator creation and universal channel creation. Let's consider the differences.
Earlier, when the indicator was operating with default values (UseDefault=true), all parameters were initialized with -1. Now this option is not suitable, because the level parameter for some indicators can be negative. Therefore, initialization of variables is performed by the value of the PARAMETER_EMPTY constant declared in the UniTrendDefines.mqh file. The constant has the value of INT_MAX (a value that greatly exceeds the limits of real values of levels).
Another small difference is the OnTimer() function. The Calculated() method is called to check if the indicator is calculated, because for some variants of the trend we need to check one indicator, and for others we check two indicators. This can only be known inside the indicator class.
As a result, we get another universal and very convenient indicator (Fig. 10).

Fig. 10. A universal trend indicator with the graphical interface
Note: in addition to displaying the name of the selected variant in the list on the form, the type of indicator used is also displayed in the indicator sub-window in the upper left corner. In addition to the type, the values of all parameters (in brackets) are displayed. If the level value is specified in points, an expression for calculating the real level value is written (Fig. 11).
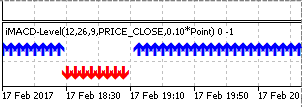
Fig. 11. Displaying the parameter specified in points
The ready indicator is available in the below attachment, the file name is Indicators/iUniTrendGUI.mq5.
Conclusion
In total, the indicator includes 46 different options for determining the trend. The graphical interface, which allows you to quickly change the parameters of indicators and their types, allows to conveniently analyze the history. The presence of the notification function makes the indicator useful for real practical applications.
A new approach to creating a graphical interface has both advantages and disadvantages. Its disadvantages include the large amount of code and therefore a large amount of work. Unlike the classes managing the visibility of controls (as in the universal oscillator and the universal channel), here a practically complete control element was created for almost every variant of trend detection. However, a clearer separation and independence of code of the compound control from the form code greatly simplified its development, and it also simplifies further expansion of the indicator, should this be necessary.
Attachments
Attached to the article is the downloadable archive with the required files. The files are placed in right folders. They should be saved to the same folders of the terminal.