Patterns available when trading currency baskets. Part II
Andrei Novichkov | 19 April, 2017
Introduction
In our previous article about the patterns emerging when trading currency baskets, we focused our attention on the combined indicators based on oscillators. The combined Williams’ Percent Range indicator was used as an example. As a result, we obtained a number of patterns, analyzed their pros and cons and made conclusions about the applicability of each of them in real trading.
However, this is not enough. The combined indicators based on oscillators cannot cover the needs of all traders who want to apply technical analysis to evaluate the currency basket. The trader's toolkit can be reinforced with combined trend-following indicators having their own patterns. Only after studying them, we are able to consider our set of technical tools to be complete.
Let's develop a test indicator to solve the issue. We have already performed this task, therefore we can use the code from the previous article with minimal changes. But first, we should consider some specific features of combined trend-following indicators. We will use the terminology that is already familiar to readers of the previous articles.
Features of the combined trend-following indicators
Combined trend-following indicators cannot be based on any parent trend-following indicator due to certain limitations.
Limitation #1. Combined indicators should be placed in a separate window. There is no point in displaying this indicator in the price chart window. Since the averaging principle is used for constructing combined indicators, it is not clear what they display in that case. Besides, the applied measurement units are different from the ones used on the chart. Thus, neither moving averages, nor Bollinger bands, nor other chart indicators cannot be used as a parent indicator.
Limitation #2. The combined indicator shows the status of only one currency; therefore, you need two combined indicators to display a current pair status. Since each of them is located in a separate window, we need two additional windows. The reason for such separation is a difference in scale. The combined indicators based on oscillators always change within pre-defined limits. However, this is not the case with trend-following ones. Neither maximum, nor minimum value are known in advance. This means that the previously described approach involving the moving average applied to the readings of the two combined indicators is pointless. Such collaborative calculations are not suitable when combining trend-following indicators.
Limitations of the parent indicator list prevent from using combined trend-following indicators to the fullest extent. For example, according to the preliminary examination, only ADX and StdDev are suitable for us out of the entire list of trend-following indicators in the MetaTrader 5 menu.
But that is not a reason to abandon the task. We will use the provided tools and start with the combined indicator that we know already — basket currency index.
Basket currency index with the moving average
Let's develop the testIndexMA.mq5 test indicator similar to the one described here and add the moving average to it:
//| testDistance.mq5 |
//| 2016 MetaQuotes Software Corp. |
//| http://www.mql5.com |
//+------------------------------------------------------------------+
#property copyright "Copyright 2016, MetaQuotes Software Corp."
#property link "http://www.mql5.com"
#property version "1.00"
#property indicator_separate_window
#property indicator_buffers 2
#property indicator_plots 2
input color clr= clrGreen;
input color clrMA = clrMagenta;
input int maperiod = 10; //Period MA
double ind[],ma[];
//+------------------------------------------------------------------+
//| Custom indicator initialization function |
//+------------------------------------------------------------------+
//int h,h1;
int OnInit()
{
//--- indicator buffers mapping
ArraySetAsSeries(ind,true);
SetIndexBuffer(0,ind);
IndicatorSetString(INDICATOR_SHORTNAME,"testdistance");
IndicatorSetInteger(INDICATOR_DIGITS,2);
PlotIndexSetInteger(0,PLOT_DRAW_TYPE,DRAW_LINE);
PlotIndexSetInteger(0,PLOT_LINE_STYLE,STYLE_SOLID);
PlotIndexSetInteger(0,PLOT_LINE_WIDTH,2);
PlotIndexSetInteger(0,PLOT_LINE_COLOR,clr);
PlotIndexSetString(0,PLOT_LABEL,"_tstdistance_");
ArraySetAsSeries(ma,true);
SetIndexBuffer(1,ma);
PlotIndexSetInteger(1, PLOT_DRAW_TYPE, DRAW_LINE );
PlotIndexSetInteger(1, PLOT_LINE_STYLE, STYLE_SOLID );
PlotIndexSetInteger(1, PLOT_LINE_WIDTH, 1 );
PlotIndexSetInteger(1, PLOT_LINE_COLOR, clrMA );
PlotIndexSetString (1, PLOT_LABEL, "_tstdistance_MA" );
//---
return(INIT_SUCCEEDED);
}
string pair[]={"EURUSD","GBPUSD","AUDUSD","NZDUSD","USDCAD","USDCHF","USDJPY"};
bool bDirect[]={false,false,false,false,true,true,true};
int iCount=7;
double GetValue(int shift)
{
double res=1.0,t;
double dBuf[1];
for(int i=0; i<iCount; i++)
{
t=CopyClose(pair[i],PERIOD_CURRENT,shift,1,dBuf);
if(!bDirect[i]) dBuf[0]=1/dBuf[0];
res*=dBuf[0];
}//end for (int i = 0; i < iCount; i++)
return (NormalizeDouble(MathPow (res, 1/(double)iCount), _Digits) );
}
//+------------------------------------------------------------------+
//| Custom indicator iteration function |
//+------------------------------------------------------------------+
int OnCalculate(const int rates_total,
const int prev_calculated,
const datetime &time[],
const double &open[],
const double &high[],
const double &low[],
const double &close[],
const long &tick_volume[],
const long &volume[],
const int &spread[])
{
if(prev_calculated==0 || rates_total>prev_calculated+1)
{
int rt=rates_total;
for(int i=1; i<rt; i++)
{
ind[i]= GetValue(i);
}
rt -= maperiod;
for (int i = 1; i< rt; i++)
{
ma[i] = GetMA(ind, i, maperiod, _Digits);
}
}
else
{
ind[0]= GetValue(0);
ma[0] = GetMA(ind, 0, maperiod, _Digits);
}
//--- return value of prev_calculated for next call
return(rates_total);
}
void OnDeinit(const int reason)
{
string text;
switch(reason)
{
case REASON_PROGRAM:
text="Indicator terminated its operation by calling the ExpertRemove() function";break;
case REASON_INITFAILED:
text="This value means that OnInit() handler "+__FILE__+" has returned a nonzero value";break;
case REASON_CLOSE:
text="Terminal has been closed"; break;
case REASON_ACCOUNT:
text="Account was changed";break;
case REASON_CHARTCHANGE:
text="Symbol or timeframe was changed";break;
case REASON_CHARTCLOSE:
text="Chart was closed";break;
case REASON_PARAMETERS:
text="Input-parameter was changed";break;
case REASON_RECOMPILE:
text="Program "+__FILE__+" was recompiled";break;
case REASON_REMOVE:
text="Program "+__FILE__+" was removed from chart";break;
case REASON_TEMPLATE:
text="New template was applied to chart";break;
default:text="Another reason";
}
PrintFormat("%s",text);
}
//+------------------------------------------------------------------+
double GetMA(const double& arr[], int index , int period, int digit) {
double m = 0;
for (int j = 0; j < period; j++) m += arr[index + j];
m /= period;
return (NormalizeDouble(m,digit));
}
bool bDirect[]={true,true,true,true,true,true,true};
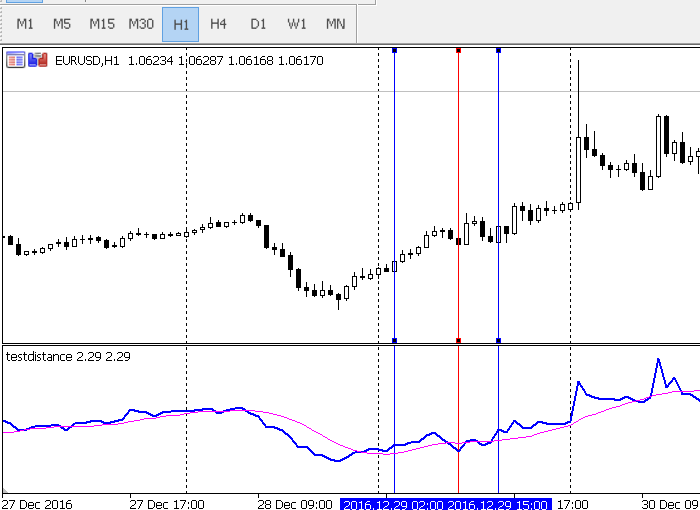
We are not interested in the absolute indicator values yet. Let's count the MA indicator crossing points with potential market entry points. As stated in the previous articles, these points should be fixed at the candle closure which is exactly what we do. Mark detected entry points with vertical lines: blue ones standing for buys and red ones — for sells. The positive result is evident. However, the profit is rather small and unstable, thus it makes sense to increase profitability. First, do not forget about the second currency of the pair and add the USD index indicator in a separate subwindow:
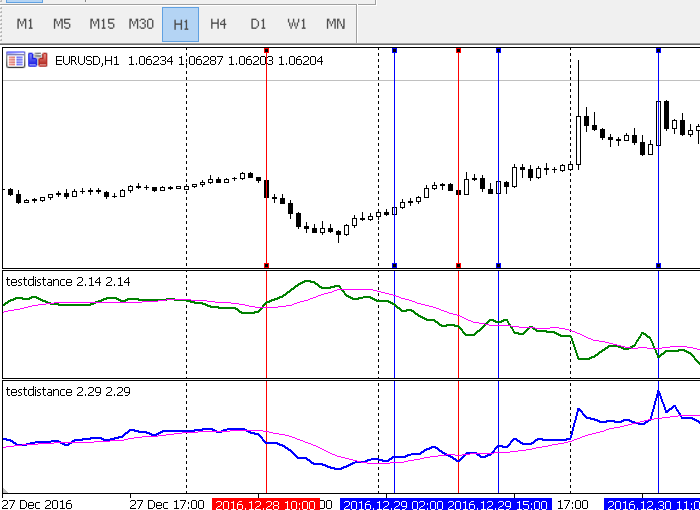
Mark МА and USD index graph crossings in vertical lines. Let's analyze the result.
- The index graph crossing MA hints at a possible trend reversal which is more probable if a similar (although reverse in nature) crossing is detected at the second pair of the currency. For example, in case of EURUSD, if the USD index graph crosses МА upwards, the EUR index should cross MA downwards. The situation signals the strengthening of one currency with simultaneous weakening of the other.
- If crossing points on the both currencies index graphs are in the same direction, do not enter the market. In this case, the probability of a flat is high.
- Crossing points should be clearly visible. We considered that in the previous article.
Thus the first practical conclusion: Consider the indices of both currencies when entering the market. It is recommended to enter the market when one of the currencies becomes weaker, while the second one gets stronger. One of the first signals of that is an index graph crossing MA. However, this signal is not sufficient: first, wait for the second currency moving in the opposite direction.
The delay issue remains open: What is the maximum possible distance between an index graph and MA crossing points for both currencies of a pair? Obviously, the minimum (and perfect) distance is zero. It is difficult to provide a clear answer using the maximum delay. Although, it is clear that a certain distance should be applied. It is dangerous to enter the market if weakening of one currency and strengthening of another is greatly separated in time. In this case, we face a divergence and a trend weakening.
Thus, we considered market entries based on a combined trend-following indicator. In order to evaluate a potential entry point more accurately, let's move on to the indicator absolute values already mentioned above.
Quick analysis using ZigZag
For our further work, let's use one of the indicators based on ZigZag from this article by my respected colleague Dmitry Fedoseev. Let's place iUniZigZagPriceSW.mq5 directly on USD index graph:
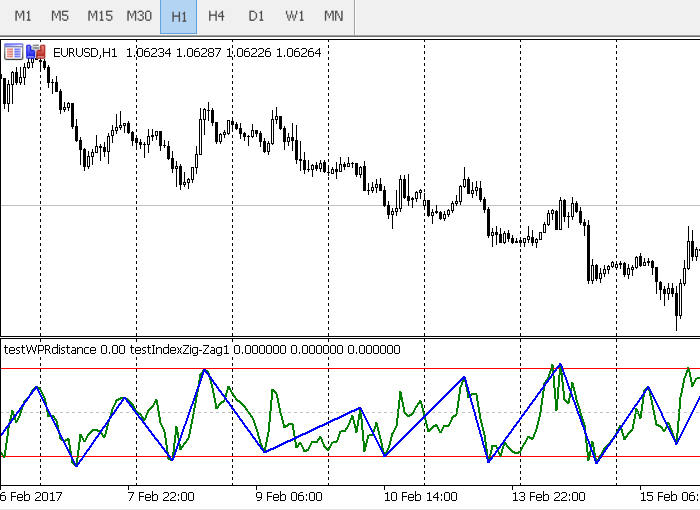
Here, ZigZag is shown as a thick blue line. Our objective is to analyze and organize ZigZag segment length. This way we may be able to get the "swing amplitude" of the USD index.
Let's modify the indicator code a bit:
//| iUniZigZagSW.mq5 |
//| Copyright 2016, MetaQuotes Software Corp. |
//| https://www.mql5.com |
//+------------------------------------------------------------------+
#property copyright "Copyright 2016, MetaQuotes Software Corp."
#property link "https://www.mql5.com"
#property version "1.00"
#property indicator_separate_window
#property indicator_buffers 6
#property indicator_plots 3
//--- plot High
#property indicator_label1 "High"
#property indicator_type1 DRAW_LINE
#property indicator_color1 clrGreen
#property indicator_style1 STYLE_SOLID
#property indicator_width1 1
//--- plot Low
#property indicator_label2 "Low"
#property indicator_type2 DRAW_LINE
#property indicator_color2 clrGreen
#property indicator_style2 STYLE_SOLID
#property indicator_width2 1
//--- plot ZigZag
#property indicator_label3 "ZigZag"
#property indicator_type3 DRAW_SECTION
#property indicator_color3 clrRed
#property indicator_style3 STYLE_SOLID
#property indicator_width3 1
//--- plot Direction
#property indicator_label4 "Direction"
#property indicator_type4 DRAW_LINE
#property indicator_style4 STYLE_SOLID
#property indicator_width4 1
//--- plot LastHighBar
#property indicator_label5 "LastHighBar"
#property indicator_type5 DRAW_LINE
#property indicator_style5 STYLE_SOLID
#property indicator_width5 1
//--- plot LastLowBar
#property indicator_label6 "LastLowBar"
#property indicator_type6 DRAW_LINE
#property indicator_style6 STYLE_SOLID
#property indicator_width6 1
#include <ZigZag\CSorceData.mqh>
#include <ZigZag\CZZDirection.mqh>
#include <ZigZag\CZZDraw.mqh>
//+------------------------------------------------------------------+
//| |
//+------------------------------------------------------------------+
enum EDirection
{
Dir_NBars=0,
Dir_CCI=1
};
//--- input parameters
input EDirection DirSelect=Dir_NBars;
input int CCIPeriod = 14;
input ENUM_APPLIED_PRICE CCIPrice = PRICE_TYPICAL;
input int ZZPeriod=14;
input string name="index-usd-zz.txt";
CZZDirection*dir;
CZZDraw*zz;
//--- indicator buffers
double HighBuffer[];
double LowBuffer[];
double ZigZagBuffer[];
double DirectionBuffer[];
double LastHighBarBuffer[];
double LastLowBarBuffer[];
//+------------------------------------------------------------------+
//| Custom indicator initialization function |
//+------------------------------------------------------------------+
int h;
//+------------------------------------------------------------------+
//| |
//+------------------------------------------------------------------+
int OnInit()
{
switch(DirSelect)
{
case Dir_NBars:
dir=new CNBars(ZZPeriod);
break;
case Dir_CCI:
dir=new CCCIDir(CCIPeriod,CCIPrice);
break;
}
if(!dir.CheckHandle())
{
Alert("Indicator 2 download error");
return(INIT_FAILED);
}
zz=new CSimpleDraw();
//--- indicator buffers mapping
SetIndexBuffer(0,HighBuffer,INDICATOR_DATA);
SetIndexBuffer(1,LowBuffer,INDICATOR_DATA);
SetIndexBuffer(2,ZigZagBuffer,INDICATOR_DATA);
SetIndexBuffer(3,DirectionBuffer,INDICATOR_CALCULATIONS);
SetIndexBuffer(4,LastHighBarBuffer,INDICATOR_CALCULATIONS);
SetIndexBuffer(5,LastLowBarBuffer,INDICATOR_CALCULATIONS);
h=FileOpen(name,FILE_CSV|FILE_WRITE|FILE_ANSI,',');
//---
return(INIT_SUCCEEDED);
}
//+------------------------------------------------------------------+
//| |
//+------------------------------------------------------------------+
void OnDeinit(const int reason)
{
if(CheckPointer(dir)==POINTER_DYNAMIC)
{
delete(dir);
}
if(CheckPointer(zz)==POINTER_DYNAMIC)
{
delete(zz);
}
}
//+------------------------------------------------------------------+
//| Custom indicator iteration function |
//+------------------------------------------------------------------+
int ind=0;
//+------------------------------------------------------------------+
//| |
//+------------------------------------------------------------------+
int OnCalculate(const int rates_total,
const int prev_calculated,
const int begin,
const double &price[]
)
{
int start;
if(prev_calculated==0)
{
start=0;
}
else
{
start=prev_calculated-1;
}
for(int i=start;i<rates_total;i++)
{
HighBuffer[i]=price[i];
LowBuffer[i]=price[i];
}
int rv;
rv=dir.Calculate(rates_total,
prev_calculated,
HighBuffer,
LowBuffer,
DirectionBuffer);
if(rv==0)return(0);
zz.Calculate(rates_total,
prev_calculated,
HighBuffer,
LowBuffer,
DirectionBuffer,
LastHighBarBuffer,
LastLowBarBuffer,
ZigZagBuffer);
if(ind<= 10) ind++;
if(ind == 10)
{
double mx=0,mn=1000000;
double lg;
for(int i=0;i<rates_total;i++)
{
if(ZigZagBuffer[i]==0 || ZigZagBuffer[i]==EMPTY_VALUE) continue;
if(ZigZagBuffer[i] > mx) mx = ZigZagBuffer[i];
if(ZigZagBuffer[i] < mn) mn = ZigZagBuffer[i];
}
lg=mx-mn;
PrintFormat("Min index: %.05f Max index: %.05f Length: %.05f",mn,mx,lg);
lg/=100;
double levels[100];
int count[100];
ArrayInitialize(count,0);
for(int i=1; i<101; i++) levels[i-1]=NormalizeDouble(lg*i,_Digits);
mn=0;
for(int i=0;i<rates_total;i++)
{
if(ZigZagBuffer[i]==0 || ZigZagBuffer[i]==EMPTY_VALUE) continue;
if(mn==0) mn=ZigZagBuffer[i];
else
{
lg=MathAbs(mn-ZigZagBuffer[i]);
for(int j=0; j<100; j++)
{
if(lg<levels[j])
{
count[j]++;
break;
}
}
mn=ZigZagBuffer[i];
}
}
for(int i=0; i<100; i++)
{
PrintFormat("%d level: %.05f count: %d",i,levels[i],count[i]);
FileWrite(h,i,levels[i],count[i]);
}
FileClose(h);
}
return(rates_total);
}
//+------------------------------------------------------------------+
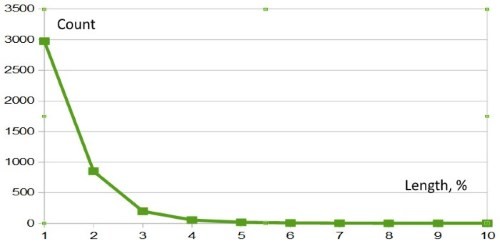
| Number | Segment length |
Number of segments |
|---|---|---|
| 0 |
0.01193 | 2975 |
| 1 |
0.02387 |
850 |
| 2 |
0.0358 |
197 |
| 3 |
0.04773 |
54 |
| 4 |
0.05967 |
17 |
- We should be cautious when entering the market following a trend if the segment size of the ZigZag applied to the combined indicator of the basket currency index exceeds a certain value. Here, the segment size is a length of the ZigZag segment projection to the price (Y) axis.
We should define the size of this "critical" segment. To do this, apply statistical methods to the above data. You may perform such an analysis on your own using your own risk preferences. In my opinion, the "critical" segment should not be equal to 0.03.
In this example, we analyzed the entire available history. However, if we want to capture the most recent market movements, we should use smaller periods (year, quarter or month).
A similar analysis can be performed for all currency baskets and most timeframes. It would be interesting to see how diagrams change for different "currency — timeframe" sets. Developers will immediately notice that the algorithm can be easily implemented in the code. Of course, you should not rely solely on one signal. Look for confirmation. The technique shown above can be applied to many common trend indicators. However, it is meaningless when dealing with oscillators.
Thus, we have made another step towards improving the quality of the market entries by using the combined indicators. Since it is necessary to look for a signal confirmation, this is what we are going to do now.
Joint use of different combined indicators
As you may know, we already have a combined indicator based on WPR. We examined it in details in our previous article, including its code and available patterns. This time, let's try applying it in conjunction with the combined index indicator. The resulting structure is expected to be quite efficient, since many trading systems are built the same way: trend-following indicator + oscillator.
Let's use the indicators testDistance.mq5, testWPR.mq5 and testWPRjpy.mq5 from the previous article and place them to the chart together with the combined EUR index testDistance.mq5 indicator. In our previous article, we have studied EURJPY, therefore, the testWPRjpy indicator should be re-written for working with USD. We will preserve the indicator's name in order not to alter the testDistance.mq5 indicator. All indicators from this section can be found in the wpr.zip archive.
The combined WPR indicator is to plot the difference between the combined WPRs of the currencies included into our currency pair (all that has been described in details in the original article). Our objective is to detect the previously described patterns on a single indicator when using another one as a filter:
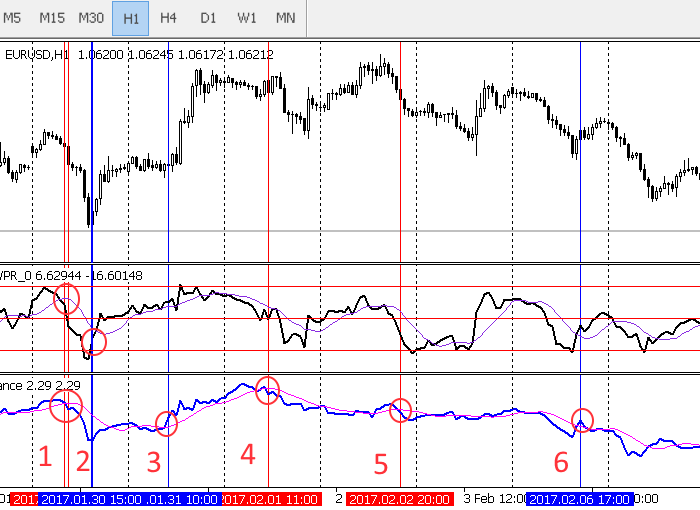
Potential market entry points (not all) are marked in the image. The entry points, at which the combined WPR (top window) and the combined EUR index (bottom window) show unidirectional patterns, are considered more reliable. Here, these are entries 1 and 6. These are the crossing points of the indicator and the moving average.
The entry 2 is of particular interest, since the combined WPR forms an almost academically accurate pattern crossing the oversold line. Other entries do not provide us with sufficient confirmation. Although, the actual market entry in such points would not cause losses, I would not take such a risk in real trading.
How reasonable is it to apply the combined indicator plotting the difference between the combined WPRs included in the currency basket? Wouldn't it be more correct to use the combined WPR for EUR in tandem with the combined EUR index? Let's try to do this by replacing testDistance.mq5 with testWPR.mq5:
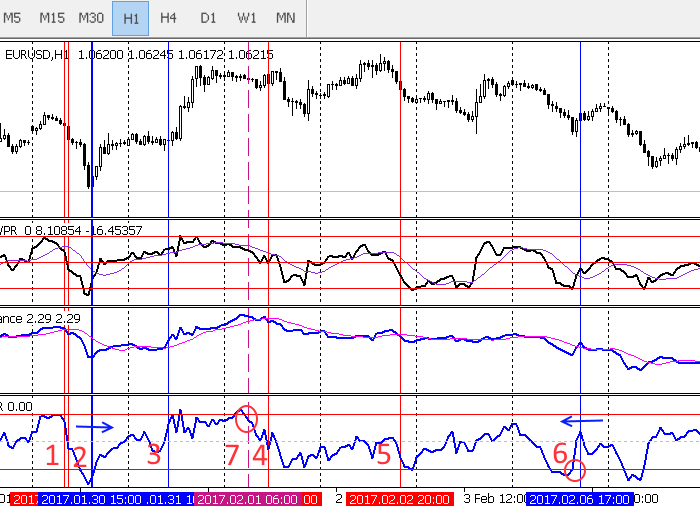
Here we can see the combined WPR indicator for EUR. Is it justified? In this case, it is. The indicator has corrected our entry by one candle in points 2 and 6 (arrows are used to specify the direction). The entry 1 is not confirmed enough. The entries 5 and 3 are not recommended. The point 4 has been corrected by the indicator into the point 7.
It would seem that the obtained results vote in favor of the combined WPR indicator of the currency basket rather than the indicator of the difference between the combined WPRs for two currencies of the pair. However, this is true only for this particular case. I would recommend applying both kinds of the combined oscillator in everyday usage till significant statistics is accumulated.
You may ask "What is so special about that? The combined usage of several indicators is not new to us. Why talk about it in the article? Besides, that has nothing to do with the patterns".
However, the objective of this article section is to answer the three questions:
- What is the best kind of oscillators to be used in this case?
- Are there any explicit limitations on using one of the forms?
- How correctly are patterns identified and confirmed when applying various kinds of oscillators?
We have answered these questions to the best of our ability. Besides, the way to test the conclusions has been made clear.
Conclusion
In this article, we have discussed the simplest patterns occurring when trading currency baskets. But does that mean an end to the entire topic? Not in the least. There are still a lot of interesting opportunities.
Let me once again repeat the obvious thing: The indicators attached to the articles are not intended for real trading! They are unstable and used for illustrative purposes only.
Programs used in the article:
| # | Name |
Type |
Description |
|---|---|---|---|
| 1 | testIndexMA.mq5 | Indicator | The test combined USD indicator with the moving average. |
| 2 | testIndexMA2.mq5 | Indicator | The test combined EUR indicator with the moving average. |
| 3 | testIndexZig-Zag1.mq5 | Indicator | The test ZigZag indicator capable of measuring and logging the lengths of individual segments. |
| 4 | testWPR.mq5 | Indicator | The test combined WPR indicator for EUR. |
| 5 | testWPRjpy.mq5 | Indicator | The test combined WPR indicator for USD. |
| 6 | testDistance.mq5 | Indicator | The test combined indicator plotting the difference between the two others. Here, these are testWPR.mq5 and testWPRjpy.mq5 (EUR and USD). |