MQL5 Cookbook - Pivot trading signals
Denis Kirichenko | 16 May, 2017
Introduction
The current article continues the series describing indicators and setups that generate trading signals. This time, we will have a look at the pivots — reversal levels (points). We will apply the Standard Library again. First, we will consider the reversal level indicator, develop a basic strategy based on it and finally search for the means to improve it.
It is assumed that the reader is familiar with the CExpertSignal base class for developing trading signal generators.
1. Pivot (reversal level) indicator
For this strategy, we will use the indicator plotting potential reversal levels. Plotting is performed by means of graphical construction only. No graphical objects are applied. The main advantage of this approach is the ability to refer to the indicator in the optimization mode. On the other hand, graphical constructions cannot exceed the indicator buffers meaning there will be no lines in the future.
Levels can be counted in several different ways. Further information on this subject is available in the article "Trading strategy based on pivot points analysis".
Let's consider the standard approach for now (the levels are defined using the following equations):
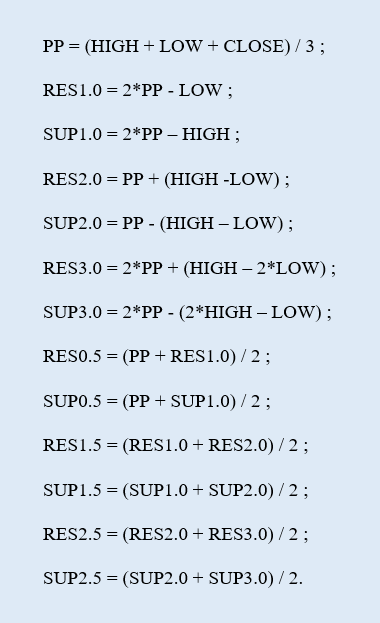
RES is an ith resistance level, while SUP is an ith support level. In total, there will be 1 main reversal level (PP), 6 resistance (RES) and 6 support levels (SUP).
So, visually the indicator looks like a set of horizontal levels plotted at different prices. When launched on the chart for the first time, the indicator draws levels for the current day only (Fig.1).

Fig.1. Pivot indicator: plotting for the current day
Let's examine the indicator code block by block beginning with the calculation one.
When a new day begins, we need to count all reversal levels.
if(gNewDay.isNewBar(today))
{
PrintFormat("New day: %s",TimeToString(today));
//--- normalize prices
double d_high=NormalizeDouble(daily_rates[0].high,_Digits);
double d_low=NormalizeDouble(daily_rates[0].low,_Digits);
double d_close=NormalizeDouble(daily_rates[0].close,_Digits);
//--- save prices
gYesterdayHigh=d_high;
gYesterdayLow=d_low;
gYesterdayClose=d_close;
//--- 1) pivot: PP = (HIGH + LOW + CLOSE) / 3
gPivotVal=NormalizeDouble((gYesterdayHigh+gYesterdayLow+gYesterdayClose)/3.,_Digits);
//--- 4) RES1.0 = 2*PP - LOW
gResVal_1_0=NormalizeDouble(2.*gPivotVal-gYesterdayLow,_Digits);
//--- 5) SUP1.0 = 2*PP – HIGH
gSupVal_1_0=NormalizeDouble(2.*gPivotVal-gYesterdayHigh,_Digits);
//--- 8) RES2.0 = PP + (HIGH -LOW)
gResVal_2_0=NormalizeDouble(gPivotVal+(gYesterdayHigh-gYesterdayLow),_Digits);
//--- 9) SUP2.0 = PP - (HIGH – LOW)
gSupVal_2_0=NormalizeDouble(gPivotVal-(gYesterdayHigh-gYesterdayLow),_Digits);
//--- 12) RES3.0 = 2*PP + (HIGH – 2*LOW)
gResVal_3_0=NormalizeDouble(2.*gPivotVal+(gYesterdayHigh-2.*gYesterdayLow),_Digits);
//--- 13) SUP3.0 = 2*PP - (2*HIGH – LOW)
gSupVal_3_0=NormalizeDouble(2.*gPivotVal-(2.*gYesterdayHigh-gYesterdayLow),_Digits);
//--- 2) RES0.5 = (PP + RES1.0) / 2
gResVal_0_5=NormalizeDouble((gPivotVal+gResVal_1_0)/2.,_Digits);
//--- 3) SUP0.5 = (PP + SUP1.0) / 2
gSupVal_0_5=NormalizeDouble((gPivotVal+gSupVal_1_0)/2.,_Digits);
//--- 6) RES1.5 = (RES1.0 + RES2.0) / 2
gResVal_1_5=NormalizeDouble((gResVal_1_0+gResVal_2_0)/2.,_Digits);
//--- 7) SUP1.5 = (SUP1.0 + SUP2.0) / 2
gSupVal_1_5=NormalizeDouble((gSupVal_1_0+gSupVal_2_0)/2.,_Digits);
//--- 10) RES2.5 = (RES2.0 + RES3.0) / 2
gResVal_2_5=NormalizeDouble((gResVal_2_0+gResVal_3_0)/2.,_Digits);
//--- 11) SUP2.5 = (SUP2.0 + SUP3.0) / 2
gSupVal_2_5=NormalizeDouble((gSupVal_2_0+gSupVal_3_0)/2.,_Digits);
//--- current day start bar
gDayStart=today;
//--- find the start bar of the active TF
//--- as a time series
for(int bar=0;bar<rates_total;bar++)
{
//--- selected bar time
datetime curr_bar_time=time[bar];
user_date.DateTime(curr_bar_time);
//--- selected bar day
datetime curr_bar_time_of_day=user_date.DateOfDay();
//--- if the current bar was the day before
if(curr_bar_time_of_day<gDayStart)
{
//--- save the start bar
gBarStart=bar-1;
break;
}
}
//--- reset the local counter
prev_calc=0;
}
The red color highlights the strings where the levels are re-calculated. Next, we should find the bar for the current timeframe to be used as a starting point for plotting levels. Its value is defined by the gBarStart variable. The SUserDateTime custom structure (the descendant of the CDateTime structure) is used during the search for working with dates and time.
Now, let's focus our attention on the block designed for filling buffer values for the current timeframe bars.
if(gNewMinute.isNewBar(time[0]))
{
//--- bar, up to which the calculation is performed
int bar_limit=gBarStart;
//--- if this is not the first launch
if(prev_calc>0)
bar_limit=rates_total-prev_calc;
//--- calculate the buffers
for(int bar=0;bar<=bar_limit;bar++)
{
//--- 1) pivot
gBuffers[0].data[bar]=gPivotVal;
//--- 2) RES0.5
if(gToPlotBuffer[1])
gBuffers[1].data[bar]=gResVal_0_5;
//--- 3) SUP0.5
if(gToPlotBuffer[2])
gBuffers[2].data[bar]=gSupVal_0_5;
//--- 4) RES1.0
if(gToPlotBuffer[3])
gBuffers[3].data[bar]=gResVal_1_0;
//--- 5) SUP1.0
if(gToPlotBuffer[4])
gBuffers[4].data[bar]=gSupVal_1_0;
//--- 6) RES1.5
if(gToPlotBuffer[5])
gBuffers[5].data[bar]=gResVal_1_5;
//--- 7) SUP1.5
if(gToPlotBuffer[6])
gBuffers[6].data[bar]=gSupVal_1_5;
//--- 8) RES2.0
if(gToPlotBuffer[7])
gBuffers[7].data[bar]=gResVal_2_0;
//--- 9) SUP2.0
if(gToPlotBuffer[8])
gBuffers[8].data[bar]=gSupVal_2_0;
//--- 10) RES2.5
if(gToPlotBuffer[9])
gBuffers[9].data[bar]=gResVal_2_5;
//--- 11) SUP2.5
if(gToPlotBuffer[10])
gBuffers[10].data[bar]=gSupVal_2_5;
//--- 12) RES3.0
if(gToPlotBuffer[11])
gBuffers[11].data[bar]=gResVal_3_0;
//--- 13) SUP3.0
if(gToPlotBuffer[12])
gBuffers[12].data[bar]=gSupVal_3_0;
}
}
Calculation of buffers begins when a new bar appears on the chart the indicator is launched at. The yellow color highlights the definition of the bar number, up to which the buffers are calculated. The local counter of calculated bars is used for that. We need it because the beginning of a new day does not reset the prev_calculated constant value to zero, although such a reset is necessary.
The full code of the pivot indicator can be found in the Pivots.mq5 file.
2. Basic strategy
Let's develop a simple basic strategy based on the described indicator. Let the open signal depend on the Open price location relative to the central pivot. The price touching the pivot level serves as a signal confirmation.
The EURUSD M15 chart (Fig.2) displays the day (January 15, 2015) Open level below the central pivot. However, later during the day, the price touches the pivot level upwards. Thus, there is a sell signal. If neither stop loss nor take profit are activated, the market exit is performed at the beginning of the next day.

Fig.2. Basic strategy: sell signal
Stop levels are bound to the pivot indicator reversal levels. The intermediate resistance level Res0.5 at $1.18153 serves as a stop loss when selling. The main support level Sup1.0 at $1.17301 is used as a take profit. We will return to the trading day of January 14 later. In the meantime, let's have a look at the code that is to form the essence of the basic strategy.
2.1 CSignalPivots signal class
Let's create a signal class that will generate signals from various patterns formed on the basis of price dynamics and the reversal levels indicator.
//| Class CSignalPivots |
//| Purpose: Class of trading signals based on pivots. |
//| CExpertSignal class descendant. |
//+------------------------------------------------------------------+
class CSignalPivots : public CExpertSignal
{
//--- === Data members === ---
protected:
CiCustom m_pivots; // "Pivots" indicator object
//--- adjustable parameters
bool m_to_plot_minor; // plot secondary levels
double m_pnt_near; // tolerance
//--- estimated
double m_pivot_val; // pivot value
double m_daily_open_pr; // current day Open price
CisNewBar m_day_new_bar; // new bar of the daily TF
//--- market patterns
//--- 1) Pattern 0 "first touch of the PP level" (top - buy, bottom - sell)
int m_pattern_0; // weight
bool m_pattern_0_done; // sign that a pattern is over
//--- === Methods === ---
public:
//--- constructor/destructor
void CSignalPivots(void);
void ~CSignalPivots(void){};
//--- methods of setting adjustable parameters
void ToPlotMinor(const bool _to_plot) {m_to_plot_minor=_to_plot;}
void PointsNear(const uint _near_pips);
//--- methods of adjusting "weights" of market models
void Pattern_0(int _val) {m_pattern_0=_val;m_pattern_0_done=false;}
//--- method of verification of settings
virtual bool ValidationSettings(void);
//--- method of creating the indicator and time series
virtual bool InitIndicators(CIndicators *indicators);
//--- methods of checking if the market models are generated
virtual int LongCondition(void);
virtual int ShortCondition(void);
virtual double Direction(void);
//--- methods for detection of levels of entering the market
virtual bool OpenLongParams(double &price,double &sl,double &tp,datetime &expiration);
virtual bool OpenShortParams(double &price,double &sl,double &tp,datetime &expiration);
//---
protected:
//--- method of the indicator initialization
bool InitCustomIndicator(CIndicators *indicators);
//--- get the pivot level value
double Pivot(void) {return(m_pivots.GetData(0,0));}
//--- get the main resistance level value
double MajorResistance(uint _ind);
//--- get the secondary resistance level value
double MinorResistance(uint _ind);
//--- get the main support level value
double MajorSupport(uint _ind);
//--- get the secondary support level value
double MinorSupport(uint _ind);
};
//+------------------------------------------------------------------+
I already used that approach in the article "MQL5 Cookbook - Trading signals of moving channels": the price touching a line is confirmed when the price falls into the line area. The m_pnt_near data member sets the tolerance for a reversal level.
The signal pattern served by the class plays the most important role. The base class is to have a single pattern. Apart from the weight (m_pattern_0), it also has a completion property within a trading day (m_pattern_0_done).
The CExpertSignal base signal class is rich in virtual methods. This allows for implementing fine-tuning of the derived class.
In particular, I have re-defined the OpenLongParams() and OpenShortParams() methods for calculating trading levels.
Let's examine the code of the first method — defining values for trading levels when buying.
//| Define trading levels when buying |
//+------------------------------------------------------------------+
bool CSignalPivots::OpenLongParams(double &price,double &sl,double &tp,datetime &expiration)
{
bool params_set=false;
sl=tp=WRONG_VALUE;
//--- if the Pattern 0 is considered
if(IS_PATTERN_USAGE(0))
//--- if the Pattern 0 is not complete
if(!m_pattern_0_done)
{
//--- Open price - market
double base_price=m_symbol.Ask();
price=m_symbol.NormalizePrice(base_price-m_price_level*PriceLevelUnit());
//--- sl price - Sup0.5 level
sl=this.MinorSupport(0);
if(sl==DBL_MAX)
return false;
//--- if sl price is set
sl=m_symbol.NormalizePrice(sl);
//--- tp price - Res1.0 level
tp=this.MajorResistance(0);
if(tp==DBL_MAX)
return false;
//--- if tp price is set
tp=m_symbol.NormalizePrice(tp);
expiration+=m_expiration*PeriodSeconds(m_period);
//--- if prices are set
params_set=true;
//--- pattern complete
m_pattern_0_done=true;
}
//---
return params_set;
}
//+------------------------------------------------------------------+
The stop loss price is calculated as the value of the first secondary support level using the MinorSupport() method. The profit is set at the price of the first main resistance level using the MajorResistance() method. In case of selling, the methods are replaced with MinorResistance() and MajorSupport() accordingly.
Make the custom signal the main one to let the methods for defining trading levels work properly. Here is how the method for defining the parent class trading levels looks like:
//| Detecting the levels for buying |
//+------------------------------------------------------------------+
bool CExpertSignal::OpenLongParams(double &price,double &sl,double &tp,datetime &expiration)
{
CExpertSignal *general=(m_general!=-1) ? m_filters.At(m_general) : NULL;
//---
if(general==NULL)
{
//--- if a base price is not specified explicitly, take the current market price
double base_price=(m_base_price==0.0) ? m_symbol.Ask() : m_base_price;
price =m_symbol.NormalizePrice(base_price-m_price_level*PriceLevelUnit());
sl =(m_stop_level==0.0) ? 0.0 : m_symbol.NormalizePrice(price-m_stop_level*PriceLevelUnit());
tp =(m_take_level==0.0) ? 0.0 : m_symbol.NormalizePrice(price+m_take_level*PriceLevelUnit());
expiration+=m_expiration*PeriodSeconds(m_period);
return(true);
}
//---
return(general.OpenLongParams(price,sl,tp,expiration));
}
//+------------------------------------------------------------------+
If no main signal index is set, the levels receive default values. In order to avoid this, set the following in the EA code when initializing the signal:
CSignalPivots *filter0=new CSignalPivots;
if(filter0==NULL)
{
//--- error
PrintFormat(__FUNCTION__+": error creating filter0");
return INIT_FAILED;
}
signal.AddFilter(filter0);
signal.General(0);
The buy condition verification method is present as follows:
//| Check the buy condition |
//+------------------------------------------------------------------+
int CSignalPivots::LongCondition(void)
{
int result=0;
//--- if the Pattern 0 is not considered
if(IS_PATTERN_USAGE(0))
//--- if the Pattern 0 is not complete
if(!m_pattern_0_done)
//--- if a day has opened above the pivot
if(m_daily_open_pr>m_pivot_val)
{
//--- minimum price on the current bar
double last_low=m_low.GetData(1);
//--- if the price is received
if((last_low>WRONG_VALUE) && (last_low<DBL_MAX))
//--- if there was a touch from above (considering the tolerance)
if(last_low<=(m_pivot_val+m_pnt_near))
{
result=m_pattern_0;
//--- to the Journal
Print("\n---== The price touches the pivot level from above ==---");
PrintFormat("Price: %0."+IntegerToString(m_symbol.Digits())+"f",last_low);
PrintFormat("Pivot: %0."+IntegerToString(m_symbol.Digits())+"f",m_pivot_val);
PrintFormat("Tolerance: %0."+IntegerToString(m_symbol.Digits())+"f",m_pnt_near);
}
}
//---
return result;
}
//+------------------------------------------------------------------+
It is easy to see that the touch from above is checked considering the tolerance last_low<=(m_pivot_val+m_pnt_near).
Apart from other things, the Direction() method for defining the "weighted" direction checks if the basic pattern is complete.
//| Define the "weighted" direction |
//+------------------------------------------------------------------+
double CSignalPivots::Direction(void)
{
double result=0.;
//--- receive daily history data
MqlRates daily_rates[];
if(CopyRates(_Symbol,PERIOD_D1,0,1,daily_rates)<0)
return 0.;
//--- if the Pattern 0 is complete
if(m_pattern_0_done)
{
//--- check for a new day
if(m_day_new_bar.isNewBar(daily_rates[0].time))
{
//--- reset the pattern completion flag
m_pattern_0_done=false;
return 0.;
}
}
//--- if the Pattern 0 is not complete
else
{
//--- day Open price
if(m_daily_open_pr!=daily_rates[0].open)
m_daily_open_pr=daily_rates[0].open;
//--- pivot
double curr_pivot_val=this.Pivot();
if(curr_pivot_val<DBL_MAX)
if(m_pivot_val!=curr_pivot_val)
m_pivot_val=curr_pivot_val;
}
//--- result
result=m_weight*(this.LongCondition()-this.ShortCondition());
//---
return result;
}
//+------------------------------------------------------------------+
As for exit signals, re-define the parent class methods CloseLongParams() and CloseShortParams(). Sample buy block code:
//| Define trading level when buying |
//+------------------------------------------------------------------+
bool CSignalPivots::CloseLongParams(double &price)
{
price=0.;
//--- if the Pattern 0 is considered
if(IS_PATTERN_USAGE(0))
//--- if the Pattern 0 is not complete
if(!m_pattern_0_done)
{
price=m_symbol.Bid();
//--- to the Journal
Print("\n---== Signal to close buy ==---");
PrintFormat("Market price: %0."+IntegerToString(m_symbol.Digits())+"f",price);
return true;
}
//--- return the result
return false;
}
//+------------------------------------------------------------------+
The exit signal threshold should be reset to zero in the EA code.
No direction check is performed in that case.
//| Generating a signal for closing of a long position |
//+------------------------------------------------------------------+
bool CExpertSignal::CheckCloseLong(double &price)
{
bool result =false;
//--- the "prohibition" signal
if(m_direction==EMPTY_VALUE)
return(false);
//--- check of exceeding the threshold value
if(-m_direction>=m_threshold_close)
{
//--- there's a signal
result=true;
//--- try to get the level of closing
if(!CloseLongParams(price))
result=false;
}
//--- zeroize the base price
m_base_price=0.0;
//--- return the result
return(result);
}
//+------------------------------------------------------------------+
The question arises: How is the exit signal checked in that case? First, it is checked by the presence of a position (in the Processing() method ), and second, using the m_pattern_0_done property (in the redefined CloseLongParams() and CloseShortParams() methods). As soon as the EA detects a position while the Pattern 0 is incomplete, it attempts to close it at once. This happens at the beginning of a trading day.
We have examined the basics of the CSignalPivots signal class. Now, let's dwell on the strategy class.
2.2 CPivotsExpert trading strategy class
The derived strategy class is similar to the one for moving channels. The first difference is that minute-by-minute trading mode is used instead of tick-by-tick one. This allows you to quickly test the strategy on a fairly deep history. Second, the check for exit is present. We have already defined when the EA can close a position.
The main handler method looks as follows:
//| Main module |
//+------------------------------------------------------------------+
bool CPivotsExpert::Processing(void)
{
//--- new minute bar
if(!m_minute_new_bar.isNewBar())
return false;
//--- calculate direction
m_signal.SetDirection();
//--- if there is no position
if(!this.SelectPosition())
{
//--- position opening module
if(this.CheckOpen())
return true;
}
//--- if there is a position
else
{
//--- position closing module
if(this.CheckClose())
return true;
}
//--- if there are no trade operations
return false;
}
//+------------------------------------------------------------------+
That's it. Now, we may launch the basic strategy. Its code is presented in the BasePivotsTrader.mq5 file.

Fig.3. Basic strategy: sell
Let's get back to the day of January 14, 2015. In this case, the model worked out perfectly. We opened short on the pivot and closed on the main support level Sup1.0.
The run was made in the strategy tester from 07.01.2013 to 07.01.2017 on EURUSD M15 with the following parameters:
- Entry signal threshold, [0...100] = 10;
- Weight, [0...1.0] = 1,0;
- Fixed volume = 0,1;
- Tolerance, points = 15.
As it turns out, the strategy trades with a steady result. A negative one (Fig. 4).

Fig.4. EURUSD: Results of the first basic strategy for 2013-2016
Judging by the results, we did everything wrong. We should have bought at a sell signal and sold at a buy one. But is it true? Let's check. To do this, we should develop a basic strategy and implement changes in the signals. In this case, a buy condition will look as follows:
//| Check condition for selling |
//+------------------------------------------------------------------+
int CSignalPivots::LongCondition(void)
{
int result=0;
//--- if the Pattern 0 is not considered
if(IS_PATTERN_USAGE(0))
//--- if the Pattern 0 is not complete
if(!m_pattern_0_done)
//--- if a day has opened below the pivot
if(m_daily_open_pr<m_pivot_val)
{
//--- maximum price on the current bar
double last_high=m_high.GetData(1);
//--- if the price is received
if((last_high>WRONG_VALUE) && (last_high<DBL_MAX))
//--- if there was a touch from above (considering the tolerance)
if(last_high>=(m_pivot_val-m_pnt_near))
{
result=m_pattern_0;
//--- to the Journal
Print("\n---== The price touches the pivot level from below ==---");
PrintFormat("Price: %0."+IntegerToString(m_symbol.Digits())+"f",last_high);
PrintFormat("Pivot: %0."+IntegerToString(m_symbol.Digits())+"f",m_pivot_val);
PrintFormat("Tolerance: %0."+IntegerToString(m_symbol.Digits())+"f",m_pnt_near);
}
}
//---
return result;
}
//+------------------------------------------------------------------+
Let's launch another strategy in the tester and obtain the result:

Fig.5. EURUSD: Results of the second basic strategy for 2013-2016
Obviously, the mirroring of the first version did not happen. Probably, the reason is the stop loss and take profit values. Besides, positions with no stop levels activated during a trading day are closed when a new day starts.
Let's try to change the second version of the basic strategy, so that a stop loss level is placed farther when buying — before the main support level Sup1.0, while the profit size is limited by the intermediate resistance level Res0.5. When selling, a stop loss is to be placed on Res1.0, while a take profit — on Sup0.5.
In this case, trading levels for buying are defined the following way:
//| Define trade levels for buying |
//+------------------------------------------------------------------+
bool CSignalPivots::OpenLongParams(double &price,double &sl,double &tp,datetime &expiration)
{
bool params_set=false;
sl=tp=WRONG_VALUE;
//--- if the Pattern 0 is considered
if(IS_PATTERN_USAGE(0))
//--- if the Pattern 0 is not complete
if(!m_pattern_0_done)
{
//--- Open price - market
double base_price=m_symbol.Ask();
price=m_symbol.NormalizePrice(base_price-m_price_level*PriceLevelUnit());
//--- sl price - Sup1.0 level
sl=this.MajorSupport(0);
if(sl==DBL_MAX)
return false;
//--- if sl price is set
sl=m_symbol.NormalizePrice(sl);
//--- tp price - Res0.5 level
tp=this.MinorResistance(0);
if(tp==DBL_MAX)
return false;
//--- if tp price is set
tp=m_symbol.NormalizePrice(tp);
expiration+=m_expiration*PeriodSeconds(m_period);
//--- if prices are set
params_set=true;
//--- pattern complete
m_pattern_0_done=true;
}
//---
return params_set;
}
//+------------------------------------------------------------------+
The result of the third version in the tester is as follows:

Fig.6. EURUSD: Results of the third basic strategy for 2013-2016
The image is more or less similar to the mirrored first version. At first glance, it seems that the Grail is found. But there are some pitfalls we are going to discuss below.
3. Robustness
If we look closely at Fig. 6, we can easily see that the balance curve grew unevenly. There were the segments where the balance accumulated profits steadily. There were also the drawdown segments as well as the ones where the balance curve moved strictly to the right.
In general, we can say that the strategy lacks robustness. Is it possible to improve it? Let's try.
3.1 Trend indicator
In my opinion, the trading rules described above work better when there is a directional movement in the market — a trend. The strategy showed the best result on EURUSD in 2014 — early 2015 when the pair was in a steady decline.
This means we need a filter allowing us to avoid a flat. There are plenty of materials about determining a stable trend. You can also find them in the Articles section on mql5.com. Personally, I like the article "Several ways of finding a trend in MQL5" most. It offers a convenient and, more importantly, universal way of searching for a trend.
I have developed a similar indicator MaTrendCatcher. It compares the fast and slow Moving Averages. If the difference between them is positive, the trend is bullish. The indicator histogram bars are equal to 1. If the difference is negative, the trend is bearish. The bars are equal to minus 1 (Fig. 7).

Fig.7. MaTrendCatcher trend indicator
Besides, if the difference between the Moving Averages increases relative to the previous bar (a trend becomes stronger), the bar is green, otherwise it is red.
Another feature added to the indicator: if the difference between MAs is insignificant, the bars are not displayed. The value of the difference, at which the bars are hidden, depends on the "Cutoff, pp" indicator parameter (Fig. 8).

Fig.8. MaTrendCatcher trend indicator with small differences hidden
So, let's use the MaTrendCatcher indicator for filtration.
To apply the indicator, we need to implement some changes in the code of the project files. Note that the last version of the EA is to be stored in the Model folder.
For this strategy, we need to obtain the calculated value of the "weighted" direction. Therefore, we need a custom class descendant from the base signal class.
Then, a new model appears in the updated signal class of reversal levels — Model 1 "trend-flat-countertrend".
In essence, it complements Model 0. Therefore, it can be called a sub-pattern. We will note that in the code a bit later.
Now, verification of buy conditions looks as follows:
//| Check the buy condition |
//+------------------------------------------------------------------+
int CSignalPivots::LongCondition(void)
{
int result=0;
//--- if the Pattern 0 is not considered
if(IS_PATTERN_USAGE(0))
//--- if the Pattern 0 is not complete
if(!m_pattern_0_done)
{
m_is_signal=false;
//--- if a day has opened below the pivot
if(m_daily_open_pr<m_pivot_val)
{
//--- maximum price on the past bar
double last_high=m_high.GetData(1);
//--- if the price is received
if(last_high>WRONG_VALUE && last_high<DBL_MAX)
//--- if there was a touch from above (considering the tolerance)
if(last_high>=(m_pivot_val-m_pnt_near))
{
result=m_pattern_0;
m_is_signal=true;
//--- to the Journal
this.Print(last_high,ORDER_TYPE_BUY);
}
}
//--- if the Pattern 1 is considered
if(IS_PATTERN_USAGE(1))
{
//--- if there was a bullish trend on the past bar
if(m_trend_val>0. && m_trend_val!=EMPTY_VALUE)
{
//--- if there is an acceleration
if(m_trend_color==0. && m_trend_color!=EMPTY_VALUE)
result+=(m_pattern_1+m_speedup_allowance);
//--- if there is no acceleration
else
result+=(m_pattern_1-m_speedup_allowance);
}
}
}
//---
return result;
}
The green block highlights where the sub-pattern is applied.
The idea behind the calculation is as follows: if the market entry is performed without considering the sub-pattern, the signal result is equal to the Pattern 0 weight. If the sub-pattern is considered, the following options are possible:
- entering in the direction of a trend with acceleration (trend and acceleration bonuses);
- entering in the direction of a trend without acceleration (trend bonus and acceleration penalty);
- entering against a trend with acceleration (countertrend and acceleration penalties);
- entering against a trend with acceleration (countertrend penalty and acceleration bonus).
This approach avoids reacting to a weak signal. If the signal weight overcomes a threshold value, it affects the trading volume size. The pivot EA class features the CPivotsExpert::LotCoefficient() method:
//| Lot ratio |
//+------------------------------------------------------------------+
double CPivotsExpert::LotCoefficient(void)
{
double lot_coeff=1.;
//--- general signal
CExpertUserSignal *ptr_signal=this.Signal();
if(CheckPointer(ptr_signal)==POINTER_DYNAMIC)
{
double dir_val=ptr_signal.GetDirection();
lot_coeff=NormalizeDouble(MathAbs(dir_val/100.),2);
}
//---
return lot_coeff;
}
//+------------------------------------------------------------------+
For instance, if the signal has gathered 120 grades, the initial volume is adjusted by 1.2, while in case of 70, it is adjusted by 0.7.
To apply the ratio, it is still necessary to re-define the OpenLong() and OpenShort() methods. For example, the buy method is represented as follows:
//| Long position open or limit/stop order set |
//+------------------------------------------------------------------+
bool CPivotsExpert::OpenLong(double price,double sl,double tp)
{
if(price==EMPTY_VALUE)
return(false);
//--- get lot for open
double lot_coeff=this.LotCoefficient();
double lot=LotOpenLong(price,sl);
lot=this.NormalLot(lot_coeff*lot);
//--- check lot for open
lot=LotCheck(lot,price,ORDER_TYPE_BUY);
if(lot==0.0)
return(false);
//---
return(m_trade.Buy(lot,price,sl,tp));
}
//+------------------------------------------------------------------+
The idea with the dynamic formation of the lot size is quite simple: the stronger the signal, the greater the risk.
3.2 Range size
It is easy to see that reversal levels (pivots) are close to each other indicating a low market volatility. To avoid trading on such days, the "Width limit, pp" parameter has been introduced. The Pattern 0 (together with the sub-pattern) is considered complete if the limit is not exceeded. The limit is verified in the Direction() method body. Below is a part of the code:
if(m_wid_limit>0.)
{
//--- estimated upper limit
double norm_upper_limit=m_symbol.NormalizePrice(m_wid_limit+m_pivot_val);
//--- actual upper limit
double res1_val=this.MajorResistance(0);
if(res1_val>WRONG_VALUE && res1_val<DBL_MAX)
{
//--- if the limit is not exceeded
if(res1_val<norm_upper_limit)
{
//--- Pattern 0 is complete
m_pattern_0_done=true;
//--- to the Journal
Print("\n---== Upper limit not exceeded ==---");
PrintFormat("Estimated: %0."+IntegerToString(m_symbol.Digits())+"f",norm_upper_limit);
PrintFormat("Actual: %0."+IntegerToString(m_symbol.Digits())+"f",res1_val);
//---
return 0.;
}
}
//--- estimated lower limit
double norm_lower_limit=m_symbol.NormalizePrice(m_pivot_val-m_wid_limit);
//--- actual lower limit
double sup1_val=this.MajorSupport(0);
if(sup1_val>WRONG_VALUE && sup1_val<DBL_MAX)
{
//--- if the limit is not exceeded
if(norm_lower_limit<sup1_val)
{
//--- Pattern 0 is complete
m_pattern_0_done=true;
//--- to the Journal
Print("\n---== Lower limit not exceeded ==---");
PrintFormat("Estimated: %0."+IntegerToString(m_symbol.Digits())+"f",norm_lower_limit);
PrintFormat("Actual: %0."+IntegerToString(m_symbol.Digits())+"f",sup1_val);
//---
return 0.;
}
}
}
If the signal does not pass the range width verification, the following entry appears in the Journal:
2015.08.19 00:01:00 Estimated: 1.10745
2015.08.19 00:01:00 Actual: 1.10719
Launch the strategy in the tester in the optimization mode. I have used the following optimization parameters:
- "Width limit, pp";
- "Tolerance, pp";
- "Fast МА";
- "Slow МА";
- "Cut-off, pp".
The most successful run in terms of profitability looks as follows:

Fig.9. EURUSD: Results of the strategy with the use of filters for 2013-2016
As expected, some signals were sorted out. The balance curve became smoother.
But there are also fails. As seen on the chart, the strategy generates segments where the balance curve fluctuates in a narrow range without a visible increase in profit starting with 2015. The optimization results can be found in the EURUSD_model.xml file.
Let's look at the results on other symbols.
The best run for USDJPY is displayed on Fig.10.

Fig.10. USDJPY: Results of the strategy with the use of filters for 2013-2016
Now, let's have a look at spot gold. The best result is shown in Fig. 11.

Fig.11. XAUUSD: Results of the strategy with the use of filters for 2013-2016
During this period, the precious metal was trading in a narrow range, so the strategy did not bring a positive result.
As for GBP, the best run is displayed in Fig. 12.

Fig.12. GBPUSD: Results of the strategy with the use of filters for 2013-2016
GBP traded quite well in the direction of a trend. But the correction in 2015 spoiled the final result.
In general, the strategy works best during a trend.
Conclusion
Trading strategy development consists of several stages. At the initial stage, the trading idea is formulated. In most cases, this is a hypothesis that needs to be formalized in the form of a code and then checked in the tester. It is often necessary to adjust and refine such a hypothesis during the testing process. This is the standard work of a developer. Here we use the same approach to code the pivot strategy. In my opinion, OOP greatly simplifies the task.
All tests in the optimization mode were conducted in the MQL5 Cloud Network. The cloud technology allowed me to evaluate the efficiency of the strategies in quick and non-costly manner.
File location

It is most convenient to put the strategy files to the single Pivots folder. Move the indicator files (Pivots.ex5 and MaTrendCatcher.ex5) to the %MQL5\Indicators indicator folder after the compilation.