An Example of Developing a Spread Strategy for Moscow Exchange Futures
MetaQuotes | 7 February, 2017
The MetaTrader 5 platform allows developing and testing trading robots that simultaneously trade multiple financial instruments. The built-in Strategy Tester automatically downloads required tick history from the broker's server taking into account contract specifications, so the developer does not need to do that manually. This makes it possible to easily and reliably reproduce trading environment conditions, including even millisecond intervals between the arrival of ticks on different symbols. In this article we will demonstrate the development and testing of a spread strategy on two Moscow Exchange futures.
Negative Correlation of Assets: Si and RTS
Si-M.Y and RTS-M.Y futures are traded on Moscow Exchange. These futures types are tightly correlated. Here M.Y means contract expiration date:
- M — the number of the month
- Y — the last two digits of the year
Si is a futures contract on US dollar/Russian ruble exchange rate, RTS is a futures contract on the RTS index expressed in US dollars. The RTS index includes stocks of Russian companies, the prices of which are expressed in rubles, USD/RUR fluctuations also affect index fluctuations expressed in US dollars. Price charts show that when one asset grows, the second asset usually falls.
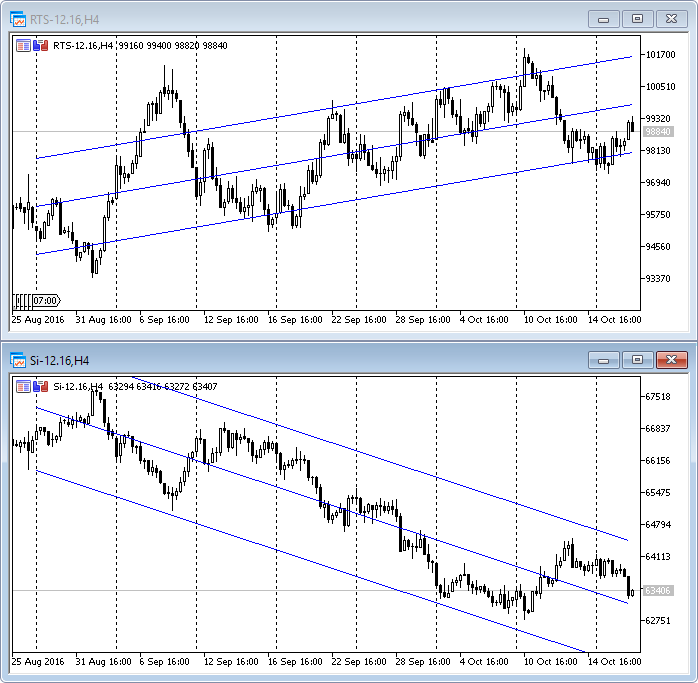
For a better visualization, we have drawn a standard deviation channel on these charts.
Calculating Linear Regression between Si and RTS
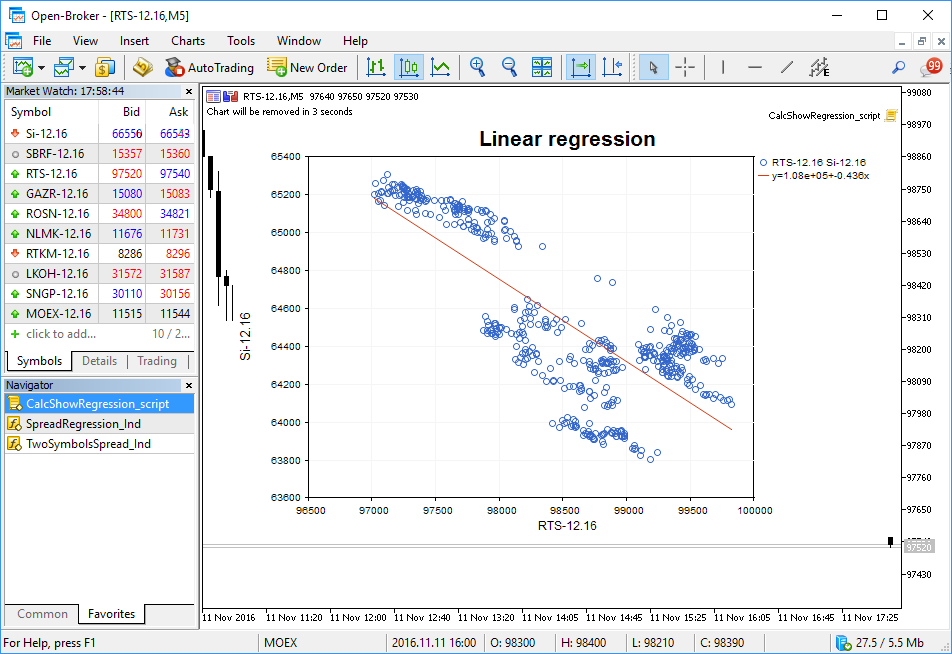
We can express correlation between the two assets using a linear regression equation Y(X)=A(X)+B. Let's create a script CalcShowRegression_script.mq5, which takes two arrays of close prices, calculates coefficients and shows the distribution diagram with a regression line straight on the chart.
Regression coefficients are calculated using an ALGLIB function, and the values are drawn using graphic classes of the standard library.
Drawing an indicator of spread between Si and a synthetic sequence
We have received linear regression coefficients and can draw a synthetic chart of type Y(RTS) = A*RTS+B. Let us call the difference between the source asset and the synthetic sequence "a spread". This difference will vary at each bar from negative to positive values.
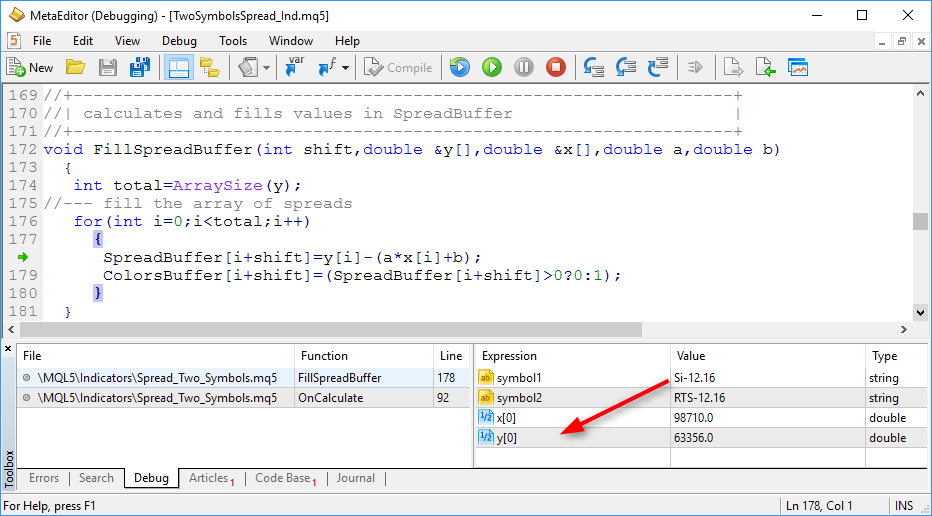
In order to visualize the spread, let us create the TwoSymbolsSpread_Ind.mql5 indicator that displays the histogram of spread on the last 500 bars. Positive values are drawn in blue, negative values are yellow.
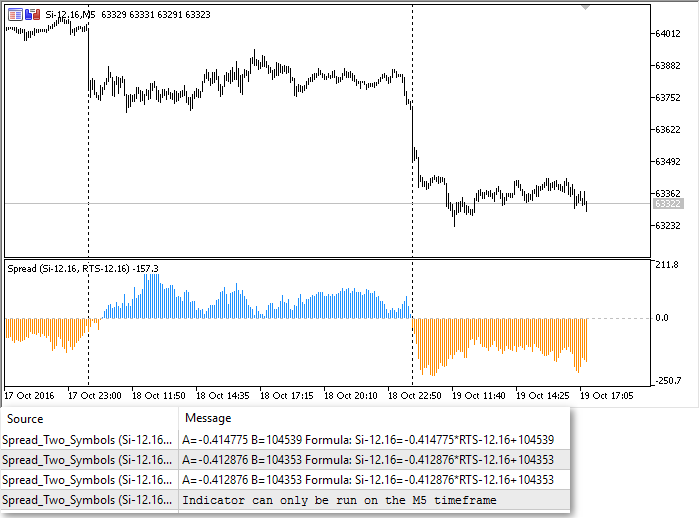
The indicator updates and writes to the Experts journal linear regression coefficients when a new bar is opened. Moreover, it waits till the new candlestick opens on both instruments, including Si and RTS. This way the indicator ensures correctness and accuracy of calculations.
Creating a linear regression channel on the spread channel over the last 100 bars
The spread indicator shows that the difference between the Si futures and the synthetic symbol changes from time to time. In order to evaluate the current spread, let us create the SpreadRegression_Ind.mq5 indicator (spread with a linear regression on it) that draws a trend line on a spread chart. The line parameters are calculated using linear regression. Let us launch the two indicators on a chart for debugging.
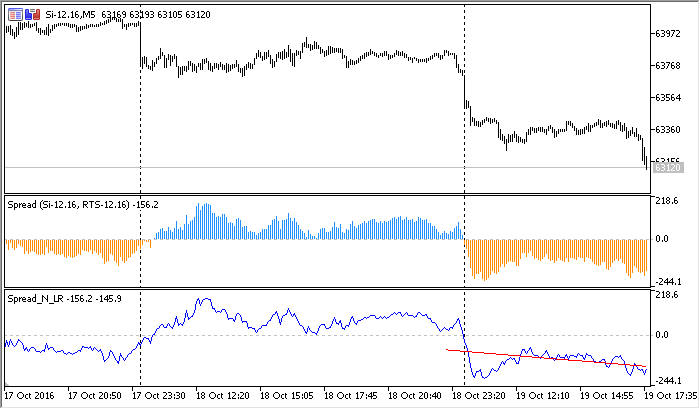
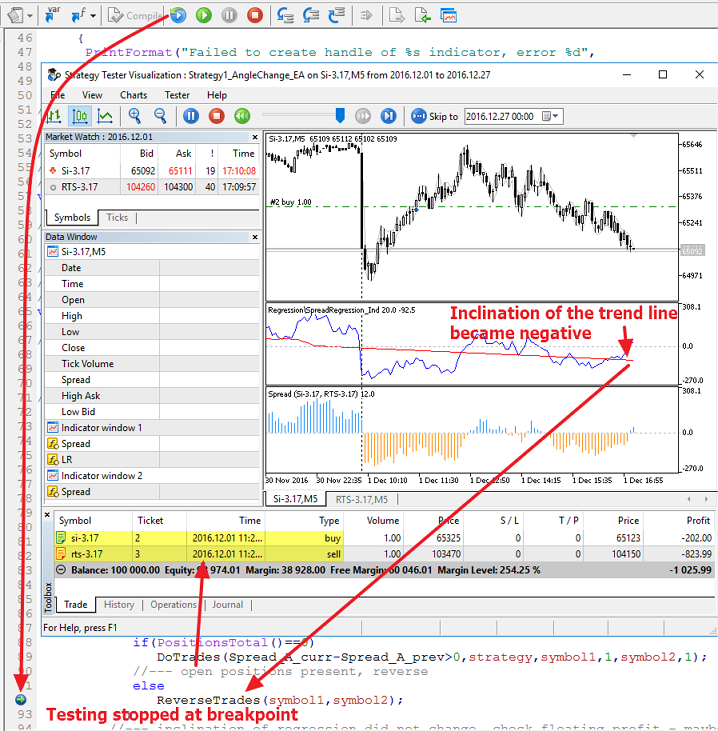
The slope of the red trend line changes depending on the spread value on the last 100 bars. Now we have a minimum of required data and we can try to build a trading system.
Strategy #1: Linear regression slope change on a spread chart
Spread values in the TwoSymbolsSpread_Ind.mql5 indicator are calculated as the difference between Si and Y(RTS)=A*RTS + B. You can easily check it by running the indicator in the debugging mode (F5 key).
Let us create a simple Expert Advisor that would monitor change of slope of the linear regression attached to a spread chart. Line slope is the A coefficient in the equation: Y=A*X+B. If trend is positive on the spread chart, A>0. If trend is negative, A<0. The linear regression is calculated using the last 100 values of the spread chart. Here is a part of the Expert Advisor code Strategy1_AngleChange_EA.mq5.
//+------------------------------------------------------------------+
//| Spread strategy type |
//+------------------------------------------------------------------+
enum SPREAD_STRATEGY
{
BUY_AND_SELL_ON_UP, // Buy 1-st, Sell 2-nd
SELL_AND_BUY_ON_UP, // Sell 1-st, Buy 2-nd
};
//---
input int LR_length=100; // Number of bars for a regression on spread
input int Spread_length=500; // number of bars for spread calculation
input ENUM_TIMEFRAMES period=PERIOD_M5; // Time-frame
input string symbol1="Si-12.16"; // The first symbol of the pair
input string symbol2="RTS-12.16"; // The second symbol of the pair
input double profit_percent=10; // Percent of profit to lock in
input SPREAD_STRATEGY strategy=SELL_AND_BUY_ON_UP; // Type of a spread strategy
//--- Indicator handles
int ind_spreadLR,ind,ind_2_symbols;
//--- A class for trading operations
CTrade trade;
//+------------------------------------------------------------------+
//| Expert tick function |
//+------------------------------------------------------------------+
void OnTick()
{
//--- The A coefficient of the linear regression slope on the spread chart Y(X)=A*X+B
static double Spread_A_prev=0;
if(isNewBar())
PrintFormat("New bar %s opened at %s",_Symbol,TimeToString(TimeCurrent(),TIME_DATE|TIME_SECONDS));
//--- Wait for indicator data to refresh, because it works on two symbols
if(BarsCalculated(ind_spreadLR)==Bars(_Symbol,_Period))
{
//--- Get linear regression values on the spread chart for bars with indices 1 and 2 ("yesterday" and "the day before yesterday")
double LRvalues[];
double Spread_A_curr;
int copied=CopyBuffer(ind_spreadLR,1,1,2,LRvalues);
if(copied!=-1)
{
//--- Linear regression coefficient on the last completed ("yesterday") bar
Spread_A_curr=LRvalues[1]-LRvalues[0];
//--- If the linear regression slope has changed, the product of current and previous value is less than zero
if(Spread_A_curr*Spread_A_prev<0)
{
PrintFormat("Slope of LR changed, Spread_A_curr=%.2f, Spread_A_prev=%.2f: %s",
Spread_A_curr,Spread_A_prev,TimeToString(TimeCurrent(),TIME_SECONDS));
//--- If we have no open positions, enter the market with both symbols
if(PositionsTotal()==0)
DoTrades(Spread_A_curr-Spread_A_prev>0,strategy,symbol1,1,symbol2,1);
//--- If there are open positions, reverse them
else
ReverseTrades(symbol1,symbol2);
}
//--- LR slope has not changed, check the floating profit - isn't it time to close?
else
{
double profit=AccountInfoDouble(ACCOUNT_PROFIT);
double balance=AccountInfoDouble(ACCOUNT_BALANCE);
if(profit/balance*100>=profit_percent)
{
//--- Required floating profit level reached, take it
trade.PositionClose(symbol1);
trade.PositionClose(symbol2);
}
}
//--- Remember trend direction to compare at the opening of a new bar
Spread_A_prev=Spread_A_curr;
}
}
}
In order to eliminate the necessity to make assumptions on what to buy and what to sell when trend changes, let us add an external parameter that allows reversing trading rules:
Now we can start Expert Advisor testing and debugging.
Testing the trading Strategy #1
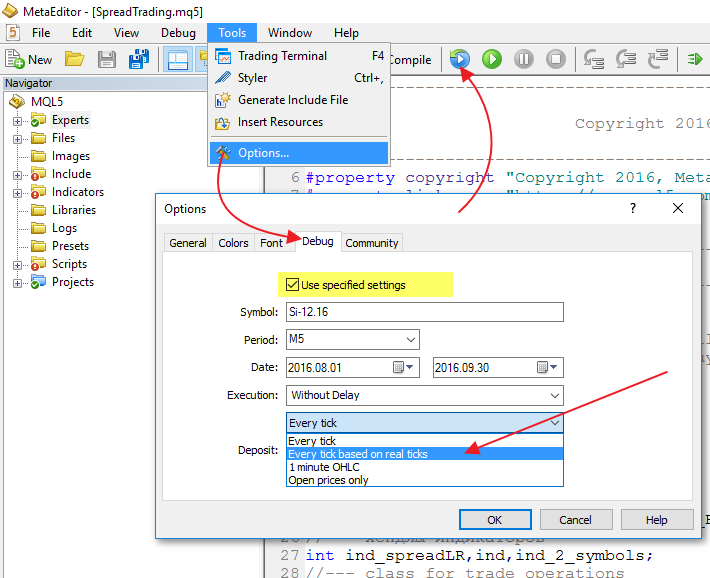
The visual testing mode suits best for debugging. Set the required data using the menu Tools-Settings-Debug:
- Symbol
- TimeFrame
- Testing interval
- Execution
- Deposit
- Tick Generation Mode
The recommended mode for exchange instruments is "Every tick based on real ticks". In this case the EA will be tested using recorded history data, and final results will be very close to real trading conditions.
The MetaTrader 5 trade server automatically collects and stores all ticks received from an exchange and sends the whole tick history to the terminal upon the first request.
This debugging mode allows executing the testing process in the visual mode while checking the values of any variables where necessary using breakpoints. Indicators used in the robot will be automatically loaded to a chart, there is no need to attach them manually.
Once the EA code is debugged, we can optimize parameters.
Optimization of trading Strategy #1
The Strategy1_AngleChange_EA.mq5 Expert Advisor has several external parameters that can be configured by optimization (highlighted in yellow):
input int Spread_length=500; // number of bars for spread calculation
input double profit_percent=10; // Percent of profit to lock in
input SPREAD_STRATEGY strategy=SELL_AND_BUY_ON_UP; // Type of a spread strategy
In this case we will only optimize profit_percent for two versions of the strategy, in order to understand whether there is a difference between them. In other words, we fix the value of the strategy parameter and optimize based on profit_percent from 0.2 to 3.0%, in order to see the overall picture for the two methods to trade line slope changes.
For the BUY_AND_SELL_ON_UP rule (buy the first asset, sell the second one), when the line slope changes from negative to positive, optimization does not show good results. In general, this market entry method does not look attractive, we get more losses during the two-month testing.
The SELL_AND_BUY_ON_UP rule (sell the first asset, buy the second one) gives better optimization result: 5 of 15 test runs show some profit.
Optimization was performed on history data from August 1 to September 30, 2016 (two months interval). In general, both trading variants do not look promising. Perhaps the problem is that the parameter that we used for entries, i.e. the trend line slope over the last 100 bars, is a lagging indicator. Let's try to develop a second version of the strategy.
Strategy #2: Spread sign change on a completed bar
In the second strategy, we analyze change of spread sign. We will only analyze values of completed bars, i.e. we will check it at the opening of "today's" bar. If spread on the "day before yesterday"'s bar was negative, and it was positive on the "yesterday"'s bar, we can assume that the spread has turned up. The code still provides for the possibility to trade spread change in any direction. We can change entry direction using the strategy parameter. Here is a block from the Strategy2_SpreadSignChange_EA.mq5 code:
//| Expert tick function |
//+------------------------------------------------------------------+
void OnTick()
{
//--- Previous spread value as difference between Symbol1 and Y(Symbol2)=A*Symbol2+B
static double Spread_prev=0;
if(isNewBar())
PrintFormat("New bar %s opened at %s",_Symbol,TimeToString(TimeCurrent(),TIME_DATE|TIME_SECONDS));
//--- Wait for indicator data to refresh, because it works on two symbols
if(BarsCalculated(ind_spreadLR)==Bars(_Symbol,_Period))
{
//--- Get spread values for bars with indices 1 and 2 ("yesterday" and "the day before yesterday")
double SpreadValues[];
int copied=CopyBuffer(ind_spreadLR,0,1,2,SpreadValues);
double Spread_curr=SpreadValues[1];
if(copied!=-1)
{
//--- If the spread sign has changed, the product of current and previous value is less than zero
if(Spread_curr*Spread_prev<0)
{
PrintFormat("Spread sign changed, Spread_curr=%.2f, Spread_prev=%.2f: %s",
Spread_curr,Spread_prev,TimeToString(TimeCurrent(),TIME_SECONDS));
//--- If we have no open positions, enter the market with both symbols
if(PositionsTotal()==0)
DoTrades(Spread_curr>0,strategy,symbol1,1,symbol2,1);
//--- There are open positions, reverse them
else
ReverseTrades(symbol1,symbol2);
}
//--- Spread sign has not changed, check the floating profit - isn't it time to close?
else
{
double profit=AccountInfoDouble(ACCOUNT_PROFIT);
double balance=AccountInfoDouble(ACCOUNT_BALANCE);
if(profit/balance*100>=profit_percent)
{
//--- Required floating profit level reached, take it
trade.PositionClose(symbol1);
trade.PositionClose(symbol2);
}
}
//--- Remember spread value to compare at the opening of a new bar
Spread_prev=Spread_curr;
}
}
}
First we debug the EA in the visual testing mode, and then run optimization by profit_percent, like we did for the first strategy. Results:

As you can see, the "sell first and buy second asset" rule applied to the second strategy also gives disappointing testing results. The "Buy first and sell the second asset" gives more losses in all test runs.
Let us try to create the third variant of the strategy.
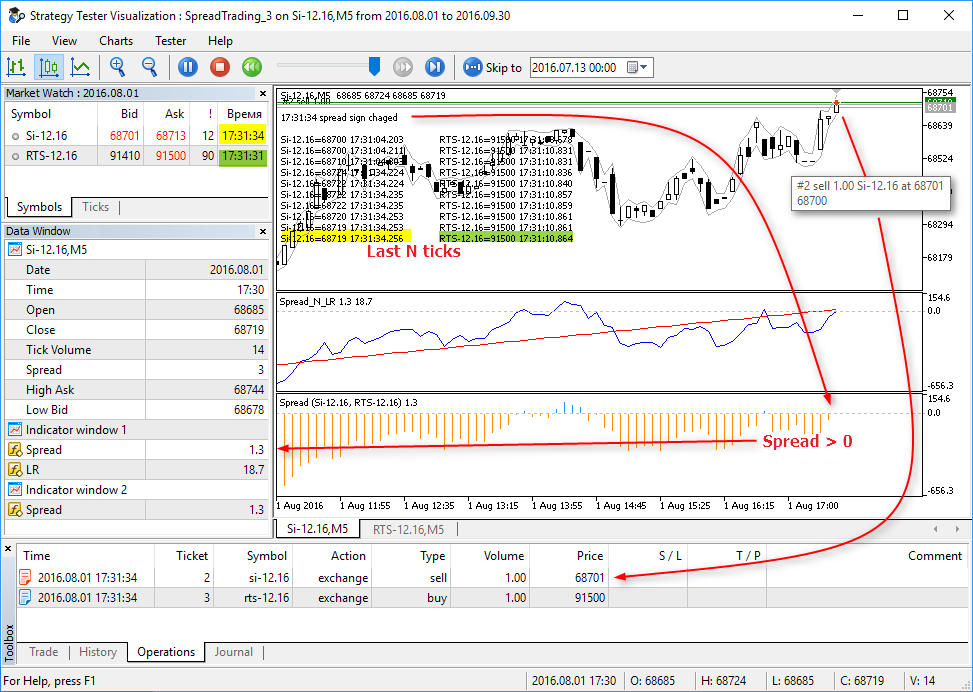
Strategy #3: Spread sign change on the current bar and confirmation over N ticks
Two previous strategies only worked at bar opening, i.e. they only analyzed changes on fully completed bars. Now we will try to work inside the current bar. Let us analyze spread changes on every tick, and if the spread sign on the completed bar and that on the current bar differ, we should assume that the spread direction has changed.
Also, the spread sign change should be stable over the last N ticks, which will help filter false signals. We need to add the external parameter ticks_for_trade=10 into our Expert Advisor. If the spread sign is negative on the last 10 ticks, and it was positive on the previous bar, the EA should enter the market. Here is the OnTick() function of the Strategy3_SpreadSignOnTick_EA.mq5 Expert Advisor.
//| Expert tick function |
//+------------------------------------------------------------------+
void OnTick()
{
if(isNewBar())
PrintFormat("New bar %s opened at %s",_Symbol,TimeToString(TimeCurrent(),TIME_DATE|TIME_SECONDS));
//--- Wait for indicator data to refresh, because it works on two symbols
if(BarsCalculated(ind_spreadLR)==Bars(_Symbol,_Period))
{
//--- Get spread values on the current (today) and previous (yesterday) bar
double SpreadValues[];
int copied=CopyBuffer(ind_spreadLR,0,0,2,SpreadValues);
double Spread_curr=SpreadValues[1]; // spread on the current incomplete bar
double Spread_prev=SpreadValues[0]; // spread on the previous complete bar
if(copied!=-1)
{
//--- If the spread sign change is stable on the last ticks_for_trade ticks
if(SpreadSignChanged(Spread_curr,Spread_prev,ticks_for_trade))
{
PrintFormat("Spread sign changed, Spread_curr=%.2f, Spread_prev=%.2f: %s",
Spread_curr,Spread_prev,TimeToString(TimeCurrent(),TIME_SECONDS));
//--- Show on the chart the values of the last ticks_for_trade trades of both symbols
ShowLastTicksComment(ticks_for_trade);
//--- If we have no open positions, enter the market with both symbols
if(PositionsTotal()==0)
DoTrades(Spread_curr>0,strategy,symbol1,1,symbol2,1);
//--- There are open positions, reverse them
else
ReverseTrades(Spread_curr>0,positionstype,symbol1,symbol2);
}
//--- Spread sign has not changed, check the floating profit - isn't it time to close?
else
{
double profit=AccountInfoDouble(ACCOUNT_PROFIT);
double balance=AccountInfoDouble(ACCOUNT_BALANCE);
if(profit/balance*100>=profit_percent)
{
//--- Required floating profit level reached, take it
trade.PositionClose(symbol1);
trade.PositionClose(symbol2);
positionstype=0;
}
}
}
}
}
In this Expert Advisor we have added the ShowLastTicksComment() function which displays on the chart the values of last N ticks of both symbols once the signal appears. This allows us to visually test the strategy and monitor tick changes with a millisecond precision.
Now we start the same optimization options applied in the first two strategies, and receive the following results:
"Buying the first asset and selling the seconds one"

"Selling the first asset and buying the seconds one"
Results of such a simple optimization are not much improved.
Strategy 4: Spread reaches a preset percent value
Now let us create the fourth and the last strategy for spread trading. It will be as simple as the three previous strategies: a trade signal appears when spread value riches the specified percent of the first asset price — spread_delta. Tick handler OnInit() has changed slightly, here is how it looks like in Strategy4_SpreadDeltaPercent_EA.mq5.
//| Expert tick function |
//+------------------------------------------------------------------+
void OnTick()
{
if(isNewBar())
PrintFormat("New bar %s opened at %s",_Symbol,TimeToString(TimeCurrent(),TIME_DATE|TIME_SECONDS));
//--- Wait for indicator data to refresh, because it works on two symbols
if(BarsCalculated(ind_spreadLR)==Bars(_Symbol,_Period))
{
//--- Get spread value on the current (today) bar
double SpreadValues[];
int copied=CopyBuffer(ind_spreadLR,0,0,1,SpreadValues);
double Spread_curr=SpreadValues[0]; // spread on the current incomplete bar
if(copied!=-1)
{
MqlTick tick;
SymbolInfoTick(symbol1,tick);
double last=tick.last;
double spread_percent=Spread_curr/last*100;
//--- If spread % reached the spread_delta value
if(MathAbs(spread_percent)>=spread_delta)
{
PrintFormat("Spread reached %.1f%% (%G) %s",
spread_percent,TimeToString(TimeCurrent(),TIME_SECONDS),
Spread_curr);
//--- If we have no open positions, enter the market with both symbols
if(PositionsTotal()==0)
DoTrades(Spread_curr,strategy,symbol1,1,symbol2,1);
//--- There are open positions, reverse them
else
ReverseTrades(Spread_curr,positionstype,symbol1,symbol2);
}
//--- Spread is within acceptable range, check the floating profit - isn't it time to close?
else
{
double profit=AccountInfoDouble(ACCOUNT_PROFIT);
double balance=AccountInfoDouble(ACCOUNT_BALANCE);
if(profit/balance*100>=profit_percent)
{
//--- Required floating profit level reached, take it
trade.PositionClose(symbol1);
trade.PositionClose(symbol2);
positionstype=0;
}
}
}
}
}
Positions will also be closed when specified profit percent profit_percent=2 is reached. It is a fixed value this time. Start optimization using the spread_delta parameter in the range of 0.1 to 1%.
"Buying the first asset and selling the seconds one"

"Selling the first asset and buying the seconds one"
This time the first "Buy first and sell the second asset" rule looks much better than the second rule. You can further optimize using other parameters.
MetaTrader 5 — Trading strategy developing environment
In this article, we have considered 4 simple strategies for spread trading. Testing and optimization results produced by these strategies should not be used as a guide to action, because they were obtained in a limited interval and can be random to some extent. The original purpose of this article is to show how easy and convenient it is to test and debug trading ideas using MetaTrader 5.
The MetaTrader 5 tester provides the following convenient features for the developers of automated trading systems:
- automatic download of tick history of all symbols used in the Expert Advisor
- visual indicator and strategy debugging mode, which includes visualization of trades, trading history and Experts journal
- automatic launch of all indicators used in the EA in the visual testing mode
- testing strategies using real recorded history data and reproduction of real trading environment
- multi-threaded optimization of parameters using a custom target function
- use of thousands of testing agents for faster optimization
- visualization of results of optimization in accordance with custom rules
- testing strategies that trade multiple instruments with synchronization of ticks up to a millisecond
- debugging strategies straight during the testing process — you can set breakpoints to check the values of required variables and run a step-by-step testing.
In this article, the Strategy Tester was used as a research tool to find the right direction. This was done as an optimization using one parameter, which allowed to make quick qualitative conclusions. You can add new rules, modify existing ones and run full EA optimization. To speed up calculations, use the MQL5 Cloud Network which is specially designed for the MetaTrader 5 platform.
Important notes on the Strategies
Normally when searching for symbols for spread calculation, price increment is used instead of absolute price values. It means Delta[i]=Close[i]-Close[i-1] is calculated instead of the Close[i] series.
For a balanced trading, you should select volume for each spread symbol. In this article, we only used a 1-lot volume for each symbol.
Current settings in Si and RTS contract specifications are used during testing. It is important to mention that:
- the RTS-12.16 futures is based on the US dollar,
- the price of the RTS-12.16 futures tick is set every day on Moscow Exchange
- the tick value is equal to 0.2 of the indicative USD/RUB exchange rate.
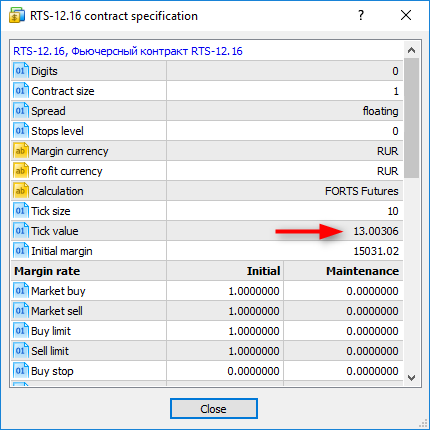
Information on index calculation is available on MOEX site at http://fs.moex.com/files/4856. Therefore, you should remember that the results of optimization in the Strategy Tester depend on the dollar rate at the time of testing. The article contains screenshots with optimization results as of October 25, 2016.
The code is written for execution under perfect performance conditions: it does not contain handling of order sending results, handling of errors connected with connection loss, and it does not take into account commission and slippage.
The futures liquidity and chart filling are improved by the end to contract expiration. The code does not contain an explicit handling of the situation, when quotes of one symbol are received, and whole bars are missed on the second symbol (no trading on the exchange for any reason). However, indicators used in the EA wait for synchronization of bars of both symbols to calculate the spread value, and write these events into journal.
The article does not contain analysis of statistics of spread deviation from average values, which is required for creating more reliable trading rules.
Market Depth analysis is not used, because the order book is not simulated in the MetaTrader 5 Strategy Tester.
Attention: Indicators used in this article dynamically recalculate linear regression coefficients for creating spread charts and the trend line. Therefore, by the end of testing, the appearance of charts and indicator values will differ from those displayed during the testing process.
Run the indicators or EAs attached below in the visual testing mode, to see the process in real time.
Related articles:
- Testing trading strategies on real ticks
- How to quickly develop and debug a trading strategy
- Creating a trading robot for Moscow Exchange. Where to start?
- How to secure yourself and your Expert Advisor while trading on Moscow Exchange
- MQL5 vs QLUA - why trading operations in MQL5 are up to 28 times faster?
- The checks a trading robot must pass before publication in the Market
Programs used in the article:
| # | Name | Type | Description |
|---|---|---|---|
| 1 | CalcShowRegression_script.mq5 | Script | Calculates linear regression coefficients and draws a point chart with a trend line (using the СGraphic class and an Alglib function) |
| 2 | TwoSymbolsSpread_Ind.mql5 | Indicator | The indicator draws a spread histogram on two symbols |
| 3 | SpreadRegression_Ind.mq5 | Indicator | The indicator draws a spread chart and a regression line on it |
| 4 | Strategy1_AngleChange_EA.mq5 | Expert Advisor | Strategy #1. Trading based on the sign change of the A linear regression coefficient in the equation Y=A*X+B. Analysis and entries only at the opening of a new bar |
| 5 | Strategy2_SpreadSignChange_EA.mq5 | Expert Advisor | Strategy #2. Trading based on sign change of the spread value. Analysis and entries only at the opening of a new bar |
| 6 | Strategy3_SpreadSignOnTick_EA.mq5 | Expert Advisor | Strategy #3. Trading based on sign change of the spread value. Analysis and entries within the current bar, the sign change should be stable on the last N ticks |
| 7 | Strategy4_SpreadDeltaPercent_EA.mq5 | Expert Advisor | Strategy #4. Trading based on reaching a certain percent value of spread. Analysis and entries within the current bar on the first received tick |