
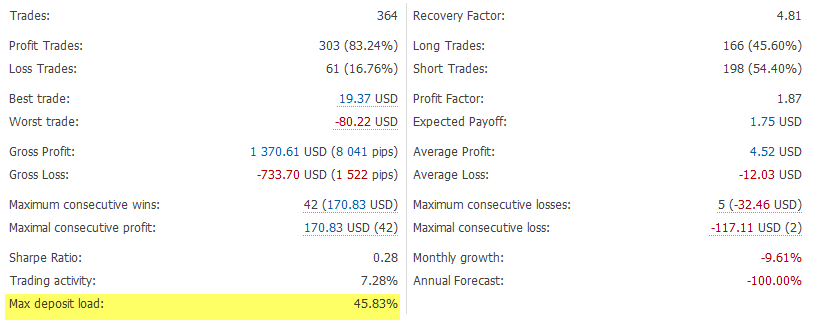
The Easy Way to Evaluate a Signal: Trading Activity, Drawdown/Load and MFE/MAE Distribution Charts

Subscribers often search for an appropriate signal by analyzing the total growth on the signal provider's account, which is not a bad idea. However, it is also important to analyze potential risks of a particular trading strategy. In this article we will show a simple and efficient way to evaluate a Trading Signal based on its performance values:
Trading Activity
Trading on a particular day and hour is determined by the rules of a trading strategy. Long-term strategies may open positions once a week or even less than that, and the position lifetime can be up to weeks or months. The lifetime of scalping positions can be from a few minutes to several hours, and such trades can be performed several times a day.
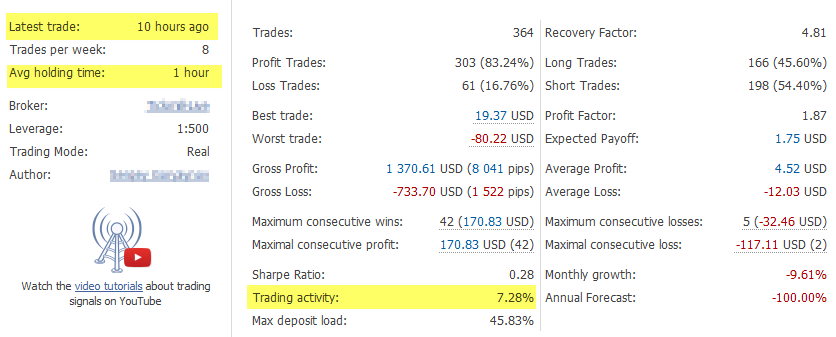
Trading activity is displayed as the percentage of the total time when there were open positions on the account. If this value approaches 100%, it means the account almost always has open positions, and therefore the subscriber's deposit will be constantly exposed to the risk of a sudden loss. For example, remember the recent United Kingdom European Union membership referendum (Brexit), after which the British pound fell sharply for a few minutes, or the decision of the Swiss Central Bank to abandon the franc's exchange rate peg against EUR, after which the Swiss franc soared as much as 30% in less than 20 minutes. Some investors managed to make a profit on these events, but those who guessed the direction wrong suffered huge losses. Thus, an extremely high trading activity can ruin your deposit in case of strong market movements, and this is a substantial risk.
What trading strategies produce high activity? Such strategies include martingale-based systems and grid strategies with averaging techniques, as well as arbitrage on currency baskets, reversal systems, etc. A high trading activity is not always bad, but you should carefully analyze HOW the provider trades. If a strategy targets profit by closing multiple positions of an instrument at the same time, the signal provider might be trying to average wrong market entries. This approach can be efficient for quite a long time, and the signal may show a steady balance increase over months. But finally your account balance my fail to cover a huge drawdown, and trading will be closed in a natural way by a Stop Out.
On the other hand, a very low trading activity (less than 2-5%) indicates that the signal provider enters the market for a very short period of time and immediately exits it while taking profit or loss. It seems to be good tactics at first glance. But there is another risk for a subscriber, since the provider's trades can be missed, or they can be copied with a large slippage. As a result, the signal provider will have a profit, while the subscriber will have a losing trade. Check out the average position holding time and statistics of slippage between the provider's server and your broker. You should be prepared for possible negative results.
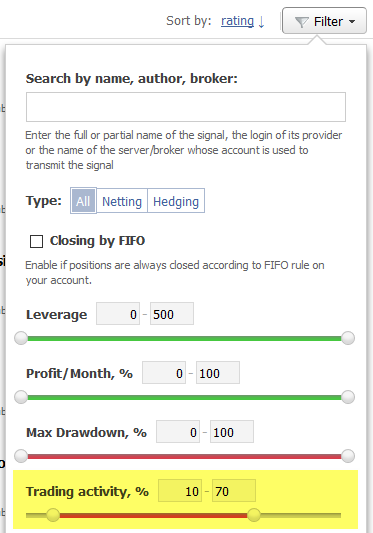
Therefore, try to find a "golden mean" when the provider does not trade too often by opening short-time minor trades, and at the same avoids being all the time in the market. An ideal signal is the one that trades several different financial instruments (applying diversification by symbols), but without additional volume increases or increased position holding time for losing positions. Such strategies may compensate losses on one symbol through winning trades on other instruments. Use the filter in order to see signals with the desired trading activity range.
Drawdown Chart
The account balance and equity values of each signal are monitored since the account registration in the Signals service. The difference between these values is positive, if currently open positions show a floating profit. But if the equity is less than the balance value, it means that the trading account is having a drawdown or unrecorded loss.
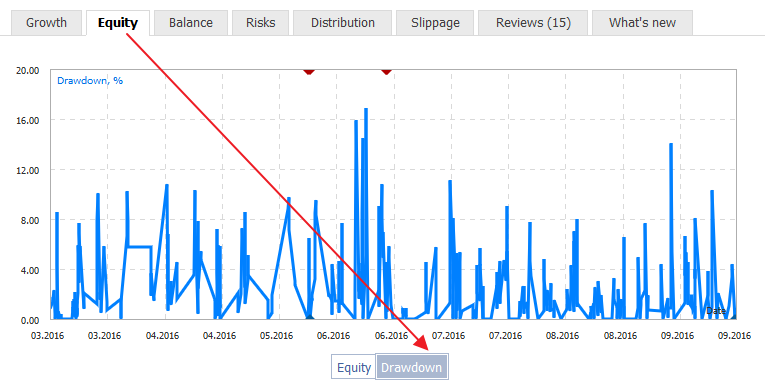
Review the chart of drawdown over the entire signal monitoring period in order to understand what was the risk on the account before a position was closed with a profit.
For example, in this case we see that the profit over the trading account lifetime was 18% to 76% per month, while the floating drawdown reached more than 16% in May. Compare the account drawdown and profit to decide if you are ready to lose 18% (or multiply it by 3, that is 18 * 3 = 54%) of the deposit if the same drawdown happens on the provider's account again.
Deposit Load Chart
The deposit load value shows the percent of account funds used to open positions. Load calculation formula:
Load = Margin / Equity * 100%
If the current account value is 10,000 USD, and the margin of open positions is 5,000 USD, the account load is 50% = 5,000 USD / 10,000 USD * 100%. Larger traded lot values cause larger equity fluctuations on the provider's account in case of market price changes, resulting in a larger load on the trading account. In other words, the higher the load on the account, the higher the risks.
Margin depends on the account leverage, which means that the load on an account with the 1:500 leverage will be 5 times less than that on the account with the 1:100 leverage. But the risk will be the same. So in addition to the load value, you should also pay attention to the provider's account leverage. We recommend you to read the Forex Trading ABC article, which explains the dependence of margin value on the account leverage.
Margin (in the symbol base currency) = Lot value (in the symbol base currency) / Leverage_value
For example, if a provider trades with the 1:500 leverage, and the recorded deposit load reaches 40% or more, a subscriber with the leverage of 1:100 would have a load of over 200% (40%*(1:100/1:500) = 40% * 5). What does it means, what are additional risks for signal subscribers in this case? The subscriber's funds may not be enough to cover a drawdown, and all losing positions may be closed by a Stop Out. Meanwhile, the signal provider can be able hold the position and close it with a zero loss or even with a profit.
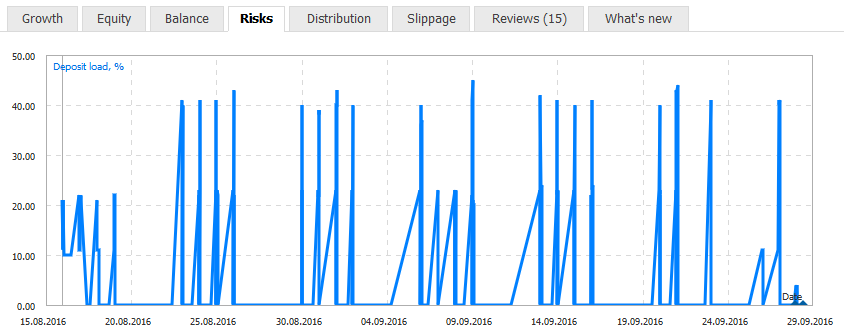
Thus, a high load on a provider's trading account can mean an increased risk for a subscriber and can drain their account. Every signal is provided with the Growth tab, on which you can check the maximum load recorded during the account monitoring time.
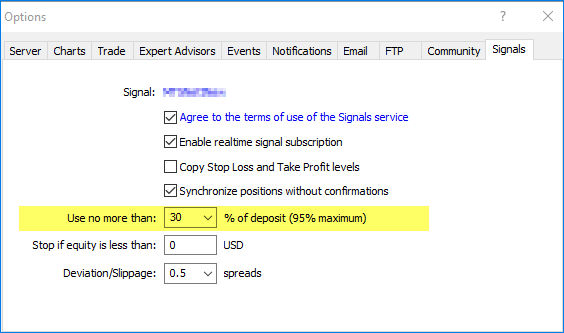
You can reduce the load on the deposit by additionally limiting the traded deposit percentage in your trading terminal: Use no more than % of deposit parameter. This option can protect your account from huge losses, especially in cases where the provider and the subscriber have different amounts of deposit and leverage. For example, a subscriber may choose to limit the percentage of the deposit load to 30%. In this case trade volumes are calculated automatically.
MFE and MAE Distribution
The Risks section features the deposit load chart, and it additionally contains MFE and MAE distribution graphs. These graphs describe the characteristics of every closed position during its lifetime. The detailed explanations of these characteristics are available in the Mathematics in Trading. How to Estimate Trade Results article. Here we only show you how to understand the provider's trading style in 1 second by analyzing these clusters.
Green points in the upper quadrant of the MFE graph mark the trades that had a floating profit larger than the one recorded during position closure. It means that for this position Take Profit was not used in order to lock in profits. Thus, a large number of such green dots in the upper right corner of the MFE graph means that trading is based on the "Let profits run" principle. It is a common attribute of trending strategies.
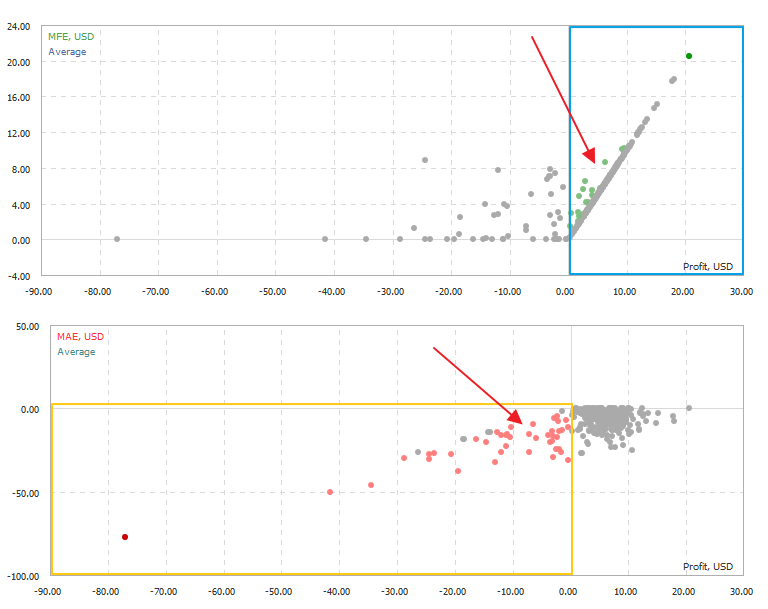
The same applies to the MAE graph – a large percentage of red dots in the lower left corner means that a provider is inclined to "outstay" losses. A graph with a large number of red dots suggests that the provider prefers not use Stop Loss thus breaking the first trading rule "Cut losses, let your profits run".
These distribution graphs help you understand the provider's trading style:
- too many green points on the MFE graph – Take Profit orders are not used, the provider lets the profit run upon a proper market entry;
- too many red points on the MAE graph – Stop Loss orders are not used, the provider does not limit losses in case of an unsuccessful entry;
Quick General Evaluation of a Signal
Based on the four described criteria, you can determine the signal provider's trading style. Low trading activity (<5%) may be problematic for signal copying, and high trading activity exposes the subscriber's account to a constant risk.
Higher drawdown values may be the other side of a stable profitability growth, which can be achieved through longer losing position holding period or by adding volumes in case of wrong market entries.
High deposit load, especially when combined with a high leverage on the provider's account, may also lead to losses on subscribers' accounts with a lower leverage.
MFE and MAE distribution graphs point to the use of Stop Loss and Take Profit orders by the signal provider. We can generally derive the following rule:
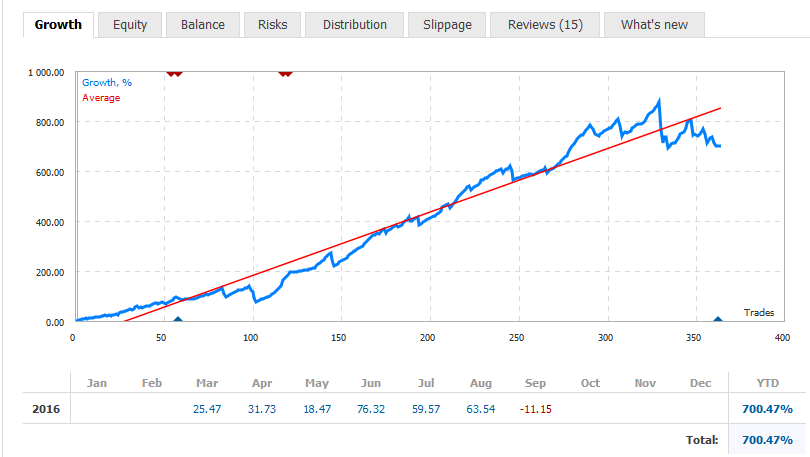
A smooth and even growth chart of a signal is usually accompanied by highly uneven drawdown and load charts.
Every Signal featured in the showcase is provided with extensive statistical information. Be sure to carefully analyze the provided data when choosing a trading strategy to copy.
Related articles:
Translated from Russian by MetaQuotes Ltd.
Original article: https://www.mql5.com/ru/articles/2704


 Working with currency baskets in the Forex market
 Portfolio trading in MetaTrader 4
 Statistical Distributions in MQL5 - taking the best of R and making it faster
 LifeHack for trader: "Quiet" optimization or Plotting trade distributions
- Free trading apps
- Over 8,000 signals for copying
- Economic news for exploring financial markets
You agree to website policy and terms of use