Graphical Interfaces IX: The Progress Bar and Line Chart Controls (Chapter 2)
Anatoli Kazharski | 26 August, 2016
Contents
- Introduction
- Progress bar control
- Line chart control
- Improving classes from Standard Library
- Development of the CLineGraph class
- Write application for testing a line chart
- Conclusion
Introduction
Please read the first article called Graphical interfaces I: Preparation of the library structure (Chapter 1) to get a better understanding of the purpose of this library. A list of chapters with links is provided at the end of the articles of each part. You can also download the latest complete version of the Library from there. Files must be placed under the same directories as they are located in the archive.
In the previous article we have considered two interconnected elements of control: color picker and color button. The second chapter will be dedicated to progress bar and line chart controls of the interface. As always, there will be detailed examples provided to reveal how these controls can be used in custom MQL applications.
Progress bar control
While performing a lengthy process, an interface control is required to show users at what stage of performance it currently is, and also the approximate remaining time until it is finished. This is normally achieved with a progress bar control of the graphical interface. The simplest implementation of this control implies two rectangles: one of them displays an overall length of the displayed process, the second one - a completed fraction of this process. A percentage can be frequently observed in different implementations of the progress bar, and that adds additional informativeness to this control.
Let's list all the components used for creating a progress bar in the developed Library.
- Background
- Description
- Indicator scrollbar
- Indicator background
- Percentage
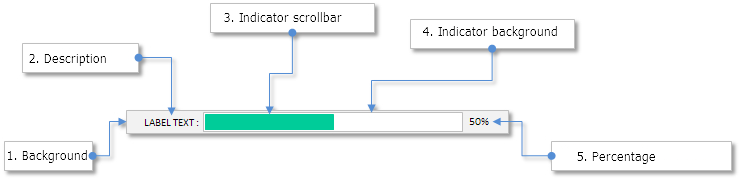
Fig. 1. Components of the progress bar control.
Let's have a closer look at the class used for creating this control.
Developing CProgressBar class
We create the ProgressBar.mqh file with the CProgressBar class with methods that are standard for all controls, and include it to the Library engine (the WndContainer.mqh file). Below is a list of controls that are available for configuration.
- Color of common background of control
- Description text
- Color of description text
- Offset of description by two axes (x, y)
- Color of area and border of total area of indicator
- Background size of indicator area
- Width border of indicator area
- Color of indicator scrollbar
- Label offset of percentage of performed process
- Number of decimal places for percentage
class CProgressBar : public CElement
  {
private:
   //--- Area color of control
   color             m_area_color;
   //--- Text of displayed process
   string            m_label_text;
   //--- Text color
   color             m_label_color;
   //--- Text label offset by two axes
   int               m_label_x_offset;
   int               m_label_y_offset;
   //--- Area colors of progress bar and area border
   color             m_bar_area_color;
   color             m_bar_border_color;
   //--- Sizes of progress bar
   int               m_bar_x_size;
   int               m_bar_y_size;
   //--- Progress bar offset by two axes
   int               m_bar_x_offset;
   int               m_bar_y_offset;
   //--- Border width of progress bar
   int               m_bar_border_width;
   //--- Indicator color
   color             m_indicator_color;
   //--- Label offset of percentage
   int               m_percent_x_offset;
   int               m_percent_y_offset;
   //--- Number of decimal places
   int               m_digits;
   //---
public:
   //--- Number of decimal places
   void              SetDigits(const int digits)        { m_digits=::fabs(digits);         }
   //--- (1) Area color, (2) label text and (3) label color
   void              AreaColor(const color clr)         { m_area_color=clr;                }
   void              LabelText(const string text)       { m_label_text=text;               }
   void              LabelColor(const color clr)        { m_label_color=clr;               }
   //--- Text label offset (label text)
   void              LabelXOffset(const int x_offset)   { m_label_x_offset=x_offset;       }
   void              LabelYOffset(const int y_offset)   { m_label_y_offset=y_offset;       }
   //--- (1) Area color and (2) borders of progress bar, (3) indicator color
   void              BarAreaColor(const color clr)      { m_bar_area_color=clr;            }
   void              BarBorderColor(const color clr)    { m_bar_border_color=clr;          }
   void              IndicatorColor(const color clr)    { m_indicator_color=clr;           }
   //--- (1) Border width, (2) sizes of indicator area
   void              BarBorderWidth(const int width)    { m_bar_border_width=width;        }
   void              BarXSize(const int x_size)         { m_bar_x_size=x_size;             }
   void              BarYSize(const int y_size)         { m_bar_y_size=y_size;             }
   //--- (1) Offset of progress bar by two axes, (2) offset of percentage label
   void              BarXOffset(const int x_offset)     { m_bar_x_offset=x_offset;         }
   void              BarYOffset(const int y_offset)     { m_bar_y_offset=y_offset;         }
   //--- Text label offset (percent of process)
   void              PercentXOffset(const int x_offset) { m_percent_x_offset=x_offset;     }
   void              PercentYOffset(const int y_offset) { m_percent_y_offset=y_offset;     }
  };
To create the progress bar control, we are going to use five private methods and one public method:
class CProgressBar : public CElement
  {
private:
   //--- Objects for creating control
   CRectLabel        m_area;
   CLabel            m_label;
   CRectLabel        m_bar_bg;
   CRectLabel        m_indicator;
   CLabel            m_percent;
   //---
public:
   //--- Methods for creating control
   bool              CreateProgressBar(const long chart_id,const int subwin,const int x,const int y);
   //---
private:
   bool              CreateArea(void);
   bool              CreateLabel(void);
   bool              CreateBarArea(void);
   bool              CreateIndicator(void);
   bool              CreatePercent(void);
  };
In order for the progress bar to operate as expected, we need to indicate a total number of steps (iterations) of the process that the indicator is connected to and a current index of iteration. We are going to need two auxiliary methods CProgressBar::StepsTotal() and CProgressBar::CurrentIndex(). They are required for private use. Only one argument is sent to both methods, and its value may be corrected in order to avoid the exit from the valid range.
class CProgressBar : public CElement
  {
private:
   //--- Total number of steps
   double            m_steps_total;
   //--- Current indicator's position
   double            m_current_index;
   //---
private:
   //--- Setting new values for indicator
   void              CurrentIndex(const int index);
   void              StepsTotal(const int total);
  };
//+------------------------------------------------------------------+
//| Total number of steps of the progress bar                               |
//+------------------------------------------------------------------+
void CProgressBar::StepsTotal(const int total)
  {
//--- Correct if below 0
   m_steps_total=(total<1)? 1 : total;
//--- Correct index if exit out of range
   if(m_current_index>m_steps_total)
      m_current_index=m_steps_total;
  }
//+------------------------------------------------------------------+
//| Current state of indicator                                       |
//+------------------------------------------------------------------+
void CProgressBar::CurrentIndex(const int index)
  {
//--- Correct if below 0
   if(index<0)
      m_current_index=1;
//--- Correct index if exit out of range
   else
      m_current_index=(index>m_steps_total)? m_steps_total : index;
  }
The CProgressBar::StepsTotal() and CProgressBar::CurrentIndex() methods are called in the main method to interact with the control from the outside — CProgressBar::Update(). Parameters for the progress bar that are used to perform necessary calculations and redraw it, are sent to this method. The first argument here is the process iteration index (index), and the second — a total number of iterations (total). After all these values have been checked, a new width for indicator scrollbar is calculated. This value can be amended afterwards, if necessary. Further, (1) a new width is set for the indicator scrollbar, (2) percentage value is calculated and its string is formed, and in the end of the method (3) a new value is set for the text label of percentage.
class CProgressBar : public CElement
  {
public:
   //--- Update indicator by specified values
   void              Update(const int index,const int total);
  };
//+------------------------------------------------------------------+
//| Update the progress bar                                          |
//+------------------------------------------------------------------+
void CProgressBar::Update(const int index,const int total)
  {
//--- Set new index
   CurrentIndex(index);
//--- Set new range
   StepsTotal(total);
//--- Calculate indicator width
   double new_width=(m_current_index/m_steps_total)*m_bar_bg.XSize();
//--- Correct if below 1
   if((int)new_width<1)
      new_width=1;
   else
     {
      //--- Correct with consideration of border width
      int x_size=m_bar_bg.XSize()-(m_bar_border_width*2);
      //--- Correct if exit beyond the border
      if((int)new_width>=x_size)
         new_width=x_size;
     }
//--- Set new width for indicator
   m_indicator.X_Size((int)new_width);
//--- Calculate percent and form a string
   double percent =m_current_index/m_steps_total*100;
   string desc    =::DoubleToString((percent>100)? 100 : percent,m_digits)+"%";
//--- Set new value
   m_percent.Description(desc);
  }
All methods for creating and managing the progress bar are ready. Now, we will test it and see how it looks as a graphical interface of MQL application.
Testing progress bar
The Expert Advisor from the previous article can be taken for testing and used as a template. We will delete everything from it apart from the main menu and the status string. Eight progress bars will be added to the graphical interface of this Expert Advisor. To make this task more interesting, we use a slider to manage the number of iterations.
In the body of the CProgram custom class we declare instances of necessary types of controls and methods for their creation with offsets from the extreme point of the form:
class CProgram : public CWndEvents
  {
private:
   //--- Sliders
   CSlider           m_slider1;
   //--- Progress bars
   CProgressBar      m_progress_bar1;
   CProgressBar      m_progress_bar2;
   CProgressBar      m_progress_bar3;
   CProgressBar      m_progress_bar4;
   CProgressBar      m_progress_bar5;
   CProgressBar      m_progress_bar6;
   CProgressBar      m_progress_bar7;
   CProgressBar      m_progress_bar8;
   //---
private:
   //--- Sliders
#define SLIDER1_GAP_X         (7)
#define SLIDER1_GAP_Y         (50)
   bool              CreateSlider1(const string text);
//---
#define PROGRESSBAR1_GAP_X    (7)
#define PROGRESSBAR1_GAP_Y    (100)
   bool              CreateProgressBar1(void);
//---
#define PROGRESSBAR2_GAP_X    (7)
#define PROGRESSBAR2_GAP_Y    (125)
   bool              CreateProgressBar2(void);
//---
#define PROGRESSBAR3_GAP_X    (7)
#define PROGRESSBAR3_GAP_Y    (150)
   bool              CreateProgressBar3(void);
//---
#define PROGRESSBAR4_GAP_X    (7)
#define PROGRESSBAR4_GAP_Y    (175)
   bool              CreateProgressBar4(void);
//---
#define PROGRESSBAR5_GAP_X    (7)
#define PROGRESSBAR5_GAP_Y    (200)
   bool              CreateProgressBar5(void);
//---
#define PROGRESSBAR6_GAP_X    (7)
#define PROGRESSBAR6_GAP_Y    (225)
   bool              CreateProgressBar6(void);
//---
#define PROGRESSBAR7_GAP_X    (7)
#define PROGRESSBAR7_GAP_Y    (250)
   bool              CreateProgressBar7(void);
//---
#define PROGRESSBAR8_GAP_X    (7)
#define PROGRESSBAR8_GAP_Y    (275)
   bool              CreateProgressBar8(void);
  };
Creation of all controls has been already considered in the previous articles, therefore, we can provide a method code for only one progress bar as an example (see the code listing below). As we can see, it doesn't have anything that could have caused any problems with understanding. Everything is fairly transparent and simple.
//+------------------------------------------------------------------+
//| Progress bar 1 is created                                        |
//+------------------------------------------------------------------+
bool CProgram::CreateProgressBar1(void)
  {
//--- Save pointer to the form
   m_progress_bar1.WindowPointer(m_window1);
//--- Coordinates
   int x=m_window1.X()+PROGRESSBAR1_GAP_X;
   int y=m_window1.Y()+PROGRESSBAR1_GAP_Y;
//--- Set properties before creation
   m_progress_bar1.XSize(220);
   m_progress_bar1.YSize(15);
   m_progress_bar1.BarXSize(123);
   m_progress_bar1.BarYSize(11);
   m_progress_bar1.BarXOffset(65);
   m_progress_bar1.BarYOffset(2);
   m_progress_bar1.LabelText("Progress 01:");
//--- Create control
   if(!m_progress_bar1.CreateProgressBar(m_chart_id,m_subwin,x,y))
      return(false);
//--- Add pointer to control in the base
   CWndContainer::AddToElementsArray(0,m_progress_bar1);
   return(true);
  }
Calling methods needs to be performed in the main method of creating a graphical interface. The below listing shows a shortened version of this method only with what has to be added to it:
//+------------------------------------------------------------------+
//| Create expert panel                                              |
//+------------------------------------------------------------------+
bool CProgram::CreateExpertPanel(void)
  {
//--- Create form for elements of control
//--- Creating controls:
//    Main menu
//--- Context menu

//--- Sliders
   if(!CreateSlider1("Iterations total:"))
      return(false);
//--- Progress bars
   if(!CreateProgressBar1())
      return(false);
   if(!CreateProgressBar2())
      return(false);
   if(!CreateProgressBar3())
      return(false);
   if(!CreateProgressBar4())
      return(false);
   if(!CreateProgressBar5())
      return(false);
   if(!CreateProgressBar6())
      return(false);
   if(!CreateProgressBar7())
      return(false);
   if(!CreateProgressBar8())
      return(false);

//--- Redrawing the chart
   m_chart.Redraw();
   return(true);
  }
Now, let's talk about how it will operate. We imitate the process for all progress bars in the timer of the custom class CProgram::OnTimerEvent(). The number of iterations can be controlled manually with a slider, and on every timer event there is an option to obtain current value in its Edit box. For each progress bar there is a static counter whose value we will increase with different values of growth. This way we will imitate that progress bars work in various processes asynchronously.
//+------------------------------------------------------------------+
//| Timer                                                            |
//+------------------------------------------------------------------+
void CProgram::OnTimerEvent(void)
  {
   CWndEvents::OnTimerEvent();
//--- Number of iterations
   int total=(int)m_slider1.GetValue();
//--- Eight progress bars
   static int count1=0;
   count1=(count1>=total) ? 0 : count1+=8;
   m_progress_bar1.Update(count1,total);
//---
   static int count2=0;
   count2=(count2>=total) ? 0 : count2+=3;
   m_progress_bar2.Update(count2,total);
//---
   static int count3=0;
   count3=(count3>=total) ? 0 : count3+=12;
   m_progress_bar3.Update(count3,total);
//---
   static int count4=0;
   count4=(count4>=total) ? 0 : count4+=6;
   m_progress_bar4.Update(count4,total);
//---
   static int count5=0;
   count5=(count5>=total) ? 0 : count5+=18;
   m_progress_bar5.Update(count5,total);
//---
   static int count6=0;
   count6=(count6>=total) ? 0 : count6+=10;
   m_progress_bar6.Update(count6,total);
//---
   static int count7=0;
   count7=(count7>=total) ? 0 : count7+=1;
   m_progress_bar7.Update(count7,total);
//---
   static int count8=0;
   count8=(count8>=total) ? 0 : count8+=15;
   m_progress_bar8.Update(count8,total);

//--- Timer for status bar
   static int count9=0;
   if(count9<TIMER_STEP_MSC*10)
     {
      count9+=TIMER_STEP_MSC;
      return;
     }
   count9=0;
   m_status_bar.ValueToItem(1,::TimeToString(::TimeLocal(),TIME_DATE|TIME_SECONDS));
  }
We compile the program and upload it to the chart. The result is the following:

Fig. 2. Test the progress bar control.
Not too bad! Below, in the test application for the line chart, we will test the progress bar with a more specific example.
Line chart control
Line chart allows to visualize data arrays in the designated rectangular area with vertical and horizontal scale where points are subsequently interconnected with a line. It is difficult to underestimate the benefit of such tool. For example, a chart where balance and equity of the trader's account can be displayed. In my opinion, a standard type of programs of the MetaTrader terminal such as indicator, is not very convenient as it doesn't allow to display the entire data array only in the visible part of the window.
Terminal charts can have a scale set only from 0 (the strongest level of compression) to 5. The strongest level of compression implies that one pixel is selected for one control of array, and if the entire array of data doesn't fit in the selected area, there is an option to use a scrollbar of the chart. The second way to fit more data is to move to the higher time frame, and if Candles or Bars chart is set, then, at least, we can see a full range value over the specified period.
It would be convenient to have no restrictions for the chart scale, and the array with data of any size could fit in the area with width that is more than one pixel wide. At the same time it is required that data is always positioned precisely from the beginning of the area until the end. I.e. the first point of data (array control) must be magnetized to the left edge of the area, and the last point - to the right. For example, charts in Excel are made as such. This way you can fit any size array on the line chart without loss of minimums and maximums.
As an example, a screenshot below provides an example of a line chart from Excel, where an array of 50000 controls managed to fit without any losses (minimums and maximums).

Fig. 3. Line chart in Excel. Size of data array - 50000 controls.
Terminal developers have provided classes for creating several types of charts in the Standard Library. Their location in the directory is: <data folder>\MQLX\Include\Canvas\Charts. We list these classes in the below list:
- CChartCanvas – base class for creating one out of three provided types of charts.
- CLineChart – derived class from CChartCanvas for creating linear chart.
- CHistogramChart – derived class from CChartCanvas for creating a histogram.
- CPieChart – derived class from CChartCanvas for creating a circle diagram.
As a temporary solution, so that charts could be already used in graphical interfaces of MQL applications, we will apply what is currently being offered by the Standard Library. Some methods in these classes will be changed, and some of them will be completely replaced. We will also add additional options. Eventually, in the process of writing future articles, we will try to create an additional Library for drawing higher quality charts.
Improving classes from Standard Library
As mentioned above, files with the required classes are located in the following directory: <data folder>\MQLX\Include\Canvas\Charts. Let's create the Charts folder in the directory of the developed library (<data folder>\MQLX\Include\EasyAndFastGUI\Canvas)and copy there ChartCanvas.mqh and LineChart.mqh files from the Standard Library.
First, we make changes to the base class CChartCanvas. At the moment its base class is CCanvas. Earlier, a copy of the CCanvas class from the Standard Library was adapted to the developed Library and renamed to CCustomCanvas. Now it needs to become a base class for CChartCanvas. In the code listing below it shows the strings where changes were made in the ChartCanvas.mqh file.
//+------------------------------------------------------------------+
//|                                                  ChartCanvas.mqh |
//|                   Copyright 2009-2016, MetaQuotes Software Corp. |
//|                                              http://www.mql5.com |
//+------------------------------------------------------------------+
#include "..\CustomCanvas.mqh"
...
//+------------------------------------------------------------------+
//| Class CChartCanvas                                               |
//| Usage: base class for graphical charts                           |
//+------------------------------------------------------------------+
class CChartCanvas : public CCustomCanvas
  {
...
It is preferable to have a gradient background for the charts, so we are going to add this option. In order to implement this, we connect the file with the class that works with color (CColors) to the CustomCanvas.mqh file:
//+------------------------------------------------------------------+
//|                                                 CustomCanvas.mqh |
//|                        Copyright 2015, MetaQuotes Software Corp. |
//|                                              http://www.mql5.com |
//+------------------------------------------------------------------+
#include "..\Colors.mqh"
...
In the CChartCanvas class we can declare the instance of this class and use it in the project.
At this stage of development, considering that Standard Library has to be written from scratch, there is no point to provide a detailed description of the class methods that we are going to use. We will briefly indicate methods where changes were made, and what methods were added, so you could make comparisons on your own, if such necessity arises.
Let's proceed to enumeration. At least two colors are required to make a gradient area. In the CChartCanvas class there is a method already for indicating the background color — CChartCanvas::ColorBackground(). Similar method CChartCanvas::ColorBackground2() is added for setting the second color. A special method for initializing the array with gradient colors, the same as in the CElements class – the InitColorArray() method. To draw a gradient, the CChartCanvas::DrawBackground() method needs to be changed. If previously it was sufficient to fill the background with one color by simply calling CCustomCanvas::Erase() and send there a required color as an argument, now, however, (1) it is required to declare array and set the size to canvas height, (2) initialize it with colors of the gradient, (3) draw each line in the loop by using colors from this array. To zero arrays and to delete objects, another method CChartCanvas::DeleteAll() needs to be added to the class.
All other changes in the CChartCanvas class have affected the methods where offsets, font, size of markers in description of series and grid style are calculated and set. The code of these additions and changes you can study in files attached to the article, by comparing them with the initial version from the Standard Library.
Further, we will consider the changes that affected the CLineChart class. CChartCanvas is a base class for it. A method for destroying objects — CLineChart::DeleteAll() also needs to be created here. Main changes involved drawing data on the chart with the CLineChart::DrawData() method. First, three auxiliary methods CLineChart::CheckLimitWhile(), CLineChart::CalculateVariables() and CLineChart::CalculateArray() where calculations are performed have been added for it. And, most importantly, the compression algorithm of data displayed on the chart is corrected. In the suggested option, the compression is performed so that when the width of array of displayed pixels exceeds the width of selected area of the chart, this array is divided into the number of parts that equals the number of pixels that extend beyond the right edge of the chart. Then, every part (apart from the first) overlaps with the previous one. This way, the offset beyond the right edge is reduced, the right control of array is always magnetized to the right side, and there is no visual loss of data regarding minimums and maximums.
Now we need to create the class for creating the line chart control that is similar to classes of all the remaining controls of the Library that have been considered in the previous related articles.
Development of the CLineGraph class
First of all, a new object type needs to be created in the Objects.mqh file. It will be the CLineChartObject class that is similar to all classes in this file. CLineChart will be a base class, and its file needs to be connected to the Objects.mqh file:
//+------------------------------------------------------------------+
//|                                                      Objects.mqh |
//|                        Copyright 2015, MetaQuotes Software Corp. |
//|                                              http://www.mql5.com |
//+------------------------------------------------------------------+
#include "..\Canvas\Charts\LineChart.mqh"
...
We will create the LineGraph.mqh file with the CLineGraph class and connect it to the library engine (WndContainer.mqh). The CLineGraph class needs to have standard virtual methods, the same as the rest of the Library controls:
//+------------------------------------------------------------------+
//| Class for creating a line chart                                  |
//+------------------------------------------------------------------+
class CLineGraph : public CElement
  {
private:
   //--- Pointer to the form that the control is attached to.
   CWindow          *m_wnd;
public:
   //--- Store form pointer
   void              WindowPointer(CWindow &object)    { m_wnd=::GetPointer(object);  }
   //---
public:
   //--- Handler of chart events
   virtual void      OnEvent(const int id,const long &lparam,const double &dparam,const string &sparam) {}
   //--- Timer
   virtual void      OnEventTimer(void) {}
   //--- Moving the control
   virtual void      Moving(const int x,const int y);
   //--- (1) Show, (2) hide, (3) reset, (4) delete
   virtual void      Show(void);
   virtual void      Hide(void);
   virtual void      Reset(void);
   virtual void      Delete(void);
  };
We will list properties that will be available for setting the external appearance of the line chart.
- Colors of background gradient
- Border color
- Grid color
- Text color
- Number of decimal places (for values on vertical scale)
class CLineGraph : public CElement
  {
private:
   //--- Gradient color
   color             m_bg_color;
   color             m_bg_color2;
   //--- Border Color
   color             m_border_color;
   //--- Grid color
   color             m_grid_color;
   //--- Text color
   color             m_text_color;
   //--- Number of decimal places
   int               m_digits;
   //---
public:
   //--- Number of decimal places
   void              SetDigits(const int digits)       { m_digits=::fabs(digits);     }
   //--- Two colors for gradient
   void              BackgroundColor(const color clr)  { m_bg_color=clr;              }
   void              BackgroundColor2(const color clr) { m_bg_color2=clr;             }
   //--- Colors of (1) border, (2) grid and (3) text
   void              BorderColor(const color clr)      { m_border_color=clr;          }
   void              GridColor(const color clr)        { m_grid_color=clr;            }
   void              TextColor(const color clr)        { m_text_color=clr;            }
  };
To create a line chart, one private and one public methods are required:
class CLineGraph : public CElement
  {
public:
   //--- Methods for creating control
   bool              CreateLineGraph(const long chart_id,const int subwin,const int x,const int y);
   //---
private:
   bool              CreateGraph(void);
  };
And, finally, in order to work with the line chart after it was created, we will use methods that will allow to:
- set maximum number of series on the chart;
- set maximum/minimum for vertical scale and the amount of lines of the grid;
- add data series;
- refresh data series;
- delete data series.
class CLineGraph : public CElement
  {
public:
   //--- Maximum data series
   void              MaxData(const int total)          { m_line_chart.MaxData(total); }
   //--- Setting parameters of vertical scale
   void              VScaleParams(const double max,const double min,const int num_grid);
   //--- Adding series to the chart
   void              SeriesAdd(double &data[],const string descr,const color clr);
   //--- Update series on the chart
   void              SeriesUpdate(const uint pos,const double &data[],const string descr,const color clr);
   //--- Delete series from the chart
   void              SeriesDelete(const uint pos);
  };
This minimal set is sufficient to use line chart in MQL applications. Then, we will create an application that allows to test how it all operates.
Write application for testing a line chart
For testing we can make a copy of EA that has been already used in this article for testing the progress bar control. We will delete all controls from it, apart from the status bar. We determine which controls for managing line chart need to be created in the graphical interface.
We implement the mode where adding and reducing data in arrays of series will be automatically performed. This process will be controlled in the timer of the CProgram user class. Let's ensure that the speed of this process is also controlled by indicating in the Edit box a delay in milliseconds (Delay parameter). Two additional controls will be introduced for this mode, and in their Edit box you can indicate a range, i.e. minimum (Min. limit size parameter) and maximum (Max. limit size parameter) number of controls in arrays. By enabling this mode, arrays on every event of the timer will be increased by one control until the specified maximum size, and afterwards will be reduced until they reach the minimum specified size, which is then repeated from the beginning. Current size of arrays (Size of series parameter) that can be also manually managed, will be displayed in the Edit box of the separate control.
Number of series (data series) can be configured by selecting from the drop down list from 1 to 24 (Number of series parameters). Data will be calculated with a trigonometric formula based on returned values of mathematical functions of sine and cosine. We will add controls that will allow to manage parameters that participate in calculations. Here it will be (1) increment ratio (Increment ratio parameter) and (2) offset of each series regarding the previous data series (the Offset series parameter). By changing the increment ratio we can obtain various visualization of series. The Increment ratio parameter will have a check box used to run the automatic switch to the next value as soon as the loop of increase/decrease of the size of series, if this mode is enabled. The ratio increase here will also be performed until we reach the maximum restriction in the control. As soon as the restriction is achieved, a counter will be turned to reducing values of the Increment ratio parameter. In other words, counter will be reversed after achieving minimum or maximum restrictions.
In order to make this experiment even more interesting, we implement the mode that would allow to make the animation of "running" series and also add additional parameter that controls the Run speed. Furthermore, we add the progress bar to the graphical interface, and it will show the remaining time of this process, if the mode of adding and reducing data into series of arrays automatically is enabled.
So, we declare instances of classes of controls that are necessary for creating the graphical interface of the program and also methods used to create them and offsets from the extreme point of the form:
class CProgram : public CWndEvents
  {
private:
   //--- Controls
   CSpinEdit         m_delay_ms;
   CComboBox         m_series_total;
   CCheckBoxEdit     m_increment_ratio;
   CSpinEdit         m_offset_series;
   CSpinEdit         m_min_limit_size;
   CCheckBoxEdit     m_max_limit_size;
   CCheckBoxEdit     m_run_speed;
   CSpinEdit         m_series_size;
   CLineGraph        m_line_chart;
   CProgressBar      m_progress_bar;
   //---
private:
   //--- Controls for managing the line chart
#define SPINEDIT1_GAP_X       (7)
#define SPINEDIT1_GAP_Y       (25)
   bool              CreateSpinEditDelay(const string text);
#define COMBOBOX1_GAP_X       (7)
#define COMBOBOX1_GAP_Y       (50)
   bool              CreateComboBoxSeriesTotal(const string text);
#define CHECKBOX_EDIT1_GAP_X  (161)
#define CHECKBOX_EDIT1_GAP_Y  (25)
   bool              CreateCheckBoxEditIncrementRatio(const string text);
#define SPINEDIT2_GAP_X       (161)
#define SPINEDIT2_GAP_Y       (50)
   bool              CreateSpinEditOffsetSeries(const string text);
#define SPINEDIT3_GAP_X       (330)
#define SPINEDIT3_GAP_Y       (25)
   bool              CreateSpinEditMinLimitSize(const string text);
#define CHECKBOX_EDIT2_GAP_X  (330)
#define CHECKBOX_EDIT2_GAP_Y  (50)
   bool              CreateCheckBoxEditMaxLimitSize(const string text);
#define CHECKBOX_EDIT3_GAP_X  (501)
#define CHECKBOX_EDIT3_GAP_Y  (25)
   bool              CreateCheckBoxEditRunSpeed(const string text);
#define SPINEDIT4_GAP_X       (501)
#define SPINEDIT4_GAP_Y       (50)
   bool              CreateSpinEditSeriesSize(const string text);
   //--- Line chart
#define LINECHART1_GAP_X      (5)
#define LINECHART1_GAP_Y      (75)
   bool              CreateLineChart(void);
   //--- Indicator of performance
#define PROGRESSBAR1_GAP_X    (5)
#define PROGRESSBAR1_GAP_Y    (364)
   bool              CreateProgressBar(void);
  };
All methods for creating controls in the custom class have been already considered in previous articles. The code of the method will be shown here for creating a line chart. But before that we need to create a method for working with arrays and calculating data for them. We declare the Series structure with the array for displayed data[] and for additional array data_temp[] for preliminary calculations. Arrays where colors and descriptions of series are also required.
class CProgram : public CWndEvents
  {
private:
   //--- Structure of series on the chart
   struct Series
     {
      double            data[];      // array of displayed data
      double            data_temp[]; // additional array for calculations
     };
   Series            m_series[];

   //--- (1) Names and (2) colors of series
   string            m_series_name[];
   color             m_series_color[];
  };
The CProgram::ResizeDataArrays() method will be used to set a new size of arrays. Current number of series and their size is obtained from controls:
class CProgram : public CWndEvents
  {
private:
   //--- Set a new size of series
   void              ResizeDataArrays(void);
  };
//+------------------------------------------------------------------+
//| Set a new size of arrays                                         |
//+------------------------------------------------------------------+
void CProgram::ResizeDataArrays(void)
  {
   int total          =(int)m_series_total.ButtonText();
   int size_of_series =(int)m_series_size.GetValue();
//---
   for(int s=0; s<total; s++)
     {
      //--- Set a new size of arrays
      ::ArrayResize(m_series[s].data,size_of_series);
      ::ArrayResize(m_series[s].data_temp,size_of_series);
     }
  }
After setting the size, the array used for calculations should be initialized with new data. We will apply the CProgram::InitArrays() method for this purpose. For preliminary calculations parameters from Offset series and Increment ratio will be used. For the "running" series mode, the m_run_speed_counter counter will be required. When calling the CProgram::ShiftLineChartSeries() method in the timer, it will be increased by value from the Edit box of the Run Speed control, if the check box of this control is enabled.
class CProgram : public CWndEvents
  {
private:
   //--- Speed counter of "running" series
   double            m_run_speed_counter;

   //--- Initialization of auxiliary arrays for calculations
   void              InitArrays(void);

   //--- Shifting series of line chart ("running" chart)
   void              ShiftLineChartSeries(void);
  };
//+------------------------------------------------------------------+
//| Constructor                                                      |
//+------------------------------------------------------------------+
CProgram::CProgram(void) : m_run_speed_counter(0.0)
  {
//--- ...
  }
//+------------------------------------------------------------------+
//| Shifting series of line chart                                    |
//+------------------------------------------------------------------+
void CProgram::ShiftLineChartSeries(void)
  {
   if(m_run_speed.CheckButtonState())
      m_run_speed_counter+=m_run_speed.GetValue();
  }
//+------------------------------------------------------------------+
//| Initialization of auxiliary arrays for calculations              |
//+------------------------------------------------------------------+
void CProgram::InitArrays(void)
  {
   int total=(int)m_series_total.ButtonText();
//---
   for(int s=0; s<total; s++)
     {
      int size_of_series=::ArraySize(m_series[s].data_temp);
      //---
      for(int i=0; i<size_of_series; i++)
        {
         if(i==0)
           {
            if(s>0)
               m_series[s].data_temp[i]=m_series[s-1].data_temp[i]+m_offset_series.GetValue();
            else
               m_series[s].data_temp[i]=m_run_speed_counter;
           }
         else
            m_series[s].data_temp[i]=m_series[s].data_temp[i-1]+(int)m_increment_ratio.GetValue();
        }
     }
  }
For example, we make a calculation of series based on three formulas that can be selected in external parameters of the Expert Advisor. The ENUM_FORMULA enumeration is declared for this purpose. Setting parameters of colors of series is moved to external parameters (see. the code listing below).
//--- Enumeration of functions
enum ENUM_FORMULA
  {
   FORMULA_1=0, // Formula 1
   FORMULA_2=1, // Formula 2
   FORMULA_3=2  // Formula 3
  };
//--- External parameters
input ENUM_FORMULA Formula        =FORMULA_1;       // Formula
input color        ColorSeries_01 =clrRed;          // Color series 01
input color        ColorSeries_02 =clrDodgerBlue;   // Color series 02
input color        ColorSeries_03 =clrWhite;        // Color series 03
input color        ColorSeries_04 =clrYellow;       // Color series 04
input color        ColorSeries_05 =clrMediumPurple; // Color series 05
input color        ColorSeries_06 =clrMagenta;      // Color series 06
Setting the initial size of arrays of series, and also initializing arrays of descriptions and color of series are performed in the constructor of the CProgram class:
//+------------------------------------------------------------------+
//| Constructor                                                      |
//+------------------------------------------------------------------+
CProgram::CProgram(void) : m_run_speed_counter(0.0)
  {
//--- Setting the size of arrays of series
   int number_of_series=24;
   ::ArrayResize(m_series,number_of_series);
   ::ArrayResize(m_series_name,number_of_series);
   ::ArrayResize(m_series_color,number_of_series);
//--- Initialization of array of series names
   for(int i=0; i<number_of_series; i++)
      m_series_name[i]="Series "+string(i+1);
//--- Initialization of arrays of series color
   m_series_color[0] =m_series_color[6]  =m_series_color[12] =m_series_color[18] =ColorSeries_01;
   m_series_color[1] =m_series_color[7]  =m_series_color[13] =m_series_color[19] =ColorSeries_02;
   m_series_color[2] =m_series_color[8]  =m_series_color[14] =m_series_color[20] =ColorSeries_03;
   m_series_color[3] =m_series_color[9]  =m_series_color[15] =m_series_color[21] =ColorSeries_04;
   m_series_color[4] =m_series_color[10] =m_series_color[16] =m_series_color[22] =ColorSeries_05;
   m_series_color[5] =m_series_color[11] =m_series_color[17] =m_series_color[23] =ColorSeries_06;
  }
To calculate series based on formula indicated in external parameters, we apply the CProgram::CalculateSeries() method:
class CProgram : public CWndEvents
  {
private:
   //--- Calculate series
   void              CalculateSeries(void);
  };
//+------------------------------------------------------------------+
//| Calculate series                                                 |
//+------------------------------------------------------------------+
void CProgram::CalculateSeries(void)
  {
   int total=(int)m_series_total.ButtonText();
//---
   for(int s=0; s<total; s++)
     {
      int size_of_series=::ArraySize(m_series[s].data_temp);
      //---
      for(int i=0; i<size_of_series; i++)
        {
         m_series[s].data_temp[i]+=m_offset_series.GetValue();
         //---
         switch(Formula)
           {
            case FORMULA_1 :
               m_series[s].data[i]=::sin(m_series[s].data_temp[i])-::cos(m_series[s].data_temp[i]);
               break;
            case FORMULA_2 :
               m_series[s].data[i]=::sin(m_series[s].data_temp[i]-::cos(m_series[s].data_temp[i]));
               break;
            case FORMULA_3 :
               m_series[s].data[i]=::sin(m_series[s].data_temp[i]*10)-::cos(m_series[s].data_temp[i]);
               break;
           }

        }
     }
  }
After all calculated data of series are moved to arrays, we can add them (1) to the chart using the CProgram::AddSeries() method, or if they have been previously added, (2) update with the CProgram::UpdateSeries() method.
class CProgram : public CWndEvents
  {
private:
   //--- Add series to the chart
   void              AddSeries(void);
   //--- Update series on the chart
   void              UpdateSeries(void);
  };
//+------------------------------------------------------------------+
//| Calculate and set series on the diagram                          |
//+------------------------------------------------------------------+
void CProgram::AddSeries(void)
  {
   int total=(int)m_series_total.ButtonText();
   for(int s=0; s<total; s++)
      m_line_chart.SeriesAdd(m_series[s].data,m_series_name[s],m_series_color[s]);
  }
//+------------------------------------------------------------------+
//| Calculate and update series on the diagram                       |
//+------------------------------------------------------------------+
void CProgram::UpdateSeries(void)
  {
   int total=(int)m_series_total.ButtonText();
   for(int s=0; s<total; s++)
      m_line_chart.SeriesUpdate(s,m_series[s].data,m_series_name[s],m_series_color[s]);
  }
After creating the line chart, (1) size of array of series is set and (2) the initialization of auxiliary arrays is performed. Then, series are (3) calculated and (4) added to the chart.
//+------------------------------------------------------------------+
//| Create line chart                                                |
//+------------------------------------------------------------------+
bool CProgram::CreateLineChart(void)
  {
//--- Store window pointer
   m_line_chart.WindowPointer(m_window1);
//--- Coordinates
   int x=m_window1.X()+LINECHART1_GAP_X;
   int y=m_window1.Y()+LINECHART1_GAP_Y;
//--- Set properties before creation
   m_line_chart.XSize(630);
   m_line_chart.YSize(280);
   m_line_chart.BorderColor(clrSilver);
   m_line_chart.VScaleParams(2,-2,4);
   m_line_chart.MaxData(int(m_series_total.ButtonText()));
//--- Create control
   if(!m_line_chart.CreateLineGraph(m_chart_id,m_subwin,x,y))
      return(false);
//--- (1) Set size of arrays and (2) initialize them
   ResizeDataArrays();
   InitArrays();
//--- (1) Calculate and (2) add series to the chart
   CalculateSeries();
   AddSeries();
//--- Add pointer to control in the base
   CWndContainer::AddToElementsArray(0,m_line_chart);
   return(true);
  }
The same sequence of actions frequently needs to be repeated but only with updating series, when interconnecting with controls for the line chart. Therefore, we will write an auxiliary method CProgram::RecalculatingSeries() that simplifies the code by calling only one method instead of four:
class CProgram : public CWndEvents
  {
private:
   //--- Recalculating series on the chart
   void              RecalculatingSeries(void);
  };
//+------------------------------------------------------------------+
//| Recalculating series on the chart                                |
//+------------------------------------------------------------------+
void CProgram::RecalculatingSeries(void)
  {
//--- (1) Set size of arrays and (2) initialize them
   ResizeDataArrays();
   InitArrays();
//--- (1) Calculate and (2) update series
   CalculateSeries();
   UpdateSeries();
  }
At the current step of development, you will obtain the following result by downloading the application on the chart:

Fig. 4. Testing the line chart control.
If check box parameter Max. limit size is enabled, then the automatic resize of arrays of series in the CProgram::AutoResizeLineChartSeries() method is launched. This algorithm has been already thoroughly described in the beginning of this section, therefore detailed comments are sufficient for studying the code of this method (see the code listing below).
class CProgram : public CWndEvents
  {
private:
   //--- Automatic resizing of line chart series
   void              AutoResizeLineChartSeries(void);
  };
//+------------------------------------------------------------------+
//| Automatic resizing of line chart series                          |
//+------------------------------------------------------------------+
void CProgram::AutoResizeLineChartSeries(void)
  {
//--- Exit if increasing array of series with timer is disabled
   if(!m_max_limit_size.CheckButtonState())
      return;
//--- To indicate direction of changing the size of arrays
   static bool resize_direction=false;
//--- If reaching the minimum size of array
   if((int)m_series_size.GetValue()<=m_min_limit_size.GetValue())
     {
      //--- Switch direction to increase the array
      resize_direction=false;
      //--- If X value needs to be changed
      if(m_increment_ratio.CheckButtonState())
        {
         //--- To indicate increment ratio direction
         static bool increment_ratio_direction=true;
         //--- If counter is directed towards increment
         if(increment_ratio_direction)
           {
            //--- If the maximum restriction is reached, we change the counter direction to the opposite one
            if(m_increment_ratio.GetValue()>=m_increment_ratio.MaxValue()-1)
               increment_ratio_direction=false;
           }
         //--- If the counter is targeted to reduction
         else
           {
            //--- If reached the minimum restriction, change counter direction to the opposite one
            if(m_increment_ratio.GetValue()<=m_increment_ratio.MinValue()+1)
               increment_ratio_direction=true;
           }
         //--- Obtain the current value of the "Increment ratio" parameter and change it by the direction indicated
         int increase_value=(int)m_increment_ratio.GetValue();
         m_increment_ratio.ChangeValue((increment_ratio_direction)? ++increase_value : --increase_value);
        }
     }
//--- Switch direction towards the decrease of array when reaching the maximum
   if((int)m_series_size.GetValue()>=m_max_limit_size.GetValue())
      resize_direction=true;

//--- Display process if the progress bar is enabled
   if(m_progress_bar.IsVisible())
     {
      if(!resize_direction)
         m_progress_bar.Update((int)m_series_size.GetValue(),(int)m_max_limit_size.GetValue());
      else
         m_progress_bar.Update(int(m_max_limit_size.GetValue()-m_series_size.GetValue()),(int)m_max_limit_size.GetValue());
     }
//--- Change size of array according to the direction
   int size_of_series=(int)m_series_size.GetValue();
   m_series_size.ChangeValue((!resize_direction)? ++size_of_series : --size_of_series);
//--- Set a new size of arrays
   ResizeDataArrays();
  }
Animation of charts, as previously mentioned, is performed in the timer. All necessary actions are positioned in the CProgram::UpdateLineChartByTimer() method. The program instantly exits from the method, if (1) the form is minimized, or (2) the modes where updates of series by timer are disabled. Furthermore, one more obstacle here is caused by the delay in the Edit box. If all checks are complete, then necessary calculations for enabled modes are performed further, and series on the line chart are updated.
class CProgram : public CWndEvents
  {
private:
   //--- Updating the line chart by timer
   void              UpdateLineChartByTimer(void);
  };
//+------------------------------------------------------------------+
//| Update by timer                                                  |
//+------------------------------------------------------------------+
void CProgram::UpdateLineChartByTimer(void)
  {
//--- Exit if the form is minimized or in the process of shifting
   if(m_window1.IsMinimized())
      return;
//--- Exit if animation is disabled
   if(!m_max_limit_size.CheckButtonState() && !m_run_speed.CheckButtonState())
      return;
//--- Delay
   static int count=0;
   if(count<m_delay_ms.GetValue())
     {
      count+=TIMER_STEP_MSC;
      return;
     }
   count=0;
//--- If the "Running series" option is enabled, then we will shift the first value of series
   ShiftLineChartSeries();
//--- If managing the size of arrays of series by timer is enabled
   AutoResizeLineChartSeries();
//--- Initialize arrays
   InitArrays();
//--- (1) Calculate and (2) update series
   CalculateSeries();
   UpdateSeries();
  }
We will have a quick look at the CProgram::OnEvent() event handler of the developed application. To make instant visual changes on the line chart, the below mentioned controls will be used.
- The Number of series parameter (combobox). Each time when selecting a new value in this control, the number of series on the line chart will be changed. The code block for handling this event is shown in the below listing:
...
//--- Event of selecting the item in the combo box
   if(id==CHARTEVENT_CUSTOM+ON_CLICK_COMBOBOX_ITEM)
     {
      //--- Obtain new total of series
      m_line_chart.MaxData((int)m_series_total.ButtonText());
      //--- (1) Set size of arrays and (2) initialize them
      ResizeDataArrays();
      InitArrays();
      //--- (1) Calculate, (2) add to the chart and (3) update series
      CalculateSeries();
      AddSeries();
      UpdateSeries();
      return;
     }
...
For example, displaying six series in the combo box by default (6 value). Change it to 3. The result appears on the screenshot below:

Fig. 5. Test of changing the total of series on the line chart.
- Max parameters limit size (check box with Edit box) and Size of series (Edit box). The event with the ON_CLICK_LABEL identifier is generated when clicking on these controls. If the Size of series control is clicked, then value in the Edit box will be reset up the minimum. Clicking the Max control limit size will change the state of its check box to the opposite one. From the check box state it depends whether the progress bar that is demonstrated when enabling the mode of automatically resizing series on the line chart should be displayed or hidden.
...
//--- Clicking event on the text label of control
   if(id==CHARTEVENT_CUSTOM+ON_CLICK_LABEL)
     {
      //--- If this message is from the 'Size of series' control
      if(sparam==m_series_size.LabelText())
        {
         //--- Recalculating series on the chart
         RecalculatingSeries();
         return;
        }
      //--- If this message is from the 'Max. Limit Size' control
      if(sparam==m_max_limit_size.LabelText())
        {
         //--- Display or hide the progress bar depending on the state of the checkbox of the 'Max. limit size' control
         if(m_max_limit_size.CheckButtonState())
            m_progress_bar.Show();
         else
            m_progress_bar.Hide();
         //---
         return;
        }
     }
...
The screenshot below shows the example of how this looks in the process:

Fig. 6. Testing the line chart in the mode of auto resizing series.
- When entering values in the Edit box of Increment ratio, Offset series and Size of series, the CProgram::RecalculatingSeries() method is called for recalculating series (see the code listing below).
...
//--- Event of entering new value in the Edit box
   if(id==CHARTEVENT_CUSTOM+ON_END_EDIT)
     {
      //--- If it is a message from the 'Increment ratio' or 'Offset series' or 'Size of series' controls
      if(sparam==m_increment_ratio.LabelText() ||
         sparam==m_offset_series.LabelText() ||
         sparam==m_series_size.LabelText())
        {
         //--- Recalculating series on the chart
         RecalculatingSeries();
         return;
        }
      return;
     }
//--- Event of clicking on the switch buttons of the Edit box
   if(id==CHARTEVENT_CUSTOM+ON_CLICK_INC || id==CHARTEVENT_CUSTOM+ON_CLICK_DEC)
     {
      //--- If it is a message from the 'Increment ratio' or 'Offset series' or 'Size of series' controls
      if(sparam==m_increment_ratio.LabelText() ||
         sparam==m_offset_series.LabelText() ||
         sparam==m_series_size.LabelText())
        {
         //--- Recalculating series on the chart
         RecalculatingSeries();
         return;
        }
      return;
     }
...
The screenshot below shows another example. Try to set the same parameters in your copy, and see how it looks in the animation mode.

Fig. 7. Testing the "running series" mode.
After making changes to the copies of classes of the Standard Library, multiple elements arrays are correctly placed in the area of series of the line chart. The screenshot below shows an example when the size of series equals a thousand of controls (see the Size of series parameter).

Fig. 8. Test of series with a large number of data.
Application for tests is ready. You can download the file of this Expert Advisor at the end of the article and test it further.
Conclusion
This article has presented code classes that are used for creating Progress bar and the Line chart interface controls.
At the current stage of developing the Library for creating graphical interfaces, its common scheme looks as shown in the figure below. Some fragments of the scheme are just a temporary solution, and certain changes will be introduced with the development of the Library.

Fig. 9. Structure of the library at the current stage of development.
This concludes the main part of series of articles on developing the Easy And Fast Library for creating graphical interfaces in MetaTrader. The following articles will focus on working with this Library. A number of various examples, additions and updates will be provided. If you wish, you can join to the process of developing this project. If you are happy with the result, please test the Library in your projects, report errors that you may find and ask questions.
Below are all the materials of part nine available for downloading that can be tested. In case you have any questions regarding the use of materials provided in these files, you can refer to the detailed description of the Library developing process in one of the articles from the below list, or simply ask a question in the comments section of this article.
List of articles (chapters) of the part nine:
- Graphical interfaces IX: the color picker control (Chapter 1)
- Graphical interfaces IX: the progress bar and line chart controls (Chapter 2)