Moving Mini-Max: a New Indicator for Technical Analysis and Its Implementation in MQL5
investeo | 21 January, 2011
Introduction
There is a science, named Quantitative Finance, that allows to study the financial derivative pricing models using the methods of theoretical and mathematical physics.
Lately I came across a paper that describes a new indicator for technical analysis that combines ideas from quantum physics and brings them to finance. I got interested in it and decided I would teach how to implement indicators based on a scientific papers in MQL5.
The original Moving Mini-Max paper [2] is written by Z.K. Silagadze, a quantum physicist from Budker Institute of Nuclear Physics and Novosibirsk State University. The link to the paper as well as MQL5 source code are available at the end of the article.
Indicator
Never did I expect that I will write this sentence, but here I go explaining the quantum tunneling. Since I assume that most of the readers are not quants I will describe it in simple terms, I hope you will not feel offended. At first lets define in one sentence the idea behind technical analysis of financial timeseries. We are mostly looking to find:
- support and resistance price levels;
- direction of the short term and long term trends;
- tops and bottoms of the trends.
The original idea of Moving Mini-Max indicator is to find tops and bottoms on the chart by using analogue of quantum alpha particle that tries to escape a nucleus. The problem is taken from the theory of alpha decay by George Gamov [1].
A picture is worth the thousand words, therefore I am pasting a small chart below.

Figure 1. Imaginary quantum ball on forex price chart
Imagine a ball is thrown from the top of the hill or in our case from a recent top on the timeseries chart. In classical mechanics it will bounce from the obstacles and it might not have a chance to stop in the front of the foremost obstacle, since it may stuck somewhere on the way.
But according to quantum mechanics and alpha decay theory such a ball can have a very small, but non-zero probability of tunneling through the barriers finding its way to the potential well bottom and oscillate there.
This is an analouge of finding a local minimum in the price chart. The paper by Z.K. Silagadze [2] proposes that in order to reduce computation complexities instead of solving real quantum-mechanical problem it is enough to mimic quantum behaviour. I will present mathematical background that is presented in the original paper, and later the implementation in MQL5.
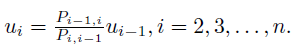
Let ![]() be a price series for some time window. The Moving Mini-Max is a non-linear transformation of the price series:
be a price series for some time window. The Moving Mini-Max is a non-linear transformation of the price series:

where ![]() and for
and for ![]() is defined as follows:
is defined as follows:
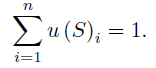
As you can see this is a recurrent relation, that is i-th element is dependent on i-1 element. The moving mini-max series satisfies normalization contition, that is sum of all elements equals one
Tunneling probabilities of a quantum ball are called transition probabilities because they model probabilities of crossing through narrow barriers of price series, imaginary small obstacles on the downhill:
![]()
with
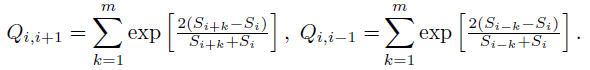
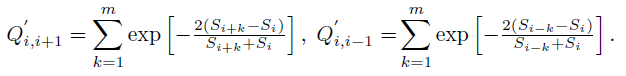
Parameter m is a width of smoothing window that mimics the (inverse) mass of the quantum ball and its ability to pass through small obstacles. Alternatively moving mini-max d(si) that emphasises local maximums can be constructed by putting minus sign in the parameter passed to exp() function:
Implementation
Having read about math behind the indicator we can implement it in
MQL5. In order to do it the best is to look from the last equation
upwards. If you put attention to m and n variables you will see that this indicator needs n+2m element array of price series for one mini-max window and will have lag size of m bars.
This is because of S i+k and S i-k indexes in Q variables calculation. Variable i is incremented from 1 to n and k in incremented from 1 to m, therefore we will need n+2m buffer to start from. This can be achieved by calling:
double S[];
ArrayResize(S,n+2*m);
CopyClose(Symbol(),0,0,n+2*m,S);
This will declare array of doubles, resize it to n+2m and copy close values of last n+2m bars from the current symbol chart starting from the latest bar.
The next step is to calculate Q values. If you carefully read the definition you will see that for the i-th element of the analyzed price series we need to sum m results of exp() function with price values variables. Therefore we need to make a loop from 1 to n that will count all Q values:
void calcQii()
  {
   int i,k;

   for(i=0; i<n; i++)
     {
      double sqiip1=0;
      double sqiim1=0;
      double dqiip1=0;
      double dqiim1=0;

      for(k=0; k<m; k++)
        {
         sqiip1 += MathExp(2*(S[m-1+i+k]-S[i])/(S[m-1+i+k]+S[i]));
         sqiim1 += MathExp(2*(S[m-1+i-k]-S[i])/(S[m-1+i-k]+S[i]));

         dqiip1 += MathExp(-2*(S[m-1+i+k]-S[i])/(S[m-1+i+k]+S[i]));
         dqiim1 += MathExp(-2*(S[m-1+i-k]-S[i])/(S[m-1+i-k]+S[i]));
        }
      sQiip1[i] = sqiip1;
      sQiim1[i] = sqiim1;
      dQiip1[i] = dqiip1;
      dQiim1[i] = dqiim1;

     }
  }
As you can observe the calcQii function calculates i-th Q and Q` values for the observed price window of size n. S array holds the price values and sQiip1, sQiim1, dQiip1, dQiim1 are used as intermediate calculation variables of Q and Q'.
Probabilites are calculated based on Q and Q` variables, therefore we can make another function that loops from 1 to n through sQii and dQii arrays:
void calcPii()
  {
   int i;

   for(i=0; i<n; i++)
     {
      sPiip1[i] = sQiip1[i] / (sQiip1[i] + sQiim1[i]);
      sPiim1[i] = sQiim1[i] / (sQiip1[i] + sQiim1[i]);
      dPiip1[i] = dQiip1[i] / (dQiip1[i] + dQiim1[i]);
      dPiim1[i] = dQiim1[i] / (dQiip1[i] + dQiim1[i]);
     }
  }
What is left is to calculate uSi and later dSi elements and put the results in uSi and dSi arrays
void calcui()
  {
   int i;

   sui[0] = 1;
   dui[0] = 1;

   for(i=1; i<n; i++)
     {
      sui[i] = (sPiim1[i]/sPiip1[i])*sui[i-1];
      dui[i] = (dPiim1[i]/dPiip1[i])*dui[i-1];
     }

   double uSum = 0;
   double dSum = 0;

   ArrayInitialize(uSi, 0.0);
   ArrayInitialize(dSi, 0.0);

   for(i=0; i<n; i++) { uSum+=sui[i]; dSum+=dui[i]; }
   for(i=0; i<n; i++) { uSi[n-1-i] = sui[i] / uSum; dSi[n-1-i] = dui[i] / dSum; }

  }
In order to check if normalization condition is valid, one can add the following lines:
   double result=0;
   for(i=0; i<n; i++) { /* Print("i = "+i+" uSi = "+uSi[i]); */ result+=uSi[i]; }

   Print("Result = "+ DoubleToString(result));
After all calculations were made, we need to display it inside indicator window. In order to do it, one must declare at least two indicator buffers, one for uSi and second for dSi array and define indicator type as DRAW_LINE.
    #property indicator_separate_window

    #property indicator_buffers 2
    #property indicator_plots 2
    #property indicator_type1 DRAW_LINE
    #property indicator_type2 DRAW_LINE
    #property indicator_color1 SeaGreen
    #property indicator_color2 BlueViolet
Then by calling SetIndexBuffer() function we assign uSi and dSi arrays to be displayed as INDICATOR_DATA:
   SetIndexBuffer(0,uSi,INDICATOR_DATA);
   SetIndexBuffer(1,dSi,INDICATOR_DATA);

   PlotIndexSetDouble(0,PLOT_EMPTY_VALUE,0.0);
   PlotIndexSetDouble(1,PLOT_EMPTY_VALUE,0.0);

   PlotIndexSetInteger(0,PLOT_SHIFT,-(m-1));
   PlotIndexSetInteger(1,PLOT_SHIFT,-(m-1));

Figure 2. Implemented Moving Mini-Max indicator
Possible applications of the indicator described in the article are identifying support and resistance lines and identification of chart patterns by inherent smoothing of the indicator. As for the support and resistance lines they are formed by crossing the moving mini-max of price series and moving mini-max of its moving average.
If price goes through the local maximum and crosses a moving average we have a resistance. After implementing it I saw that the method is suffering from a few false signals, but I am pasting a source code for reference on how to put lines in MQL5 using ChartObjectsLines.mqh library:
void SR()
{
   // if price goes through local maximum and crosses a moving average draw resistance
   int i, cnt=0;
   int rCnt=CopyClose(Symbol(),0,0,n+2*m,S);

   for (i=n-2; i>=0; i--)
      if (uSi[i]<uSi_MA[i] && uSi[i+1]>=uSi_MA[i+1])
      {
      Print("Resistance at " + i);
      CChartObjectHLine *line=new CChartObjectHLine();
      line.Create(0, "MiniMaxResistanceLine:"+IntegerToString(cnt), 0, S[i]);
      line.Color(LightSkyBlue);
      line.Width(1);
      line.Background(true);
      line.Selectable(false);
      cnt++;
      }
   // if price goes through local minimum and crosses a moving average draw support

   for (i=n-2; i>=0; i--)
      if (dSi[i]<dSi_MA[i] && dSi[i+1]>=dSi_MA[i+1])
      {
      Print("Support at " + i);
      CChartObjectHLine *line=new CChartObjectHLine();
      line.Create(0, "MiniMaxSupportLine:"+IntegerToString(cnt), 0, S[i]);
      line.Color(Tomato);
      line.Width(1);
      line.Background(true);
      line.Selectable(false);
      cnt++;
      }
}
The interesting fact of the indicator though is that I saw that it recognizes quite well local short-trend minimums and maximum for a given time window. It is enough to filter the spread between highest and lowest readings of moving mini-maxes and mark them as a beginning of a short-term bull or bear trend.
We may exploit this behaviour in accordance to other indicators and money management to make a profitable Expert Advisor.
In order to mark the highest readings on the current time window we may use additional indicator buffers to display up and down arrows every time the spread is largest. Additionally to make the indicator more appealing I decided to use new feature of MQL5: a color histogram. The downtrend and uptrend are coloured in different colors, and the trend change is signalled by a yellow bar.
In order to use the colour histogram between two buffers we must use 2 data buffers and one buffer for colour indexes. Please observe how to define plots. There are 5 indicator buffers in total, and three colors are defined for color histogram.
//+------------------------------------------------------------------+
//|                                                MovingMiniMax.mq5 |
//|                                      Copyright 2011, Investeo.pl |
//|                                               http://Investeo.pl |
//+------------------------------------------------------------------+
#property copyright   "Copyright 2011, Investeo.pl"
#property link        "http://Investeo.pl"

#property description "Moving Mini-Max indicator"
#property description "proposed by Z.K. Silagadze"
#property description "from Budker Institute of Nuclear Physics"
#property description "and Novosibirsk State University"
#property description "Original paper can be downloaded from:"
#property description "http://arxiv.org/abs/0802.0984"

#property version     "0.6"
#property indicator_separate_window

#property indicator_buffers 5
#property indicator_plots 3

#property indicator_type1 DRAW_COLOR_HISTOGRAM2
#property indicator_type2 DRAW_ARROW
#property indicator_type3 DRAW_ARROW

#property indicator_color1 Chartreuse, OrangeRed, Yellow
#property indicator_color2 RoyalBlue
#property indicator_color3 RoyalBlue

#property indicator_width1 5
#property indicator_width2 4
#property indicator_width3 4
Please notice that histogram takes two buffers of type INDICATOR_DATA and one buffer INDICATOR_COLOR_INDEX. The buffers must be setup precisely in the following order, data buffers come first, after that a color index buffer is defined.
   SetIndexBuffer(0,uSi,INDICATOR_DATA);
   SetIndexBuffer(1,dSi,INDICATOR_DATA);
   SetIndexBuffer(2,trend,INDICATOR_COLOR_INDEX);
   SetIndexBuffer(3,upArrows,INDICATOR_DATA);
   SetIndexBuffer(4,dnArrows,INDICATOR_DATA);

   PlotIndexSetDouble(0,PLOT_EMPTY_VALUE,0.0);
   PlotIndexSetDouble(1,PLOT_EMPTY_VALUE,0.0);
   PlotIndexSetDouble(2,PLOT_EMPTY_VALUE,0.0);

   PlotIndexSetInteger(1,PLOT_ARROW,234);
   PlotIndexSetInteger(2,PLOT_ARROW,233);
Buffers 0,1,2 are for color histogram, buffers 3 and 4 are for arrow display.
The coloring algorithm is as follows:
   if (upind<dnind)
    {
      for (i=0; i<upind; i++) trend[i]=0;
      for (i=upind; i<dnind; i++) trend[i]=1;
      for (i=dnind; i<n; i++) trend[i]=0 ;
    } else
    {
      for (i=0; i<dnind; i++) trend[i]=1;
      for (i=dnind; i<upind; i++) trend[i]=0;
      for (i=upind; i<n; i++) trend[i]=1;
   }

   trend[upind] = 2;
   trend[dnind] = 2;
I am pasting the screenshot of the final result:

Figure 3. Final version of Moving Mini-Max indicator
One must remember, that the values for downtrend and uptrend are calculated for a given time window everytime new bar arrives, this is the reason to call the indicator moving mini-max.
Although it lags by m bars it gives surprisingly good overview for the trend in the current time window and interpretation on how the market 'breathes'.
I am convinced that this indicator can be profitable.
Conclusion
I presented mathematics behind a new indicator for technical analysis and its implementation in MQL5.
The original paper by Z.K. Silagadze is available at http://arxiv.org/abs/0802.0984. The attached source code is available to download.
I hope to present more interesting technical indicators and their MQL5 implementation in the future.
References:
1. G.Gamov, Theory of alpha decay.
2. Z.K. Silagadze, Moving Mini-Max - a new indicator for technical analysis.