Calculator of signals
Vladimir Karputov | 5 May, 2016
Table of Contents
- Introduction
- 1. Restrictions of use
- 2. Manual for using the calculator of signals
- 2.1. Getting started
- 2.2. User interface
- 2.3. Obtaining copy ratio
- 2.4. Copy ratio calculation details
- 2.5. Mapping is impossible
- 3. Developing the calculator of signals
- 3.1. Interface design
- 3.2. Creating canvas on the panel
- 3.3. Two-dimensional array. Sorting
- 3.4. New control — CTableListView
- Conclusion
Introduction
The most frequent question that subscribers tend to ask is: "Will I be able to subscribe to the NNN signal, and what position volume will be copied to my trading account?". This article will help to create the calculator of signals — a great assistant for those who wish to subscribe to signals. A brief manual for using the calculator of signals is also provided in this article.
The actual calculator is a panel based on the CDialog class. The following elements are used in this panel:
- CLabel
- CEdit
- CComboBox
- CButton
- CTableListView — a new control — a table that consists of a few columns and displays signals available in the terminal
- CBmpButton
- CCanvas — a canvas in the panel is used for displaying text.
The calculator of signals works with a base of signals available in the terminal. Such approach guarantees maximum compatibility between signals and your trading account thanks to the terminal that offers the additional system of filtering signals by certain characteristics. The main function of the filter is to hide signals with poor copying performance from users or to remove signals that cannot be copied.
The calculator provided in this article can be downloaded from the Market free of charge for both MetaTrader 5 and MetaTrader 4:
1. Restrictions of use
It should be clearly understood that only signals highly compatible with a subscriber's trading account are shown in the "Signals" tab in the terminal. In other words, all signals available from the showcase of signals on the website will not appear in the terminal. Furthermore, by switching trading servers (trading accounts) in the terminal, the list of signals will appear different every time.
2. Manual for using the calculator of signals
For the calculator of signals to be operational, an up to date base of trading signals in the terminal is required. Therefore, we need to activate the "Signals" tab in the "Toolbox" window (by clicking the "Signals" tab):
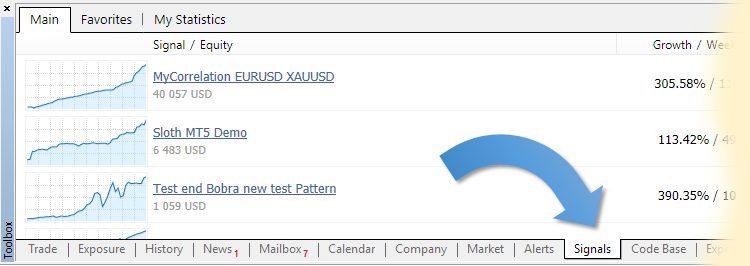
Fig. 1. Activating the "Signals" tab
Any changes in the base of signals will be updated within three to five seconds.
The "Signals" tab should be activated after connecting to a trading account, or when connecting to another trading account.
The calculator's interface consists of the following elements:
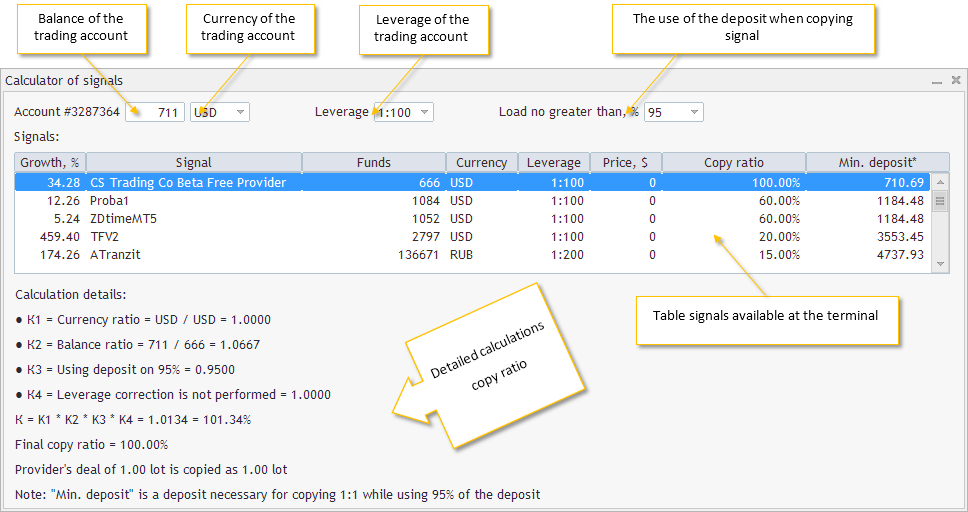
Fig. 2. Interface of the calculator
- Trading account's balance — balance of a trading account that is connected at the moment — editable field. After attaching the calculator of signals to a chart or changing a timeframe of a chart, the "Balance" field contains a balance of a trading account that is connected at the moment. This field allows only numbers from 0 to 9.
- Trading account's currency — currency of a trading account that is connected at the moment — a drop down list of the most common currencies. After attaching the calculator of signals to a chart or changing a time frame of a chart, the calculator attempts to find a currency name of a trading account connected at the moment in the list. If there is no correspondence, then "USD" is selected as a default currency.
- Trading account's leverage — leverage of a trading account that is connected at the moment — a drop down list of the most common leverages. After attaching the calculator of signals to a chart or changing a time frame of a chart, the calculator attempts to find a leverage of a trading account connected at the moment in the list. If there is no correspondence, then "1:100" is selected as a default leverage.
- Deposit load when copying a signal — a drop down list from the terminal menu "Tools" - "Options" - "Signals". After attaching the calculator to a chart or changing a time frame of a chart, the calculator attempts to find a deposit load of a trading account connected at the moment in the list. If there is no correspondence, then "95%" will be selected as a default load.
- Table of signals available in the terminal — a table with signals from the "Signals" tab. The table is automatically sorted in descending order by the "Copy ratio" column. Columns of the table:
- The "Growth, %" column — percentage of increase due to trading operations.
- The "Signal" column — name of a trading signal.
- The "Funds" column — amount of own funds in a provider's account considering liabilities.
- The "Currency" column — currency of a signal provider's trading account.
- The "Leverage" column — leverage of a signal provider's trading account.
- The "Price, $" column — price of a trading signal, in $.
- The "Copy ratio" column — copy ratio calculated for every signal with selected settings: "Trading account's balance", "Trading account's currency", "Trading account's leverage" and "Deposit load when copying a signal".
- The "Min. deposit *" column — deposit required for copying 1:1 when using a deposit for 95%. To clarify, this is a deposit where signal provider's trades are copied to you trading account in proportion 1:1, on condition that a load on a "95%" deposit is selected.
- Detailed calculation of copy ratio — step by step calculation of a selected signal's copy ratio.
- К1 — ratio of currencies of your trading account and signal provider's trading account.
- К2 — ratio of balances of your trading account and signal provider's trading account.
- К3 — ratio of using a deposit. Converting percentage to ratio.
- К4 — correction ratio on a leverage difference.
- К — final ratio. It is calculated as a ratio product К1*К2*К3*К4.
- Final copy ratio — the К ratio rounded using a multistep algorithm.
The "Copy ratio" column in the signal table shows a calculated copy ratio for every signal with selected settings: "Trading account's balance", "Trading account's currency", "Trading account's leverage" and "Deposit load when copying a signal".
If you wish, settings can be changed: "Trading account's balance", "Trading account's currency", "Trading account's leverage" or "Deposit load when copying a signal". Changing any of these settings leads to copy ratio recalculation and the table's update, and there's no guarantee that trading signals will remain in place in the table after sorting in descending order by the "Min. deposit*" column. Thus, you can see in real time how a trading signal's copy ratio is going to change with different settings applied.
2.4. Copy ratio calculation details
In order to obtain a detailed calculation of a copy ratio for a specific signal, you must choose a signal of your interest and click on the relevant row in the signal table (step 1). Calculation details for a selected signal's copy ratio will appear below the signal table right away. (step 2):
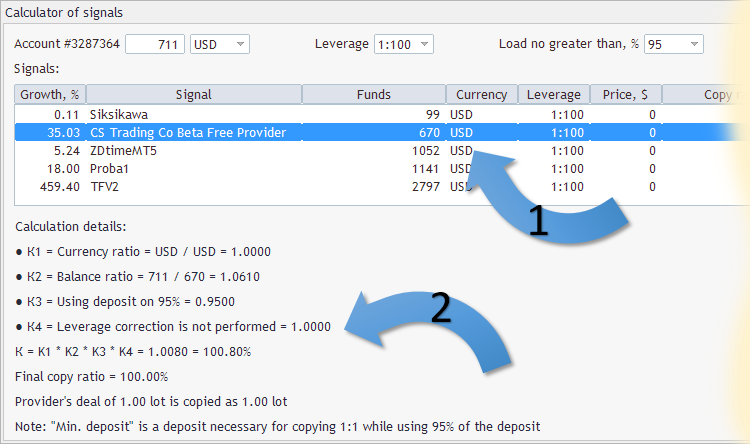
Fig. 3. Copy ratio calculation details
After selecting a different currency in the drop down list of "Trading account's currency", the signal calculator will attempt to check the "Market Watch" window for a symbol that contains a currency of your trading account (or currency selected in the drop down list of "Trading account's currency") in order to calculate a copy ratio. For example, the currency of your trading account is "USD", but the currency of your signal provider's trading account is "EUR". In this situation, the calculator will attempt to find symbols "USDEUR" and "EURUSD" in the "Market Watch" window. If a symbol cannot be found, then the terminal's tab "Experts" displays an error message.
An example of the error message that appears after selecting "SGD" in the drop down list of "Trading account's currency":
Сalculator for signals (EURUSD,M5)      Error find symbols: (Account currency SGD, Signal currency RUB)
Сalculator for signals (EURUSD,M5)      Error find symbols: (Account currency SGD, Signal currency EUR)
Сalculator for signals (EURUSD,M5)      Error find symbols: (Account currency SGD, Signal currency EUR)
This message implies that there are no symbols "SGDRUB", "SGDEUR", "RUBSGD", "EURSGD" in the "Market Watch" window. Let's check if this is the case: we will try to find any symbol that contains "SGD" in the "Market Window". Please click "+ click to add" in the "Market Watch" window:
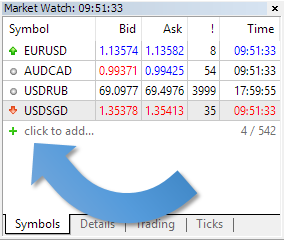
Fig. 4. Click to add command in the "Market Watch" window
and enter "SGD" in the field that opened:
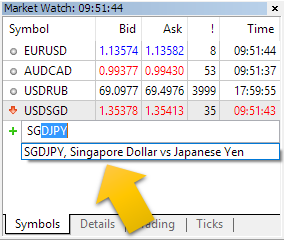
Fig. 5. List of available symbols in "Market Watch" that contain "SGD" in their name
As you can see, "Market Watch" has one symbol "USDSGD" already, and one more — "SGDJPY" can be added, but there are no symbols "SGDRUB", "SGDEUR", "RUBSGD", "EURSGD".
If mapping is not possible, "Copy ratio " in the signal table will show "n/d" (no data).
3. Developing the calculator of signals
Controls of the calculator of signals are arranged as follows:

Fig. 6. Controls' layout
The attached file "Сalculator for signals Dialog.mqh" is in charge of a layout, size and creation of controls. The principal dimensions of controls and margins are set using the macro substitution block:
//+------------------------------------------------------------------+
//| defines                                                          |
//+------------------------------------------------------------------+
//--- indents and gaps
#define INDENT_LEFT                         (11)      // indent from left (with allowance for border width)
#define INDENT_TOP                          (11)      // indent from top (with allowance for border width)
#define CONTROLS_GAP_Y                      (5)       // gap by Y coordinate
//--- for combo boxes
#define COMBOBOX_WIDTH                      (60)      // size by X coordinate
#define COMBOBOX_HEIGHT                     (20)      // size by Y coordinate
//--- for list view
#define LIST_HEIGHT                         (102)     // size by Y coordinate
//--- for buttons
#define BUTTON_WIDTH                        (72)      // size by X coordinate
#define BUTTON_HEIGHT                       (20)      // size by Y coordinate
//--- for the indication area
#define EDIT_WIDTH                          (60)      // size by X coordinate
#define EDIT_HEIGHT                         (20)      // size by Y coordinate
Controls are located on a panel consisting of 5 strings:
- first string — Label1, Edit1, ComboBox1, Label2, ComboBox2, Label3, ComboBox2
- second string — Label 4
- third string — buttons Button1- Button8 inclusive
- fourth string — new control — TableListView1
- fifth string — the BmpButton1 object that has a graphical resource based on CCanvas appointed as a bmp-file to display the control in the ON state.
//+------------------------------------------------------------------+
//| Create                                                           |
//+------------------------------------------------------------------+
bool CoSDialog::Create(const long chart,const string name,const int subwin,const int x1,const int y1,const int x2,const int y2)
  {
//---
   m_error=true;
   if(!CAppDialog::Create(chart,name,subwin,x1,y1,x2,y2))
      return(false);
//---
It means that following the creation, every control object must be added to the client area using the Add method of the CDialog class. Below is a graphic example of how the Label4 object is created:
//+------------------------------------------------------------------+
//| Create the "Signals" Label                                       |
//+------------------------------------------------------------------+
bool CoSDialog::CreateLabel4(void)
  {
//--- coordinates
   int x1=INDENT_LEFT;
   int y1=INDENT_TOP+COMBOBOX_HEIGHT+CONTROLS_GAP_Y;
   int x2=x1+100;
   int y2=y1+COMBOBOX_HEIGHT;
//--- create
   if(!m_label4.Create(m_chart_id,m_name+"Label4",m_subwin,x1,y1,x2,y2))
      return(false);
   if(!m_label4.Text(m_languages.GetText(3)))
      return(false);
   if(!Add(m_label4))
      return(false);
//--- succeed
   return(true);
  }
First, create the Label4 object:
   if(!m_label4.Create(m_chart_id,m_name+"Label4",m_subwin,x1,y1,x2,y2))
      return(false);
and it is obligatory to add the newly created Label4 object to the client area using the Add method before exiting the function:
   if(!Add(m_label4))
      return(false);
Generally, the process of creating a panel and controls on it can be shown with a sample of creating a panel of the calculator of signals in the form of a scheme:

Fig. 7. Scheme of creating controls
Let me summarize. Generally, the panel is created according to the following plan:
- creation of the panel (CAppDialog::Create)
- creation of controls in the following order:
- creation of the element (element_N.Create)
- change of the element's properties
- mandatory addition of the element to the panel (Add(elenemt_N))
3.2. Creating canvas on the panel
The canvas is created in CoSDialog::CreateBmpButton1.
First, brief information about steps involved:
Step 1: create a graphical resource without reference to the chart's object (the Create method of the CCanvas class is used)
Step 2: create the m_bmp_button1 control of the CBmpButton class (simple control class based on the 'Bitmap label' object)
Step 3: set our canvas for the m_bmp_button1 control as a bmp-file in the ON state (the BmpOnName method)
Step 4: add the m_bmp_button1 control to the panel ( Add method of the CDialog class)
Now, more information about each step.
Step 1.
//--- create canvas
   if(!m_canvas1.Create("Canvas1",x2,y2,COLOR_FORMAT_XRGB_NOALPHA))
     {
      Print("Error creating canvas: ",GetLastError());
      return(false);
     }
   m_canvas1.FontSet("Trebuchet MS",-100,FW_THIN);
   m_canvas1.Erase(ColorToARGB(C'0xF7,0xF7,0xF7',255));
   m_canvas1.Update(true);
Notice that when creating the canvas (m_canvas1.Create) x2 width and y2 height are specified — in fact these are the icon dimensions that will remain the same:

Fig. 8. Sizes of canvas
Then, the canvas font is set (m_canvas1.FontSet), the canvas is filled with color of the inner area of panels (m_canvas1.Erase) and, changes MUST be displayed (m_canvas1.Update).
Step 2.
//--- create
   if(!m_bmp_button1.Create(m_chart_id,m_name+"BmpButton1",m_subwin,x1,y1,x1+10,y1+10))
      return(false);
Creation of the m_bmp_button1 control sized 10*10 pixels. It doesn't matter that the size is small. The actual coordinates x1 and y1 play a crucial role here acting as an anchor point. When the size of the control will adapt to the size of the icon, the angle with coordinates (x1; y1) will remain in place.
Step 3.
//--- sets the name of bmp files of the control CBmpButton
   if(!m_bmp_button1.BmpOnName(m_canvas1.ResourceName()))
      return(false);
We obtain the resource name (m_canvas1.ResourceName()) and appoint as a bmp-file in the ON state (m_bmp_button1.BmpOnName). At this stage, the m_bmp_button1 control stretches out to the size of the canvas.
Step 4.
Please don't forget to add this control to the panel once it is created:
   if(!Add(m_bmp_button1))
      return(false);
3.3. Two-dimensional array. Sorting
The sorting is performed in the "Сalculator for signals Dialog.mqh" file in the CoSDialog::InitStructurs method.
The table data in the calculator of signals is sorted out by the calculated indicator — copy ratio. But in the process of obtaining a copy ratio, the list that comprises the signal name and the calculated copy ratio is not sorted and looks approximately like this:
| Name | Copy ratio |
|---|---|
| TestUSD | 15.0 |
| TradeLargeVolumes | 120.0 |
| Zeus PRO | 15.0 |
| CS Trading Co Beta Free Provider | 1510.0 |
| Mint blueberry ice cream | 8.0 |
| MT5Hedging | 7.0 |
| Forex Leos Trading | 160.0 |
| Hedge | 1.0 |
| Siksikawa | 8770.0 |
| Week H4 | 15.0 |
| WGT Live Signal | 45.0 |
| Atrader | 30.0 |
| Trajecta Advisor FX491 | 30.0 |
| MOsg style | 6.0 |
For sorting we have applied the solution suggested by a user Vasiliy Sokolov: each string must be presented as CObject, and the whole table — as CArrayObj. This table was called linear, the class of the virtual linear table (virtual because it doesn't have a visual interface) was placed in "LineTable.mqh".
The result of sorting is presented in the linear table below (the example is provided for some first line inserts in the table). First, the parameters that are inserted into the linear table (Insert : ) are displayed, below is the iteration over all elements of the linear table (row #):
| name | rate | min_deposit |
|---|---|---|
| Insert : MyCorrelation EURUSD XAUUSD | 7 | 133134.7143 |
| row #0: MyCorrelation EURUSD XAUUSD | 7 | 133134.7143 |
| Insert : EA microPatience AvzPrecio v6 HG 10 | 7 | 133134.7143 |
| row #0: MyCorrelation EURUSD XAUUSD | 7 | 133134.7143 |
| row #1: EA microPatience AvzPrecio v6 HG 10 | 7 | 133134.7143 |
| Insert : EURUSD Daytrade | 170 | 5482.017647 |
| row #0: EURUSD Daytrade | 170 | 5482.017647 |
| row #1: MyCorrelation EURUSD XAUUSD | 7 | 133134.7143 |
| row #2: EA microPatience AvzPrecio v6 HG 10 | 7 | 133134.7143 |
| Insert : Exp TickSniper PRO FULL MT5 | 50 | 18638.86 |
| row #0: EURUSD Daytrade | 170 | 5482.017647 |
| row #1: Exp TickSniper PRO FULL MT5 | 50 | 18638.86 |
| row #2: MyCorrelation EURUSD XAUUSD | 7 | 133134.7143 |
| row #3: EA microPatience AvzPrecio v6 HG 10 | 7 | 133134.7143 |
| Insert : Example1 | 3 | 310647.6667 |
| row #0: EURUSD Daytrade | 170 | 5482.017647 |
| row #1: Exp TickSniper PRO FULL MT5 | 50 | 18638.86 |
| row #2: MyCorrelation EURUSD XAUUSD | 7 | 133134.7143 |
| row #3: EA microPatience AvzPrecio v6 HG 10 | 7 | 133134.7143 |
| row #4: Example1 | 3 | 310647.6667 |
| Insert : Big sale | 80 | 11649.2875 |
| row #0: EURUSD Daytrade | 170 | 5482.017647 |
| row #1: Big sale | 80 | 11649.2875 |
| row #2: Exp TickSniper PRO FULL MT5 | 50 | 18638.86 |
| row #3: MyCorrelation EURUSD XAUUSD | 7 | 133134.7143 |
| row #4: EA microPatience AvzPrecio v6 HG 10 | 7 | 133134.7143 |
| row #5: Example1 | 3 | 310647.6667 |
The image clearly shows that after adding to the linear table, sorting by the "rate" field is done, and this is exactly what we need. In the future, knowing that all controls in the linear table are sorted, we can copy their values to new controls — the CTableListView table, and stay confident that data will be presented in a sorted list.
If you wish to print the step by step sorting and get the same table, simply uncomment strings in the"Сalculator for signals Dialog.mqh" file in the CoSDialog::InitStructurs method:
         else
           {
            min_deposit=AccInfo.balance/rate*100.0;
           }
         //Print("Insert : ",name,"; ",rate,"; ",min_deposit);
         m_table.InsertSort(new CLineTable(name,rate,min_deposit));
         //for(int m=0;m<m_table.Total();m++)
         //  {
         //   CLineTable *line=m_table.At(m);
         //   Print("row #",m,": ",line.Text(),"; ",line.Number(),"; ",line.Number1());
         //  }
        }
      else PrintFormat("Error in call of SignalBaseSelect. Error code=%d",GetLastError());
     }
//---
   return(true);
  }
3.4. New control — the CTableListView table
In order to display signals, their features and calculated data, we will create a visual control — a table that can display few rows and columns. At the same time, if the number of rows exceeds the table height, then a vertical scroll bar must appear. After searching, it was decided to use the control of the CListView class as a basis and to modernize it significantly.
The CTableListView control table has two parts — a visible part that a user can see and have a physical contact with, and an invisible part for storing the table's cell data.
The visible part of the table is stipulated by the size of control. It is restricted with a rectangle with coordinates (x1; y1) and (x2; y2) andd the number of columns that are set when creating an element in the Create method:
   virtual bool      Create(const long chart,const string name,const int subwin,const int x1,
                            const int y1,const int x2,const int y2,const uchar columns,const ushort &columns_size[]);
The visible part consists of the CEdit controls:

Fig. 9. Creating a visible part of the CTableListView table
CEdit controls of the visible part are created and managed with the dynamic array pointers m_arr_rows — the object of the CArrayObj class:
CArrayObj m_arr_rows; // array of pointer to objects-rows (CEdit) (an article about applying pointers — Using the object pointers in MQL5)
The m_arr_rows pointer array works on the principle of a two-level Russian doll. The first level stores pointers to the row objects which, in turn, store pointers to the table's cell-objects (elements of CEdit):

Fig. 10. Pointers to visible objects
The invisible part is also implemented through the CArrayObj class. Two dynamic arrays m_arr_rows_str and m_arr_rows_val are in charge of the invisible part,
   CArrayObj         m_arr_rows_str;         // array of pointer to objects-rows (CArrayString)
   CArrayObj         m_arr_rows_val;         // array of pointer to objects-rows (CArrayLong)
where cell text and values are stored respectively.
The structure of pointer arrays m_arr_rows_str and m_arr_rows_val is similar to the structure of the m_arr_rows pointer array, with a difference that the class arrays CArrayString and CArrayLong are used as strings respectively.
3.4.1. Example of working with a dynamic array of pointers
Let's analyze the operation with a dynamic array of pointers based on the example of creating an object (table):
//+------------------------------------------------------------------+
//| Create a control                                                 |
//+------------------------------------------------------------------+
bool CTableListView::Create(const long chart,const string name,const int subwin,const int x1,
                            const int y1,const int x2,const int y2,const uchar columns,const ushort &columns_size[])
  {
   m_columns=columns;
   ArrayResize(m_columns_size,m_columns);
   if(ArraySize(columns_size)!=m_columns)
      return(false);
   ArrayCopy(m_columns_size,columns_size,0,0,WHOLE_ARRAY);
   m_columns_size[0]-=1;
   m_columns_size[m_columns-1]-=1;
   int y=y2;
//--- if the number of visible rows is previously determined, adjust the vertical size
   if(!TotalView((y2-y1)/m_item_height))
      y=m_item_height+y1+2*CONTROLS_BORDER_WIDTH;
//--- check the number of visible rows
   if(m_total_view<1)
      return(false);
//--- call method of the parent class
   if(!CWndClient::Create(chart,name,subwin,x1,y1,x2,y))
      return(false);
//--- set up
   if(!m_background.ColorBackground(CONTROLS_LIST_COLOR_BG))
      return(false);
   if(!m_background.ColorBorder(CONTROLS_LIST_COLOR_BORDER))
      return(false);
//--- create dependent controls
   CArrayObj *m_arr_cells;
   for(int i=0;i<m_total_view;i++)
     {
      m_arr_cells=new CArrayObj;
      if(CheckPointer(m_arr_cells)==POINTER_INVALID)
         return(false);
      for(int j=0;j<m_columns;j++)
        {
         CEdit *m_cell;
         m_cell=new CEdit;
         if(CheckPointer(m_cell)==POINTER_INVALID)
            return(false);
         m_arr_cells.Add(m_cell);
        }
      m_arr_rows.Add(m_arr_cells);
     }
//---
   for(int i=0;i<m_total_view;i++)
     {
      if(!CreateRow(i))
         return(false);
      if(m_height_variable && i>0)
        {
         // m_rows[i].Hide(); ///
         CArrayObj *m_arr_cells_i=m_arr_rows.At(i);
         if(CheckPointer(m_arr_cells_i)==POINTER_INVALID)
            return(false);
         for(int j=0;j<m_arr_cells_i.Total();j++)
           {
            CEdit *m_cell=m_arr_cells_i.At(j);
            if(CheckPointer(m_cell)==POINTER_INVALID)
               return(false);
            if(!m_cell.Hide())
               return(false);
           }
        }
     }
//--- succeed
   return(true);
  }
The following block code
//--- if the number of visible rows is previously determined, adjust the vertical size
   if(!TotalView((y2-y1)/m_item_height))
      y=m_item_height+y1+2*CONTROLS_BORDER_WIDTH;
is used to call TotalView where a number of visible rows is calculated. This number is stored in the m_total_view variable.
Further, the m_arr_cells rows are created in the for(int i=0;i<m_total_view;i++) loop, and rows are filled with m_cell cells in the for(int j=0;j<m_columns;j++) loop:
//--- create dependent controls
   CArrayObj *m_arr_cells;
   for(int i=0;i<m_total_view;i++)
     {
      m_arr_cells=new CArrayObj;
      if(CheckPointer(m_arr_cells)==POINTER_INVALID)
         return(false);
      for(int j=0;j<m_columns;j++)
        {
         CEdit *m_cell;
         m_cell=new CEdit;
         if(CheckPointer(m_cell)==POINTER_INVALID)
            return(false);
         m_arr_cells.Add(m_cell);
        }
      m_arr_rows.Add(m_arr_cells);
     }
//---
After the full bypass of the for(int j=0;j<m_columns;j++) loop, each filled row is added to the main array — m_arr_rows:
m_arr_rows.Add(m_arr_cells);
This way, after the full bypass of the for(int i=0;i<m_total_view;i++) loop, we have a filled array of indicators m_arr_rows that in its structure corresponds to the visible part of the table (see fig. 9).
After filling the pointer array in the second loop for(int i=0;i<m_total_view;i++), the table is visualized (creation of the table's visible part) by calling CreateRow:
//---
   for(int i=0;i<m_total_view;i++)
     {
      if(!CreateRow(i))
         return(false);
      .
      .
      .
     }
//--- succeed
   return(true);
The CreateRow method:
//+------------------------------------------------------------------+
//| Create "row"                                                     |
//+------------------------------------------------------------------+
bool CTableListView::CreateRow(const int index)
  {
   .
   .
   .
//--- create
   CArrayObj *m_arr_cells=m_arr_rows.At(index);
   if(CheckPointer(m_arr_cells)==POINTER_INVALID)
      return(false);
   for(int i=0;i<m_arr_cells.Total();i++)
     {
      CEdit *m_cell=m_arr_cells.At(i);
      if(CheckPointer(m_cell)==POINTER_INVALID)
         return(false);
      x1+=x2;
      x2=m_columns_size[i];
      if(!m_cell.Create(m_chart_id,m_name+"_"+IntegerToString(index)+"_"+IntegerToString(i),
         m_subwin,x1,y1,x1+x2,y2))
         return(false);
      if(!m_cell.Text(""))
         return(false);
      if(!m_cell.ReadOnly(true))
         return(false);
      if(!Add(m_cell))
         return(false);
     }
   .
   .
   .
   return(true);
  }
We receive a pointer to the m_arr_cells element (m_arr_cells has the CArrayObj type), placed at the index position, from the m_arr_rows pointer array in the code block. The m_arr_cells element is, in fact, a string of the row table (see fig. 10). We use the At method of the CArrayObj class:
   .
//--- create
   CArrayObj *m_arr_cells=m_arr_rows.At(index);
   if(CheckPointer(m_arr_cells)==POINTER_INVALID)
      return(false);
   for(int i=0;i<m_arr_cells.Total();i++)
From now on, we work with the m_arr_cells control (pointer array) in the for(int i=0;i<m_arr_cells.Total();i++) loop: a pointer to the m_cell element (m_cell has the CEdit type), placed at the i position, is obtained from the m_arr_cells pointer array:
      CEdit *m_cell=m_arr_cells.At(i);
      if(CheckPointer(m_cell)==POINTER_INVALID)
         return(false);
Then, we create cells (controls of the CEdit class) with a unique name:
      if(!m_cell.Create(m_chart_id,m_name+"_"+IntegerToString(index)+"_"+IntegerToString(i),
         m_subwin,x1,y1,x1+x2,y2))
         return(false);
change some properties of the created controls (remove all text of the control and make it uneditable):
      if(!m_cell.Text(""))
         return(false);
      if(!m_cell.ReadOnly(true))
         return(false);
And the last step, but not the least — we add the newly created control to our panel:
      if(!Add(m_cell))
         return(false);
     }
Conclusion
I hope that you will find the calculator of signals useful at selecting signals, and most importantly, it will help you see how a copy ratio will change when changing (in the calculator) the size of a deposit and/or a leverage of your trading account.