Fuzzy logic to create manual trading strategies
Alexander Fedosov | 7 March, 2016
Introduction
A rapid development of technology has led to a stronger tendency of using automated trading systems on modern currency markets. However, many traders still carry on using manual trading. Pros and cons of both trading approaches are very well-known: automated trade lacks flexibility towards constant market changes, and manual trade, on the contrary, can be way too flexible due to a frequent human interference factor. In fact, in this comparison, these are two extremes of the same essence.
In my previous article I have given examples, where I tried to compensate disadvantages of the automated trade by applying fuzzy logic theory, for instance, by blurring overly strict strategy formalization, applied in a trading robot or an indicator. In this article, an opportunity for improving the manual trading strategy will be considered. The use of modern technology, even at the manual trading regime where a final decision always rests with traders, brings more benefit than harm.
Selecting manual strategy with a specific formalization of conditions
Many modern traders choose to take responsibility for entering and exiting positions, rather than rely on automated systems. They require to develop their own trading strategy that would take into account all possible outcomes of the market behavior. Afterwards, one would have to follow it strictly and resist any impulses that could be provoked by fear and greed.
Therefore, first we need to come up with a trading strategy. Let me describe you three stages of how we are going to build it.
- Stage No1. Finding and identifying instruments that will be used for our strategy.
- Stage No2. Setting specific conditions used by a trader to open a position on the market.
- Stage No3. Setting specific conditions when a position will have to be closed with either positive or negative result.
Stage No1.
At the first stage I have selected three indicators for building a trading strategy as an example:
- Average Directional Movement Index, ADX. This is a trending indicator that determines the strength of the current trend.
- Relative Vigor Index, RVI oscillator.
- Accelerator Oscillator(AC) indicator by Bill Williams.
Selected general view and settings of the MQL4 trading terminal:
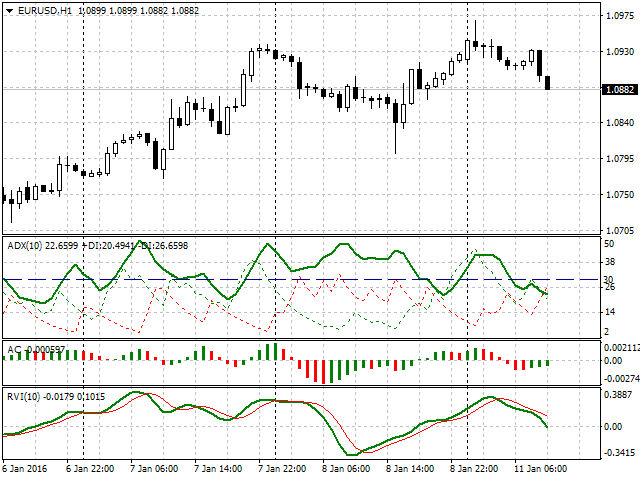
Fig. 1. General view of strategy settings
Stage No2.
At the second stage we will discover a way of using selected instruments, conditions for their operation, and also the position parameters for market entry.
Let's start from the beginning.
- Our first indicator is ADX. As seen from the fig. 1, the specified indicator period equals 10. Furthermore, a level for the main trend line (green color) that equals 30 was set specifically. Any value that equals or exceeds it, will be considered as a positive signal for market entry. It is worth noting, that the buy signal from this indicator will be the case when +DI (green dashed line) is higher than -DI (red dashed line). Accordingly, the sell signal faces a reverse situation when -DI is higher than +DI.
- The second indicator is AC. Here we are going to use signals described in the official documentation. Specifically, if the indicator's value is below 0 and it grows on the analyzed and two previous bars, then it's a signal for buying. Therefore, if the indicator's value is above 0 and it falls on the analyzed and two previous bars, we get a signal for selling.
- The third indicator is RVI. Let's set the period of its operation equal to 10. As a condition for buying, we will determine the moment when the signal line (thin red) crosses the main line (green). At this intersection, the line's value on the analyzed bar must be below the zero point. Similarly, we will set conditions for selling: the signal line crosses the main line, but the values are positioned above zero.
- The next condition for an operation will be an hourly timeframe (H1).
- The condition for position entry implies passing similar signals from all three selected indicators.
- And, finally, we will decide on the size of the position. As an example, the following will be set: 0,01 lot, Take Profit of 50 points, Stop Loss of 30 points.
Terms will be formalized for a better clarity.
Entering a long position (buy signal)
- The main green line of the ADX indicator holds value that is higher or equals 30, whereas +DI value is higher than -DI.
- AC value grows on the current bar, and is higher than on the previous two bars that also grow consistently. Visually, these are three columns of the green histogram, where each column is shorter than the previous one, and all three are positioned in the negative area.
- The RVI signal (thin red) line crosses the main line (green), both grow, but still remain below the zero point.
- We buy with 0,01 lot, place Take Profit of 50 points and Stop Loss of 30 points.
- The main green line of the ADX indicator holds value that exceeds or equals 30, whereas +DI value is below -DI.
- The AC value drops at the current bar, and is lower than at the previous two bars that keep dropping consistently. Visually, these are three columns of the red histogram, where each column is shorter than the previous one, and values of all three are above zero.
- The RVI signal line (thin red) crosses the main line (green), both decline but remain in the positive area.
- We sell with 0,01 lot, place Take Profit of 50 points and Stop Loss of 30 points
Stage No3
All we need to do is to determine how to exit the position. As a condition for exiting, we will set the price target that we have obtained earlier: achieving profit of 50 points or executing Stop Loss of 30 points.
So, our trading strategy is now defined. We have set the conditions for opening and closing positions, selected the indicators and set their operational parameters, defined the sizes of position entry and their goals. And, finally, we have decided on the events for exiting the market.
At the next stage we are going to check the created trading strategy in real conditions. The first thing we need to understand is that there are no ideal strategies in a long-term perspective and absolutely all market stages. And traders that use automated trading and those who trade manually frequently observe that their system proves itself differently in various conditions. Also, it is not unusual when the initial conditions in the already specified trading system could have shown better results.
For example, with respect to our system, a trader may have noticed that the set Take Profit could have been made higher. This is not because he simply wishes to gain more, but because he constantly analyzes his system, and his statistics showed that after closing successful trades, the price kept moving in the desired direction for some time. Therefore a trader may have a reasonable question: how to apply statistical data and observations obtained for his trading system in order to improve the results?
Remedying the shortcomings of strict formalization with fuzzy logic
Let's look at the indicators used in our system from the perspective of fuzzy logic theory. In my previous article I tried to convey its main advantage — flexibility in analyzing those parts of the trading strategy where strict categorization applies. Fuzzy logic was blurring strict boundaries giving a broader picture of evaluation and reaction of the system in the border sections of its operation. There was also an example of a more adaptable approach to the operation of the ADX indicator we used. First, a strict division between weak, average and strong trends was applied, but then these categories blurred and determining the trend strength wasn't already strictly linked to the subjectivity of the indicator values.
But let's return to our system and ask ourselves: how all this can help us?
Imagine that our trader observes the market and sees the signal from his first indicator: ADX has reached 32, for example. He marks this and waits for confirmation from other two indicators. Shortly the signal from AC arrives, while ADX shows increase for up to 40. The RVI signal line crosses the main line after some time, which means that all three conditions for entering the position have been finally met. ADX has already reached the 45 point. But the absolute value of ADX in our system is not so important. The main thing is that it exceeds 30. Therefore a trader follows his rules and enters the market with 0,01 lot, Take Profit at 50 points, and Stop Loss at 30.
Now, let's simulate another possible scenario. In the beginning, the situation develops the same way as in the first case. ADX=32, the signal arrives from AC, ADX simultaneously reaches the 40 point. But when the last missing signal for opening the position arrives from RVI, then ADX rockets to 55, instead of 45. By comparing the two described options, it shows that the second signal is stronger than the previous one, but our trader still opens the position with the same lot and the same values of Take Profit and Stop Loss.
Here we encounter the first disadvantage of our strategy. Only the existence of the incoming signal is evaluated, without paying much attention to quality. And even if we manage to evaluate and define the category, the accuracy of the assessment still will be lost in transitional areas.
So how can we approve a particular case with ADX, RVI indicators and bind their parameters to the position we use for market entry? For this purpose, we need to carry out the following steps:
- To establish clear categories of evaluating the trend strength (ADX) and Relative Vigor Index (RVI). This will be an input signal, based on which we will make an additional decision.
- To establish clear categories of our position's goals (Take Profit or Stop Loss in our strategy, although we can set here a lot size). This is an output signal that will correct our position on the market given the trend strength.
- To describe categories of input and output signals with membership functions of fuzzy set theory.
- To create interface that would display recommendations for changing a position of the initial strategy based on the new terms.
- To create flexible settings for changing membership functions that would allow to correct this recommendation system when necessary.
To start with, we will describe the first input variable — value of trend strength.
1. We will set 4 categories of trend strength: low, moderate, medium and high. This is how it will look:
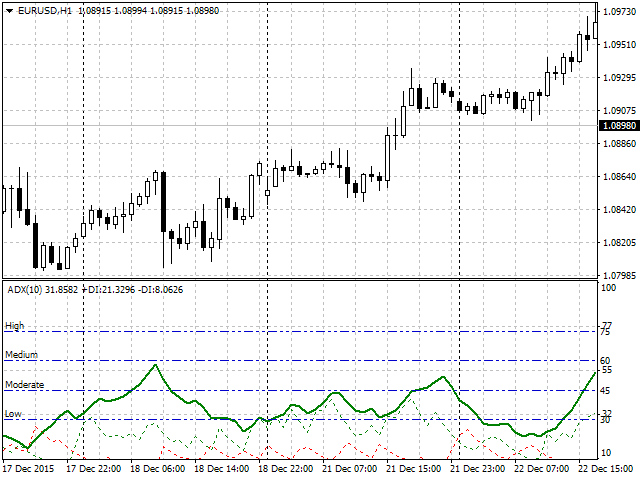
Fig. 2. Visual trend strength divided in categories
2. In order to set the categories of the output signal, it is required to determine how the ADX category will influence our position. Normally, the higher the trend is, the longer it lasts. Therefore, we will proceed accordingly: depending on where ADX is at the moment when all three strategy signals are received, we are going to increase Take Profit by 10 - 50 points.
The following categories will be entered for the profit goal value that will be added to the initial 50 points of our strategy.
- low_take category: low trend, add 10 - 20 points to the goals.
- mod_take category: moderate trend, add 20 - 30 points to the goals.
- med_take category: medium trend, add 30 - 40 points to the goals.
- high_take category: high trend, add 40 - 50 points to the goals.
3. At the following stage we will describe the conditions set earlier with membership functions of fuzzy set theory. The description of four trend categories is as follows:
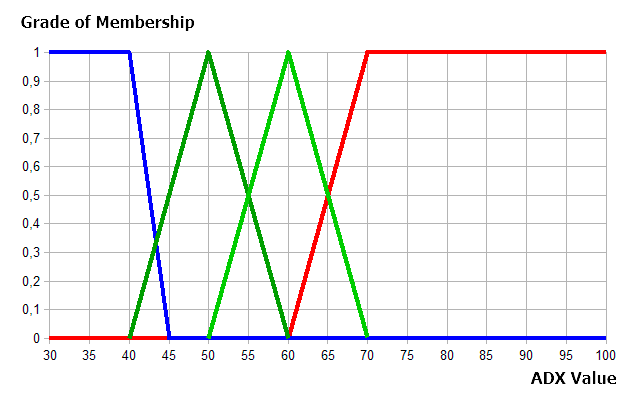
Fig. 3. Description of four trend categories of fuzzy logic
As shown in fig. 3, every category was set by the membership function, such as: low trend and high trend with two trapezium functions, and moderate and medium categories with two triangular functions.
Now, let's define the same for the RVI.
1. Let's set the categories for Relative Vigor Index. There will be four: low, medium, high and higher. This is how it will look:
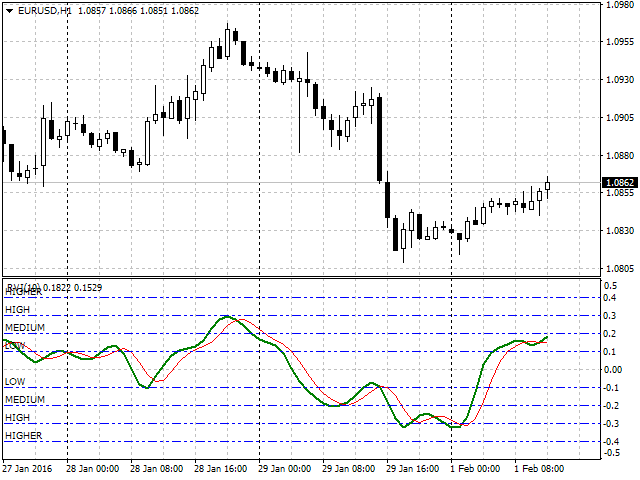
Fig. 4. Visual division of Relative Vigor Index by category
2. Now, we will describe the categories introduced with membership functions. Trapezium functions will be used to describe low and higher categories, and triangular functions will apply as for medium and high categories.
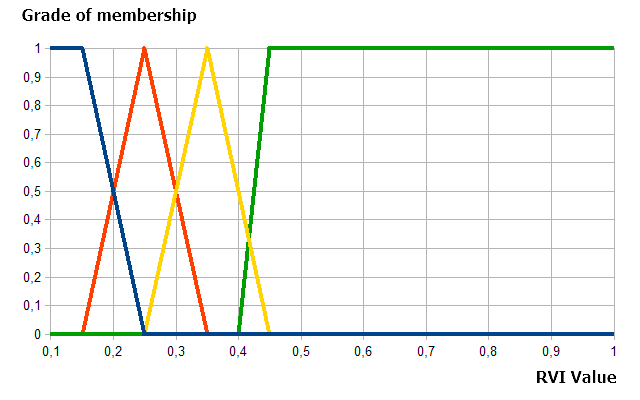
Fig. 5. Description of RVI index categories
Similarly, we will describe four categories for values of profit goals: first and fourth categories (10-20 and 40-50 points) using trapezium functions, and two remaining ones (20-30 and 30-40 points) — with triangular functions. This is how the description of our input signal would look like.
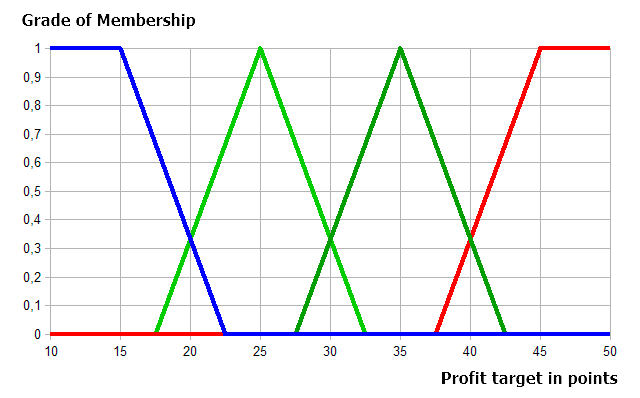
Fig. 6. Description of categories for values of profit goals
Implementation of the panel's interface to display recommendations for changing the position
When building the info panel, we select four parameters for observations:
- ADX value. Only when specified criteria is satisfied, for instance — 30 or above.
- RVI value. Only provided that it's higher than 0,1 (for sale signal), or below -0,1 (for buy signal).
- The recommended number of points that must be added to the initial goal of 50.
- Take Profit value in the format of trading instrument's price (taking into account the initial price and recommendations on how to increase it).
The general appearance of the trading strategy in full implementation will look as follows (fig.6).
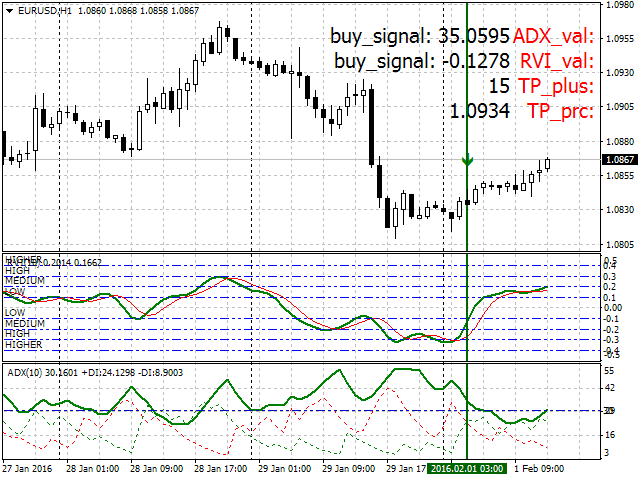
Fig. 7. Full implementation, general appearance, and setting of the trading strategy
Now let's look into this panel implementation using MQL4 tools and FuzzyNet library.
We implement and analyze the key logical blocks of this informative panel with MQL4 tools.
//+------------------------------------------------------------------+
//| FuzzyNet Panel                                                   |
//+------------------------------------------------------------------+
#property copyright "Alexander Fedosov"
#property version "1.0"
#property strict
#property link "https://www.mql5.com/ru/users/alex2356/"
#property indicator_chart_window
#property indicator_buffers 1
#property indicator_color1 Green
//+------------------------------------------------------------------+
//| Connecting libraries                                             |
//+------------------------------------------------------------------+
#include <Math\FuzzyNet\MamdaniFuzzySystem.mqh>
We define the initial properties and connect the library to operate with fuzzy logic. We will set the option to find the panel in the chart's window. We will define one indicator buffer and its color (green) for an arrow indicator of the bar we analyzed.
//--- Input parameters
input string  p1="==== Parameters ====";
input int fontSize=15;
input int adx_period=10;
input int rvi_period=10;
input int num_bar=0;
input int Screen_corner=4;
input color label_clr=Red;
input color textColor=Black;
We will look into the first block of input Parameters in more details. It contains the following elements:
- fontSize — font size of textual information (recommended range 8 — 15).
- adx_period — operation period of ADX indicator.
- num_bar — number of bar for which the system is calculated.
- Screen_corner — angle for displaying the panel.
- label_clr — color of header text.
- textColor — color of value text.
The second block of input Fuzzy Logic Parameters contains the majority of parameters for flexible settings of all membership functions describing both input (ADX trend strength, RVI index) and output parameters (recommended value of profit goal points).
input string  p2="==== Fuzzy Logic Parameters ====";
//--- ADX
input double in_term1a = 20;
input double in_term1b = 30;
input double in_term1c = 40;
input double in_term1d = 45;
input double in_term2a = 40;
input double in_term2b = 50;
input double in_term2c = 60;
input double in_term3a = 50;
input double in_term3b = 60;
input double in_term3c = 70;
input double in_term4a = 60;
input double in_term4b = 70;
input double in_term4c = 100;
input double in_term4d = 120;
//--- RVI
input double in_term1a1 = -0.25;
input double in_term1b1 = 0.1;
input double in_term1c1 = 0.15;
input double in_term1d1 = 0.25;
input double in_term2a1 = 0.15;
input double in_term2b1 = 0.25;
input double in_term2c1 = 0.35;
input double in_term3a1 = 0.25;
input double in_term3b1 = 0.35;
input double in_term3c1 = 0.45;
input double in_term4a1 = 0.4;
input double in_term4b1 = 0.45;
input double in_term4c1 = 1;
input double in_term4d1 = 1.2;
//--- Output
input double out_term1a = 5;
input double out_term1b = 10;
input double out_term1c = 15;
input double out_term1d = 22.5;
input double out_term2a = 17.5;
input double out_term2b = 25;
input double out_term2c = 32.5;
input double out_term3a = 27.5;
input double out_term3b = 35;
input double out_term3c = 42.5;
input double out_term4a = 37.5;
input double out_term4b = 45;
input double out_term4c = 50;
input double out_term4d = 60;
input double min_tp = 10;
input double max_tp = 50;
In the next block we declare variables, names of headings, the actual template of the info panel (size, location, font and other), and set the parameters of displaying the element indicating the current bar (the arrow in our case).
int scaleX=55,scaleY=25,offsetX=35;
//--- declare array with indicator names
string signalName[]={"ADX_val:","RVI_val:","TP_plus:","TP_prc:"};
double adx,adx_di_minus,adx_di_plus,rvi,rvi_sig,mdm;
double Buffer[];
//+------------------------------------------------------------------+
//| Custom indicator initialization function                         |
//+------------------------------------------------------------------+
int OnInit()
  {
   if(fontSize>15 || fontSize<8)
     {
      Print("ERROR: Incorrect fontSize. Must be 8-15.");
      Alert("ERROR: Incorrect fontSize. Must be 8-15.");
      return(0);
     }
   if(Screen_corner>4 || Screen_corner<1)
     {
      Print("ERROR: Incorrect Screen_corner. Must be 1-4.");
      Alert("ERROR: Incorrect Screen_corner. Must be 1-4.");
      return(0);
     }
//---
   SetIndexStyle(0,DRAW_ARROW,EMPTY,1);
   SetIndexArrow(0,234);
   SetIndexBuffer(0,Buffer);
   ArrayInitialize(Buffer,0.0);
//---
   for(int y=0;y<4;y++)
     {
      ObjectCreate("lb_ind_nm"+string(y),OBJ_LABEL,0,0,0,0,0);
      //--- change anchor corner
      ObjectSet("lb_ind_nm"+string(y),OBJPROP_SELECTABLE,false);
      ObjectSet("lb_ind_nm"+string(y),OBJPROP_CORNER,Screen_corner);
      ObjectSet("lb_ind_nm"+string(y),OBJPROP_XDISTANCE,offsetX-30);
      ObjectSet("lb_ind_nm"+string(y),OBJPROP_YDISTANCE,y*scaleY+20);
      ObjectSetText("lb_ind_nm"+string(y),signalName[y],fontSize,"Tahoma",label_clr);
     }
//---
   for(int y=0;y<4;y++)
     {
      ObjectCreate("lb_ind0"+string(y),OBJ_LABEL,0,0,0,0,0);
      //--- change anchor corner
      ObjectSet("lb_ind0"+string(y),OBJPROP_SELECTABLE,false);
      ObjectSet("lb_ind0"+string(y),OBJPROP_CORNER,Screen_corner);
      ObjectSet("lb_ind0"+string(y),OBJPROP_XDISTANCE,scaleX+offsetX);
      ObjectSet("lb_ind0"+string(y),OBJPROP_YDISTANCE,y*scaleY+20);
      ObjectSetText("lb_ind0"+string(y),"",fontSize,"Tahoma",textColor);
     }
   return(INIT_SUCCEEDED);
  }
Now, let's have a look at the main block of processing signals from the ADX and RVI indicators.
The conditions are set under which indicator values satisfy the buy and sell signals. When they match, values are handled with the mamdani(double t, double v) function and displayed in the panel. All this has the following form: current indicator values showing that we received a buy or sell signal; recommended Take Profit (in points and numerical value).
//+------------------------------------------------------------------+
//| Custom indicator iteration function                              |
//+------------------------------------------------------------------+
int OnCalculate(const int rates_total,
                const int prev_calculated,
                const datetime &time[],
                const double &open[],
                const double &high[],
                const double &low[],
                const double &close[],
                const long &tick_volume[],
                const long &volume[],
                const int &spread[])
  {
   Buffer[num_bar]=High[num_bar]+20*_Point;
   adx=NormalizeDouble(iADX(_Symbol,PERIOD_CURRENT,adx_period,PRICE_CLOSE,MODE_MAIN,num_bar),_Digits);
   adx_di_plus=NormalizeDouble(iADX(_Symbol,PERIOD_CURRENT,adx_period,PRICE_CLOSE,MODE_PLUSDI,num_bar),_Digits);
   adx_di_minus=NormalizeDouble(iADX(_Symbol,PERIOD_CURRENT,adx_period,PRICE_CLOSE,MODE_MINUSDI,num_bar),_Digits);
//---
   rvi=NormalizeDouble(iRVI(_Symbol,PERIOD_CURRENT,rvi_period,MODE_MAIN,num_bar),_Digits);
   rvi_sig=NormalizeDouble(iRVI(_Symbol,PERIOD_CURRENT,rvi_period,MODE_SIGNAL,num_bar),_Digits);
//---
   if(adx>30 && adx_di_plus>adx_di_minus && rvi>rvi_sig && rvi<-0.1)
     {
      mdm=MathCeil(mamdani(adx,MathAbs(rvi)));
      ObjectSetText("lb_ind00","buy_signal: "+DoubleToString(adx,_Digits),fontSize,"Tahoma",textColor);
      ObjectSetText("lb_ind01","buy_signal: "+DoubleToString(rvi,_Digits),fontSize,"Tahoma",textColor);
      ObjectSetText("lb_ind02",DoubleToString(mdm,0),fontSize,"Tahoma",textColor);
      ObjectSetText("lb_ind03",DoubleToString(tp_prc(mdm),_Digits),fontSize,"Tahoma",textColor);
     }
   else if(adx>30 && adx_di_plus<adx_di_minus && rvi<rvi_sig && rvi>0.1)
     {
      mdm=MathCeil(mamdani(adx,rvi));
      ObjectSetText("lb_ind00","sell_signal: "+DoubleToString(adx,_Digits),fontSize,"Tahoma",textColor);
      ObjectSetText("lb_ind01","sell_signal: "+DoubleToString(rvi,_Digits),fontSize,"Tahoma",textColor);
      ObjectSetText("lb_ind02",DoubleToString(mdm,0),fontSize,"Tahoma",textColor);
      ObjectSetText("lb_ind03",DoubleToString(tp_prc(mdm),_Digits),fontSize,"Tahoma",textColor);
     }
   else
     {
      ObjectSetText("lb_ind00","no_signal",fontSize,"Tahoma",textColor);
      ObjectSetText("lb_ind01","no_signal",fontSize,"Tahoma",textColor);
      ObjectSetText("lb_ind02"," - ",fontSize,"Tahoma",textColor);
      ObjectSetText("lb_ind03"," - ",fontSize,"Tahoma",textColor);
     }
   return(rates_total);
  }
The function creates the fuzzy logic system. It contains two input signals from the indicators — trend and vigor (each of them consists of four terms described by membership functions), and one output signal. Four rules that input and output signals are connected with are also included in the system.
//+------------------------------------------------------------------+
//| Function of creating and calculating the system based on fuzzy logic     |
//+------------------------------------------------------------------+
double mamdani(double t,double v)
  {
   double res=0;
//--- Mamdani Fuzzy System
   MamdaniFuzzySystem *fsSignal=new MamdaniFuzzySystem();
//--- Create input variables for the system
   FuzzyVariable *fsTrend=new FuzzyVariable("trend",30.0,100.0);
   FuzzyVariable *fsVigor=new FuzzyVariable("vigor",0.1,1.0);
//--- ADX
   fsTrend.Terms().Add(new FuzzyTerm("low", new TrapezoidMembershipFunction(in_term1a, in_term1b, in_term1c, in_term1d)));
   fsTrend.Terms().Add(new FuzzyTerm("moderate", new TriangularMembershipFunction(in_term2a, in_term2b, in_term2c)));
   fsTrend.Terms().Add(new FuzzyTerm("medium", new TriangularMembershipFunction(in_term3a, in_term3b, in_term3c)));
   fsTrend.Terms().Add(new FuzzyTerm("high",new TrapezoidMembershipFunction(in_term4a, in_term4b, in_term4c, in_term4d)));
   fsSignal.Input().Add(fsTrend);
//--- RVI
   fsVigor.Terms().Add(new FuzzyTerm("low", new TrapezoidMembershipFunction(in_term1a1, in_term1b1, in_term1c1, in_term1d1)));
   fsVigor.Terms().Add(new FuzzyTerm("medium", new TriangularMembershipFunction(in_term2a1, in_term2b1, in_term2c1)));
   fsVigor.Terms().Add(new FuzzyTerm("high", new TriangularMembershipFunction(in_term3a1, in_term3b1, in_term3c1)));
   fsVigor.Terms().Add(new FuzzyTerm("higher",new TrapezoidMembershipFunction(in_term4a1, in_term4b1, in_term4c1, in_term4d1)));
   fsSignal.Input().Add(fsVigor);
//--- Create Output
   FuzzyVariable *fvSignal=new FuzzyVariable("signal",min_tp,max_tp);
   fvSignal.Terms().Add(new FuzzyTerm("low_take", new TrapezoidMembershipFunction(out_term1a, out_term1b, out_term1c, out_term1d)));
   fvSignal.Terms().Add(new FuzzyTerm("mod_take", new TriangularMembershipFunction(out_term2a, out_term2b, out_term2c)));
   fvSignal.Terms().Add(new FuzzyTerm("med_take", new TriangularMembershipFunction(out_term3a, out_term3b, out_term3c)));
   fvSignal.Terms().Add(new FuzzyTerm("high_take", new TrapezoidMembershipFunction(out_term4a, out_term4b, out_term4c, out_term4d)));
   fsSignal.Output().Add(fvSignal);
//--- Create four Mamdani fuzzy rule
   MamdaniFuzzyRule *rule1 = fsSignal.ParseRule("if (trend is low) and (vigor is low) then signal is low_take");
   MamdaniFuzzyRule *rule2 = fsSignal.ParseRule("if (trend is moderate) and (vigor is medium) then signal is mod_take");
   MamdaniFuzzyRule *rule3 = fsSignal.ParseRule("if (trend is medium) and (vigor is high) then signal is med_take");
   MamdaniFuzzyRule *rule4 = fsSignal.ParseRule("if (trend is high) and (vigor is higher) then signal is high_take");
//--- Add four Mamdani fuzzy rule in system
   fsSignal.Rules().Add(rule1);
   fsSignal.Rules().Add(rule2);
   fsSignal.Rules().Add(rule3);
   fsSignal.Rules().Add(rule4);
//--- Set input value
   CList *in=new CList;
   Dictionary_Obj_Double *p_od_adx=new Dictionary_Obj_Double;
   Dictionary_Obj_Double *p_od_rvi=new Dictionary_Obj_Double;
   p_od_adx.SetAll(fsTrend,t);
   p_od_rvi.SetAll(fsVigor,v);
   in.Add(p_od_adx);
   in.Add(p_od_rvi);
//--- Get result
   CList *result;
   Dictionary_Obj_Double *p_od_out;
   result=fsSignal.Calculate(in);
   p_od_out=result.GetNodeAtIndex(0);
   res=NormalizeDouble(p_od_out.Value(),_Digits);
//---
   delete in;
   delete result;
   delete fsSignal;
   return res;
  }
Let's proceed to the final block — "Additional functions". The first one — tp_prc(double take) converts Take Profit value in points to a numerical value of the current currency instrument price. The second one defines the number of signs in the current currency instrument.
//+------------------------------------------------------------------+
//| Function to determine the profit goals                                |
//+------------------------------------------------------------------+
double tp_prc(double take)
  {
   int tip;
   double opr,tp;
   take+=50;
   adx_di_plus=NormalizeDouble(iADX(_Symbol,PERIOD_CURRENT,adx_period,PRICE_CLOSE,MODE_PLUSDI,num_bar),_Digits);
   adx_di_minus=NormalizeDouble(iADX(_Symbol,PERIOD_CURRENT,adx_period,PRICE_CLOSE,MODE_MINUSDI,num_bar),_Digits);
//---
   if(adx_di_plus>adx_di_minus)
      tip=0;
   else if(adx_di_plus<adx_di_minus)
      tip=1;
//---
   switch(tip)
     {
      case 0:
         opr=Ask;
         break;
      case 1:
         opr=Bid;
         break;
     }
   if(MathMod(tip,2.0)==0.0)
     {
      tp=opr+take*Dig()*_Point;
     }
   else
     {
      tp=opr-take*Dig()*_Point;
     }
   return(tp);
  }
//+------------------------------------------------------------------+
//| Function to return the amount of decimal places      |
//+------------------------------------------------------------------+
int Dig()
  {
   return((_Digits==5 || _Digits==3 || _Digits==1)?10:1);
  }
//+------------------------------------------------------------------+
I would also like to draw your attention to the correctness of settings and re-verification of the parameter correctness in the section Fuzzy Logic Parameters while testing. I recommend to rely on their initial graphic representation in the fig. 3, 5, 6, since incorrect values can lead to errors and wrong operation of the entire system. Please be careful!
Conclusion
In conclusion, we are going to summarize what we've learned.
- The first part of work for creating a manual trading strategy with fuzzy logic lies in the development of strictly formalized rules of this strategy. This was examined at the stages No1 — No3.
- Then it is necessary to find disadvantages of the strict formalization where strict categorization of any estimated blocks or parameters applies. In the example provided, a part of the strategy that didn't allow us to determine the moment of market entry with enough flexibility was found.
- Further, all clear categories are described using fuzzy set theory and, thus, become more flexible. Now, in the boarder values there may be a belonging to not just one specific category as before, but to both simultaneously to a different extent.
- This strategy is implemented in the form of the indicator, panel or alert. In this article, a panel in MQL4 language was selected.