Trading signals module using the system by Bill Williams
VISUAL MARKETS SOFTWARE DEVELOPMENT CENTER - FZCO | 24 February, 2016
Introduction
The trading system by Bill Williams described in his book called "New trading dimensions" is certainly something that any trader is familiar with. This is one of the systems that contains clear and understandable rules for a majority of beginners. But the simplicity of rules is only apparent — the trading system comprises more than a dozen of trading patterns.
Many have attempted to create an Expert Advisor themselves based on this system, but pattern formalization, correct search and interpretation frequently prove difficult. In order to automate trading as well as identify and mark the system patterns, I have developed a module of trading signals for creating robots in MQL5 Wizard.
I aimed to create maximum convenience for those potential users of the MetaTrader 5 terminal, who may wish to study the trading system independently. The difference of the suggested trading module from other 60 published modules for MQL5 Wizard is that it contains configuration options with a visual interface.
So, these are the main features of the trading module:
- Adjusting settings of the trading system with a graphic panel.
- Ability to disable identification and marking of selected patterns.
- Ability to disable trading with selected patterns.
- Ability to optimize parameters of the trading system.
Structure (the source code is contained in the billwilliamsts.zip archive attached to this article):
- MQL5 CBillWilliamsTS class. Contains all logic of identifying system's trading patterns and logic of trading with found patterns. Marking found patterns on the trading instrument chart can be executed using the class (optional). The class is contained in the BillWilliamsTS.mqh file.
- MQL5 CBillWilliamsDialog graphic panel class. It is intended to display the settings panel for interactive management of the CBillWilliamsTS class object. The class is contained in the BillWilliamsPanel.mqh file.
- MQL5 SignalBillWilliams class. The trading signal module used in MQL5 Wizard for automated creation of an Expert Advisor.
- MQL5 BillWilliamsEA Expert Advisor. A trading expert developed on the basis of trading classes and the graphic panel. It is intended for automated trading with patterns of the trading system by Bill Williams and is contained in the BillWilliamsEA.mq5 file.
The materials are provided in the following order:
- Brief description of the trading strategy by Bill Williams, trading patterns used, and marking performed by the developed Expert Advisor.
- Description of the graphic panel.
- Results of testing on various trading instruments.
1. Brief overview of the trading system by Bill Williams
1.1. General information
In his book "New trading dimensions", Bill Williams claims that it is necessary to know the market structure to achieve profitable trading results on financial markets. From the author's point of view, the market has five dimensions, that, if studied cumulatively, can help you get the true picture and take up to 80% of the trend movement from the market:
- The fractal (phase space)
- Momentum (phase energy)
- Acceleration/deceleration (phase force)
- Zone (phase energy/force combination)
- Balance line
In addition to five dimensions, Bill Williams introduces well-known market conditions — trend and flat. To identify them, the system's author suggests using the Alligator indicator, that he developed, and working only at the trending market areas.
Elements of the trading system, trading patterns based on them, and peculiarities of marking found signals, using the developed module of trading signals, are considered further in the article.
1.2. Alligator
The Alligator indicator is a combination of three moving averages (Figure 1):
- Jaws, slow line (blue), normally is a 13-period moving average;
- Teeth, average line (red), normally is an 8-period moving average;
- Lips, fast line (green), normally is a 5-period moving average;
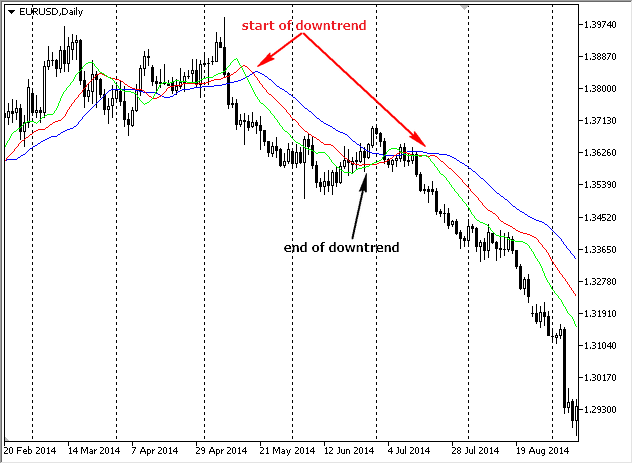
Fig. 1. Alligator
According to the system, trading operations must be executed only when the Alligator lines are arranged towards the trend in a descending order of their period value: price, lips, teeth, jaws. The figure shows the beginning and the end of the downtrend.
It's obvious that the Alligator is a severely delayed indicator, the same with all other indicators on the basis of moving averages. However, the intersection of moving averages doesn't act as a signal for a market entry, but only filters executed trades.
1.3. Fractals - signals of the first market dimension
Fractal is a formation consisting of 5 candles. Sell fractal is a fractal where the Low price of the average candle is minimum. Buy fractal, on the other hand, is a fractal where the High price of the average candle is maximum. Fractals are also called the first market dimension (dimension 1):
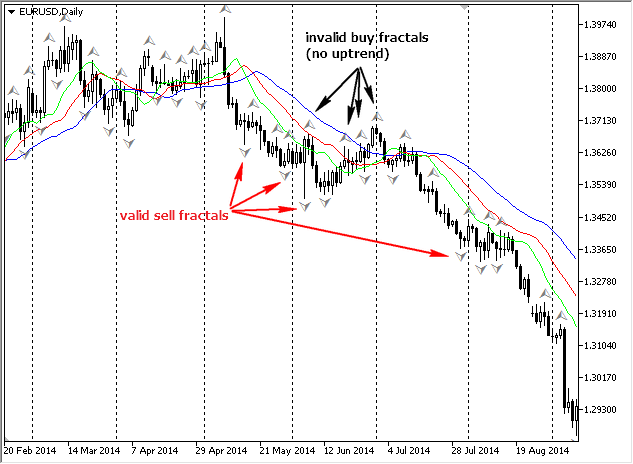
Figure 2. Fractals
A fractal is considered valid if it is formed above the Alligator's average line (teeth) for an uptrend, and below the average line for a downtrend.
The developed Expert Advisor marks valid fractals in the following way (FrB — FractalBuy — valid buy fractals, FrS — FractalSell — valid sell fractals):
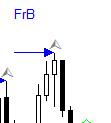
Figure 3. Valid buy fractal
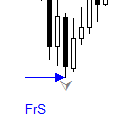
Figure 4. Valid sell fractal
A Buy Stop pending order is positioned 1 pip higher than the bar's maximum, where the valid buy fractal is formed. A Sell Stop pending order is positioned 1 pip lower than the bar's minimum, where the valid sell fractal is formed. Additional positions (by fractals and other indicators) are opened only after overcoming the first fractal when the Alligator changes the trend.
1.4. Awesome Oscillator — AO — signals of the second market dimension
1.4.1. General information
The awesome Oscillator (AO) determines the momentum of the market. It is the difference between the 34-period SMA and the 5-period SMA, that are calculated with central values of bars. On the chart, the indicator is presented as a histogram:
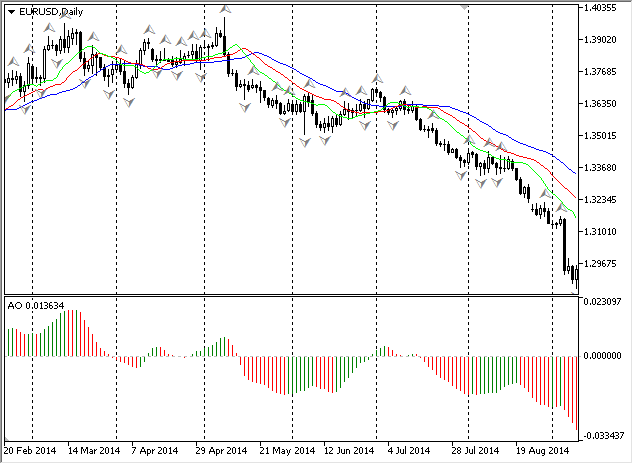
Figure 5. Awesome Oscillator
There are 6 patterns based on the oscillator in the trading strategy. Their descriptions and marking via the Expert Advisor are presented hereinbelow.
1.4.2. "Saucer" buy pattern

Figure 6. "Saucer" buy pattern
The pattern consists of three columns. The first column must be higher than the middle column and can be of any color. The middle column must be red. The third column (signal) must be green. The signal is displayed by the Expert Advisor on the AO indicator and is referred to as DiB (Dish Buy).
1.4.3. "Saucer" sell pattern

Figure 7. "Saucer" sell pattern
The pattern consists of three columns. The first column must be lower than the middle column and can be of any color. The middle column must be green. The third column (signal) must be red. The signal is displayed on the AO indicator by the Expert Advisor and is referred to as DiS (Dish Sell).
1.4.4. "Zero line crossing" buy pattern

Figure 8. "Zero line crossing" buy pattern
The signal appears when the histogram crosses the zero line above. The column that crosses the zero line is the signal column. The signal is displayed on the AO indicator by the Expert Advisor and is referred to as CrB (Cross Buy).
1.4.5. "Zero line crossing" sell pattern

Figure 9. "Zero line crossing" sell pattern
The signal appears when the histogram crosses the zero line below. The column that crosses the zero line is the signal column. The signal is displayed on the AO indicator by the Expert Advisor and is referred to as CrS (Cross Sell).
1.4.6. "Twin peaks" buy pattern
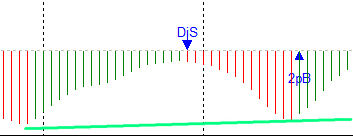
Figure 10. "Twin peaks" buy pattern
The buy signal is formed when the histogram is below the zero line, and the last bottom of the indicator is above the previous one. Herewith, between these extremums the histogram didn't rally above zero. The signal is displayed on the AO indicator by the Expert Advisor and is referred to as 2pB (2 peak Buy).
1.4.7. "Twin peaks" sell pattern
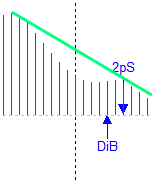
Figure 11. "Twin peaks" sell pattern
The sell signal is formed when the histogram is below the zero line, and the last peak of the indicator is below the previous one. Herewith, between these extremums the histogram didn't rally below zero. The signal is displayed on the AO indicator by the Expert Advisor and is referred to as 2pS (2 peak Sell).
1.4.7. Setting orders
When the buy signal column appears, a Buy Stop pending order is set 1 pip higher than the signal bar maximum. When the sell signal column appears, a Sell Stop pending order is set 1 pip lower than the signal bar minimum.
1.5. Acceleration/Deceleration Oscillator — AC — signals of the third market dimension
The Acceleration/Deceleration (АС) histogram is the difference between the Awesome Oscillator histogram and 5-period moving average on the Awesome Oscillator:

Figure 12. AC Oscillator
The buy signal is formed if two consecutive columns with higher values than the last smallest column (the histogram is above the zero line) appear; if the histogram is below the zero line, then three consecutive green columns (figure 13, B signal — Buy) must be formed.
The sell signal is formed if two consecutive columns with lower values than the last highest column (the histogram is below the zero line) appear; if the histogram is above the zero line, then three consecutive red columns (figure 13, S signal — Sell) must be formed.
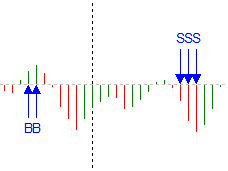
Figure 13. Patterns of the AC Oscillator
The signal is displayed on the AC indicator by the Expert Advisor and is referred to as S (Sell) or B (Buy). When the buy signal column appears, a Buy Stop pending order is set 1 pip higher than the signal bar maximum. When the sell signal column appears, a Sell Stop pending order is set 1 pip lower than the signal bar minimum.
1.6. Zone trading — signals of the fourth market dimension
Bill Williams introduces the term of trading zones: green and red. If the current columns АС and АО are green, the price is positioned in the green zone. If the current columns АС and АО are red, the price is in the red zone.
To open new buy positions in the green zone (sell positions in the red zone) at least two green (red) bars in a row are required, and the closing price of the second bar must be higher (lower) than the closing price of the previous bar. However, after five green or red bars in a row, positions are no longer opened.
In case the fifth green (red) bar appears, it is necessary to place a Stop Loss order 1 pip lower than the minimum (higher than the maximum) price of the fifth bar. If the pending order is not executed at the following bar, then it must be changed to the level that is 1 pip lower than the minimum (higher than the maximum) price of the sixth bar, and so on.
Zone trading signals are displayed on the AC indicator as ZS (Zone Sell) and ZB (Zone Buy) (normally they match the signals from the AC indicator):
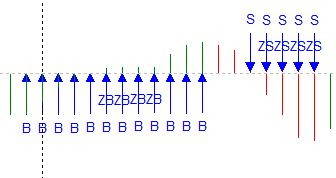
Figure 14. Zone trading signals
1.7. Trading from the balance line — signals of the fifth market dimension
The "buying above the balance line" pattern is formed by two bars when the price is higher than the Alligator indicator. If the opening price of the zero bar (it is also the maximum price of this bar at this moment) is lower than the first previous maximum bar price (can be found few bars behind), then the found maximum price will be the price for opening a buy position for the green zone. If the price is lower than the Alligator line, then one more maximum above the entry price in the green zone is required.
Selling below the balance line is inverse.
The logic of trading from the balance line is described in more details in the article "Expert Advisor based on the book by Bill Williams".
The Expert Advisor marks patterns with a horizontal line in the place of setting a pending order:
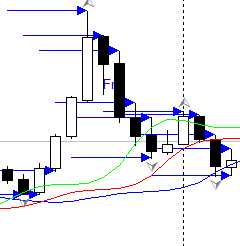
Figure 15. Places for setting pending orders
1.8. Closing positions
Bill Williams has proposed several ways of closing positions:
- If the bar crosses Alligator's teeth (red line) with a closing price, when a trend exists on the market, then positions must be closed;
- Stop Loss is set after five bars in a row appear in the green (red) zone under the extremum of the last bar;
- If a signal in the opposite direction appears, then all opened positions must be closed.
2. Graphic panel
2.1. General information
The interface of the graphic panel is shown below:
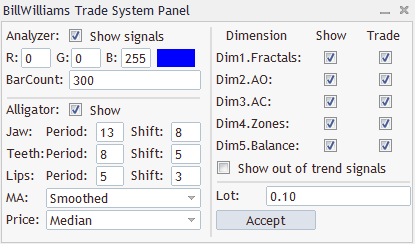
Figure 16. Graphic panel to manage the Expert Advisor
The graphic panel consists of four logical blocks:
- Analyzer settings;
- Alligator settings;
- Settings for displaying and trading by signals of five dimensions;
- Settings for trading.
After changing settings press "Accept" button to save them.
2.2. Analyzer settings
- Show Signals — option for displaying found patterns based on the trading strategy by Bill Williams;
- RGB — color settings to display found patterns;
- Bar count — calculation of the given amount of history bars to mark the chart (if a zero value is given, then the whole chart is marked).
2.3. Alligator settings
Alligator settings are the standard settings of this indicator. There is an additional option to disable the display of this indicator ('Show' parameter).
2.4. Settings for displaying and trading with signals of five dimensions
- Fractals (Dim1.Fractals line);
- AO (Dim2.AO line);
- AC (Dim3.AC line);
- Zone trading (Dim4.Zones line);
- Trading from the balance line (Dim5.Balance line).
Additionally, there is an option to display all signals irrespective of the current trend ('Show out of trend signals' parameter).
2.5. Trading settings
Trading settings have only one parameter – the Lot size.
2.6. Main window
The interface of the working chart is shown below (settings panel is minimized):

Figure 17. Main window
3. Creating Expert Advisor in the MQL5 Wizard
3.1. Preparation
Before creating an Expert Advisor you must download the attached archive billwilliamsts.zip and copy its files to the relevant folders of the trading terminal's data catalog.
3.2. Creating Expert Advisor
The following steps must be performed for an automated Expert Advisor generation:
Select "New" in the MQL editor, and when a new window appears select "Expert Advisor (generate)":

Figure 18. Creating Expert Advisor — step 1
Enter a name of the Expert Advisor that you wish to create:
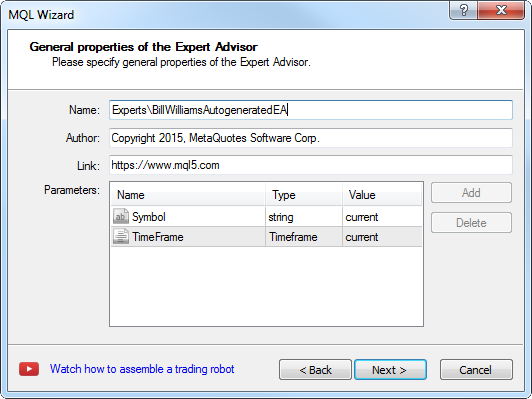
Figure 19. Creating Expert Advisor — step 2
The next step requires adding the signal generator used:
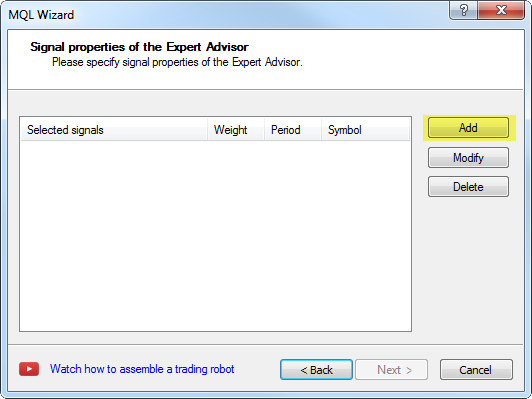
Figure 20. Creating Expert Advisor — step 3
Select "Signal of BillWilliams trading system" as a signal generator:
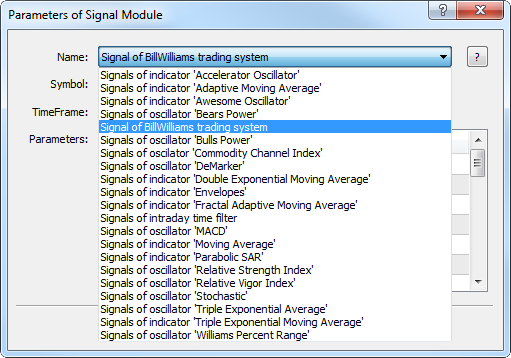
Figure 21. Creating Expert Advisor — step 4
The next step is confirmed without changes:
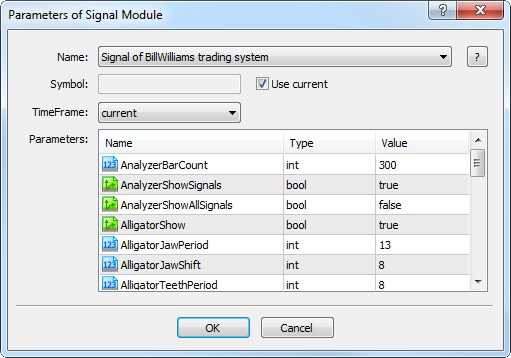
Figure 22. Creating Expert Advisor — step 5
Selection of a trading signal module is confirmed further:
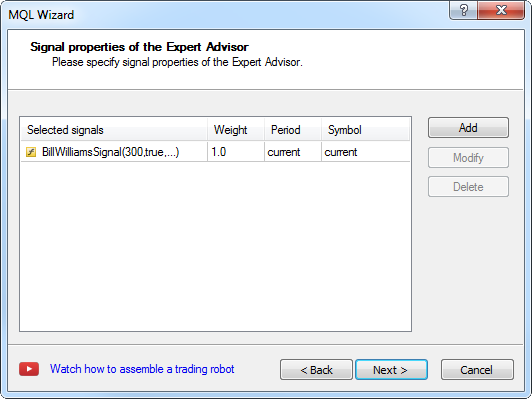
Figure 23. Creating Expert Advisor — step 6
Trailing Stop parameters are set, if necessary:
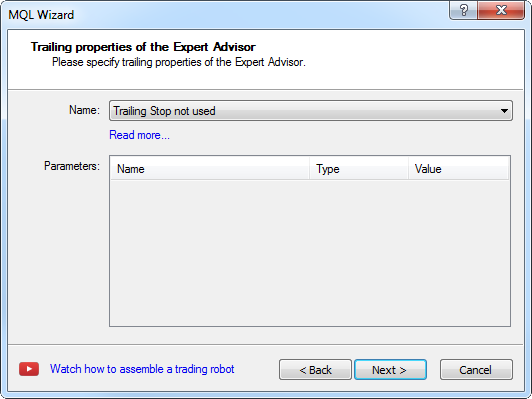
Figure 24. Creating Expert Advisor — step 7
Then, money management parameters are set:
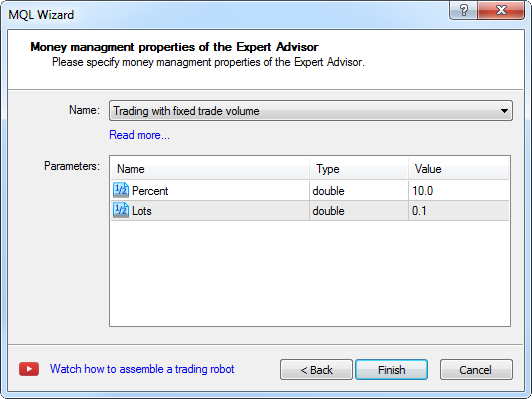
Figure 25. Creating Expert Advisor — step 8
The file of the created Expert Advisor must be edited, so that it could react to changes of parameters in the trading panel:
It is necessary to find this section of the code in the file:
//--- Creating filter CBillWilliamsSignal
CBillWilliamsSignal *filter0=new CBillWilliamsSignal;
And change it to:
filter0=new CBillWilliamsSignal;
Declare the filter0 global variable:
//+------------------------------------------------------------------+
//| Global expert object                                             |
//+------------------------------------------------------------------+
CExpert ExtExpert;
CBillWilliamsSignal *filter0;
And add the chart's event handler:
void OnChartEvent(const int id,
                  const long &lparam,
                  const double &dparam,
                  const string &sparam)
{
  filter0.ChartEvent(id,lparam,dparam,sparam);
}
The created Expert Advisor is now ready to be used.
3.3. Restrictions
The Expert Advisor that was created in Wizard has restrictions imposed by the Standard library API:
- There is no ability to scale the position, if it is already open (improvement to the standard library is required);
- The Expert Advisor trades only market orders.
To eliminate these disadvantages an additional Expert Advisor BillWilliamsEA.mq5, also placed in the attached file, was developed based on the class of trading signals.
4. Test results
4.1. EURUSD D1, 2015
4.2. EURUSD D1, 2010 - 2015
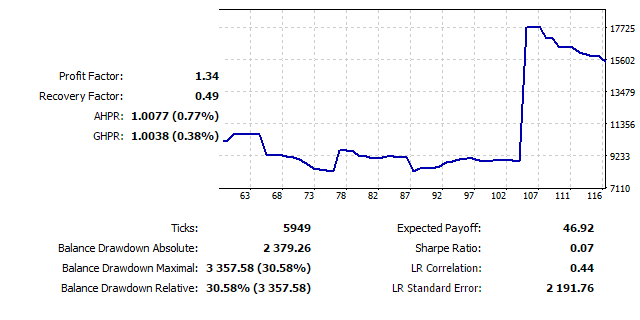
Figure 27. Testing chart EURUSD D1, 2010-2015
Detailed results are in the EUR-D1-2010-2015.zip file.
4.3. EURJPY D1, 2010 - 2015
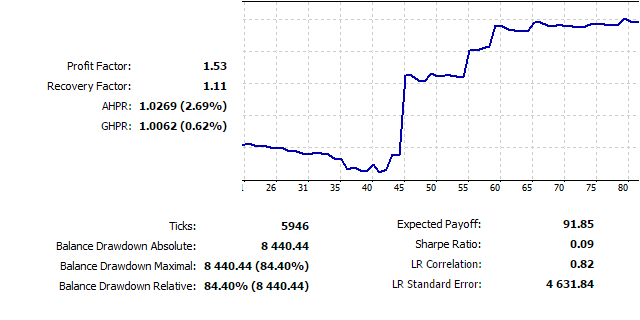
Figure 28. Testing chart EURJPY D1, 2010-2015
Detailed results are in the EURJPY-D1-2010-2015.zip file.
Conclusion
According to the testing results, we may conclude that the Expert Advisor performs well in trending sections, however, is below break-even on the flat market (in fact, this is a typical situation that Bill Williams has mentioned himself).
