
Fallacies, Part 1: Money Management is Secondary and Not Very Important

Introduction
In this article we will discuss very simple things that can very often be deceptive - the graphs of an account balance in the testing report. In reports of strategy testing by beginners we can often see exponential balance/equity graphs and multibillion results by the end of the testing period. Such results usually invoke skeptical comments of experienced EA writers who know where these exponents come from, and immediately recommend to show results on a fixed lot (usually 0.1).
It is assumed that testing results with the fixed 0.1 lot better reflect all advantages and disadvantages of a strategy. Arguments for this assumption are quite clear: for most of currency pairs this graph shows how many points a strategy makes within a testing period. There is a justified opinion that a strategy may be considered challenging if it is profitable by points; but if a mathematical expectation is negative, such a strategy can hardly become profitable only by means of money management.
One more convincing argument: a curve of "0.1 lot" close to a straight line is a kind of indication of a strategy stability which can hardly be seen on an exponential graph.
However, despite all advantages, such graphs have disadvantages, which are not so obvious. To understand all this let us analyze testing results of a simple strategy with different money management systems and compare graphs.
Types of Money Management (MM) Analyzed in the Article. Selecting an EA
Now we will analyze 3 types of MM, in which the volume of opened positions is either fixed or is an increasing function of a deposit. The possibility of an efficient MM taking into account results of previous trades seems reasonable to me only when the probability of a profitable/lossmaking series is considerably higher than the chance that trades with opposite results will alternate. So, here are MMs described in the article:
- Lot is fixed irrespective of deposit size and is equal to 0.1. Let's call this strategy conservative. In the article it will be denoted like "lot 0.1" or "0.1".
- Lot is proportional to deposit. This is aggressive money management. We will call it "geometrical MM".
- Lot grows proportionally to the square root of a deposit. Let's call it a moderate strategy.
Let's analyze the Expert Advisor "20_200 expert_v4.2_AntS". We will not optimize the EA by parameters, because it is out of the scope of this article; let's use default parameters of the Expert Advisor. We will test it on all ticks on EURUSD H1 from 2000/06/07 to 2008/03/15. This period of testing was selected intentionally to have a quite good balance graph in testing at 0.1 lot. Exactly this EA is selected to demonstrate the main statements of this article. The source code of the EA is located at https://www.mql5.com/en/code/7891 .
The larger part of the Expert Advisor is the function for selecting lot LotSize() a little longer than 1000 lines (or 44K out of 50K of the source file size), which partially conditions its singularity. This function could be implemented in a much shorter form if we approximate the function of lot dependence on a balance by a simple line with the necessary lot rounded to 0.01. At least the difference of the approximation from calculations in the source code in "nodes" (points of lot measuring) shows up only in one node out of thousand (!!!). It can hardly influence parameters of the strategy.
I decided not to study the exact logic of selecting lot size and changed the code thus making the file much smaller (initially the EA code contained only active MM corresponding to this function of lot selection). Parts connected with the non-proportional lot increase were also excluded from the code thus excluding elements of martingale from the EA. The changed code of the EA is attached to the article.
Below is the function of lot size calculation suitable for EURUSD here:
double LotSize()
{
   double size;
   switch( _MM )
   {
      case 0:  size = 0.1;
               break;
      case 1:  size = 0.1 * AccountBalance() / 1000;
               break;
      case 2:  size = 0.1 * MathSqrt( AccountBalance() / 1000 );
               //size = 1. * MathSqrt( AccountBalance() / 10000 );
               break;
      default: size = 0.1;  break;
   }
   if( size < 0.1 )          // is money enough for opening 0.1 lot?
      if( ( AccountFreeMarginCheck( Symbol(), OP_BUY,  0.1 ) < 10. ) ||
          ( AccountFreeMarginCheck( Symbol(), OP_SELL, 0.1 ) < 10. ) ||
          ( GetLastError() == 134 ) )
                  lot = 0.0; // not enough
      else        lot = 0.1; // enough; open 0.1
   else           lot = NormalizeDouble( size, 2 );

   return( lot );
}
Assumptions in the Article
Further in the article we will follow the logics of a typical beginner:
- A beginner visits the Forum, enters Code Base, sees exactly this EA and decides to see what the EA is apt to. He is not interested in the details of the source code; he needs a quick result.
- The beginner is not interested in the question of reliability of testing results relative to the changeability of history; he only chooses a testing period starting several years ago till the present moment in which the EA shows quite good results. He believes the EA will behave the same in future, because for almost 8 years it has showed good results.
- Having received results of testing on the fixed 0.1 lot he visits the Forum and sees typical answers of experienced forum visitors that testing at 0.1 lot shows rather truthful results of the strategy stability, makes a step forward and decides to introduce geometric money management, i.e. to open positions, the sizes of which are proportional to balance size. He also does not think that actually stop-loss is much larger than take-profit because he hasn't seen the code. He is not sure of how the balance curve will change.
- And finally, our beginner tries to modify MM and invents the third MM type described above.
We will analyze obtained results and the beginner's actions mainly observing several integral parameters of testing results - net profit, maximal drawdown in percents and recovery factor.
Test 1: Fixed lot, "0.1"
Here are the results of testing:
Strategy Tester Report 20_200 expert_v4.2_AntS
Alpari-Demo (Build 215)
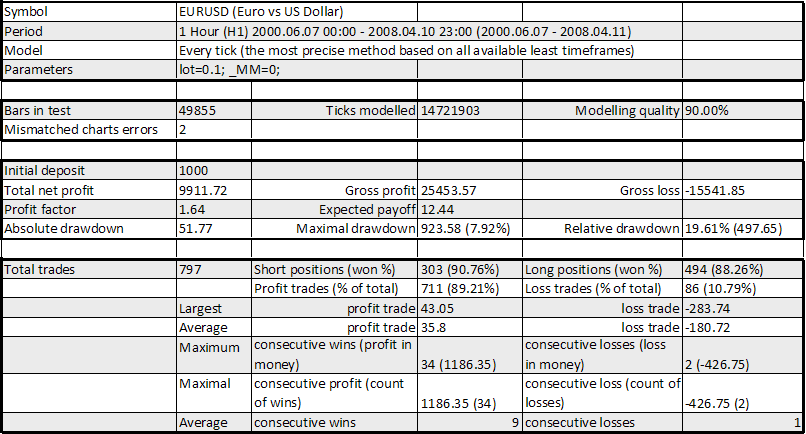

Expert Advisor 20_200 expert_v4.2_AntS, lot 0.1
We will add one more parameter - recovery factor:
RF (Recovery Factor) = Total Net Profit / Maximal Drawdown = 9911.72 / 923.58 = 10.73
The curve looks not bad, RF is also OK, though it is for almost 8 years. All other parameters in the table are also quite good: mathematical expectation is 12.44 points (it can be larger, but this is is not so bad), maximal drawdown is about 20%. The ratio of an average profit trade to average loss trade is equal to 35.80/180.72 = 0.198 = 1/5.05; however the number of profitable trades is larger than that of loss trades (89.21%/10.79%, i.e. by 8.27, which is higher than 5.05). Thus a strategy seems to have something in store.
This gives confidence to our beginner and he decides to take the risk: instead of a fixed lot he introduces the geometrical money management based on a "modest" proportion "0.1 lot / $1000 of deposit". It is much riskier than the proportion offered in the original EA (a little more than 1/3 lot for $10000 of deposit), but our hero does not pay attention to it: he wants to earn as much money as possible...
Test 2, Part 1: Lot proportionate to balance, «0.1/$1000»
I have left several lines in the report that may be interesting to us.
Strategy Tester Report 20_200 expert_v4.2_AntS
Alpari-Demo (Build 215)
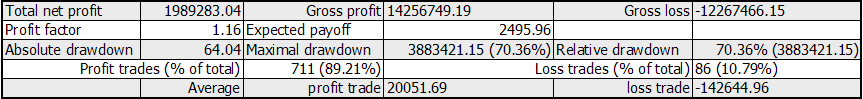

Expert Advisor 20_200 expert_v4.2_AntS, geometrical MM
For better visualization I have recorded a video file that helps to trace the process in dynamics: the final statistic result for geometrical MM often looks much better than it is in reality because of details evening out. The video perfectly illustrates intermediate drawdowns that look like unimportant dints in the fig. You see, these intermediate drawdowns are not so small and reach sometimes 50%of the achieved balance maximum (actually, the point is not in the last drawdown received after the balance has reached its absolute maximum):
Geometrical MM in dynamicsDue to conversion features unknown to me the video should be watched up to the 34th second; after the message about a testing mode is displayed the repeated end is shown.
You see, the situation is much worse now: visually the graph is not so attractive, and the parameters we're interested in have also changed. We will not discuss whether the volume of the deal opened at balance peak (about 540 lots!) is real for brokerage companies. We see that net profit increased greatly, but the maximal drawdown is more than 70%, and the recovery factor
RF = 1989283.04 / 3883421.15 = 0.51 –
has critically fallen and is now less than one! Of course, such a poor RF is the result of the last drawdown, but we are not interested in self-deception, and we're not going to exclude the drawdown from the report, right?! This situation is already described in the famous article "My First 'Grail'", which is probably the most quoted article in the Forum.
This is a double lesson for a beginner who has accepted the replies of "the experienced" who invariably request results of testing at the fixed lot 0.1. So testing "at 0.1" appears to be deceptive: despite the evident demonstration of the positive mathematical expectation and stability of the strategy at 0.1 lot, generally it is not enough for adding an aggressive MM while relying on the positive mathematical expectation which "should" help.
The reason for such a sharp change of the curve character and its parameters is evident: when testing "at 0.1" the deposit growth is accompanied by the diminishing of a relative risk, because the lot size relative to deposit decreases upon hyperbola. And in case of a geometric MM the risk doesn't get lower and stays fixed. This explains the highly increased depth of "dints" at the end of the testing period.
There is one more observation: the ratio of average profit trade to average loss trade also has become worse. Now it is equal to 20051.69/142644.96 = 0.141 – instead of 35.80 / 180.72 = 0.198 in the previous "0.1" test. Why? The answer follows: the loss at the geometrical MM is calculated of a lot size at an account balance corresponding to the moment of trade opening, i.e. in the upper point of the falling balance trajectory. At the same time the volume of a profit trade is calculated due to the balance at the moment of its opening, i.e. in the lower point of the balance trajectory, and it appears to be a little less than for the losing trade.
A numerical example: suppose that at the balance equal to $5000 and geometrical MM we have opened a trade with the volume 0.1*($5K/$1K) = 0.5 lots and gained the 100 points profit. It means the profit for EURUSD is equal to $500. Now suppose we immediately open a trade that brings the 100 pts loss. What is our loss? Lot is equal to 0.1*($5K+$500)/$1K = 0.55, i.e. our loss is -$550, which is 10% more than profit. This didn't happen in the first case with a fixed lot!
What conclusions can we draw?
- If you look to an aggressive (geometric) MM, then in order to get a really good balance curve, you should clearly understand that the corresponding curve of testing at 0.1 lot should be practically ideal, without "dints". Do not disregard any of MM variants that you are going to use in live trading. Don't be guided only by "0.1 testing" if your MM is to be different.
- Don't forget that geometrical MM usually increases drawdown percentage. Suppose testing at 0.1 lot in a five-year period shows deposit growth by 1000% (from $1K to $11K). By the way, it is quite a realistic value: it corresponds to 10 thousand points for 60 months, i.e. 167 points per month. Suppose by the end of the 5-year period when the deposit equals to $11K you had a very little drawdown at 0.1 lot - 5%, and after that the last trade was profitable, and the deposit now is again equal to $11K. What do you think the drawdown will be with the geometrical MM? 55% of your deposit – irrespective of by how much it had increased before this "dint"! The explanation will go further.
- So, here is the recommendation: choose "the golden mean" in your MM strategies. It doesn't mean that you should always use 0.1 lot, but geometrical MM on million worth trades is only a dream connected with underestimation of the risk.
The proof of geometric MM drawdown arguments: if during testing at 0.1 lot the drawdown by the period end (when the balance before a loss trade is equal to $11K) is equal to 5%, it means it is equal to 5%*$11K = $550, i.e. 550 points. Now let's calculate the same with the geometric MM.
If this drawdown results from the only one one opened position (for example, there is no stop loss), our reasoning is simple: suppose before this drawdown in the "geometrical MM" the balance has reached X*$1K (due to this MM, X is likely to be more than 11 but here it is unimportant). Then the X*0.1 lots trade is opened and then closed with the loss equal to lot*pips_value*pips = (X*0.1)*$10*550 = $550*X, which is equal to 100%*($550*X)/(X*$1K) = 55% of deposit before this drawdown.
The case when this drawdown is the result of several sequencing loss trades is more difficult, but formally these trades can be approximately joined into one trade, and this drawdown may be considered a result of one trade; however because of the effect of accumulation of numerous opposite trades the result will be a bit different.
This reasoning was obtained exactly in the process of the article being written, when I tried to explain logically testing results of geometrical MM; the radicality of the result still amazes me. Before this moment I was so naive to believe that to any strategy showing at 0.1 lot an attractive curve with small drawdowns even an aggressive MM can be added - but I've never thought that drawdowns will grow so disproportionately as compared to those demonstrated in "0.1 testing". And now I am absolutely skeptical about a long used geometrical MM. The reason is that there is no strategy without drawdowns...
Test 2, Part 2: Lucky EA and geometrical MM
Let's consider another astonishing example that proves our arguments about drawdown. This is a lesson to the authors of the EA 'Lucky" who expect to use it with geometrical MM (this is the initial intention: see the source code at https://www.mql5.com/en/code/7464):
double GetLots()
{
   return (NormalizeDouble(AccountFreeMargin()/10000,1));
}
The Expert Advisor is slightly modified for testing at 0.1 lot and uses take-profit larger than 1 pip (with the external parameter Pr_limit=1). Besides, as distinct from the source code, in the EA only 1 order may be open at a time (for this case it does not very greatly change the balance curve character). We are not interested, whether the EA will work with a real brokerage company, it is not our purpose. A changed EA code is attached to the article.
Testing is performed with parameters Shift=4, Limit=10, Pr_limit=1 with a fixed 0.1 lot in the history period from 2004.01.01 to 2008.04.04 (initial deposit is $1K). Here is its balance curve:

Expert Advisor Lucky, "0.1"
This curve contains a tiny "dint" that is visible only in the tester but invisible in the fig.: it is in the period from 2004/12/31 to 2005/01/07 for order numbers from 57890 to 58857. Let's analyze the "dint" in details limiting the total testing interval for this period (lot is still fixed and equal to 0.1; the initial balance in this part is unimportant and assumed equal to $1000 because we are interested in the drawdown size in points):

Expert Advisor Lucky, "0.1", "microscopic" examination
We can see that the maximal balance is approximately equal to $1050 and the minimal one to $690. Drawdown with 0.1 lot is equal to $360, i.e. 360 points. Conducting simple calculations analogous to those described above, we obtain that with the geometrical MM this value is transformed into almost 36% drawdown! Let's prove it in practice by testing the same short period with geometrical MM (rounding off accuracy in GetLots() is 0.01, i.e. 2 digits):

Expert Advisor Lucky, geometrical MM in the same period
The real drawdown is about 32% (because it results not from a single order), however what the hell we see here! An almost invisible dint in the center of a chart (with 0.1 lot the drawdown is approximately equal to 360/68000 ~ 0.5%) has grown in relative figures by more than 60 times! And this is apart from the drawdown at the period end, which is only 0.89% with "0.1" but 1660 in points; this drawdown will practically kill the deposit - but it is not so efficient now...
And now let's create an artificial example that, at first sight, is incompatible with common sense.
Paradoxical Example. A Superficial Investigation
Based on the observation that two consecutive trades with results in points identical in module but opposite in the sign can make loss at a considerably aggressive MM, we can construct such a balance curve of a stable growth when tested with 0.1 lot, which, when tested with the geometrical MM radically changes its character and turns into a curve of a stable falling trend! The graphs created by means of MS Excel are shown below.
The example is based on the idea that our trades alternate by their results (profit/loss): first we have a trade with 100 point profit and then goes the losing trade in which the loss is calculated so that with the geometrical MM we have the loss as the total of two operations - while with "0.1" MM we have the profit in total.
Limitations of brokerage companies regarding minimal lot size and its minimal increment are taken into account (0.1 and 0.01 correspondingly, according to the terms by Alpari-IDC). That is why in any case the deposit will not become much less than $1000 because of the limitation resulting from the minimal lot size, i.e. 0.1. Ant this is why, in order to avoid such a "boundary effect", the initial deposit is taken 10 times larger than the previous one, $1000.
What we get: despite the fact that with a profit in 100 points there is a loss value precisely calculated in points, at which the geometrical MM makes loss exactly equal to the profit gained before this, still in reality there is a certain range of loss trade values, in which the balance enters a cycle of stable values in a certain limited range. I do not know the reason yet. Below you see the illustrations; the initial deposit is always $10000, profit trade - 100 points, proportion of the geometrical MM - 0.1 lot per $1K of the deposit.
Loss trade - 91 points (profit trade is larger than the loss trade by 9 points)
The upper picture shows both curves for different MMs. Below the same balance curve with 0.1 lot is zoomed in to show its saw-toothed character. Further the second graph will not be shown, because its character is always analogous to this one.
The figure with mathematical expectation of loss equal to 91 is shown to illustrate "threshold" of a loss trade, at which a formally profitable system with the "0.1" MM turns into a profitless and lossless system when used with the geometrical MM.

Loss 91, geometrical MM 0.1/$1000

loss 91, lot = 0.1
Loss trade - 92 points (profit trade is larger than the loss trade by 8 points)

Loss 92, geometrical MM 0.1/$1000
Loss trade - 93 points (profit trade is larger than the loss trade by 7 points)

Loss 93, geometrical MM 0.1/$1000
Loss trade - 94 points (profit trade is larger than the loss trade by 6 points)

Loss 94, geometrical MM 0.1/$1000
Loss trade - 96 points (profit trade is larger than the loss trade by 4 points)

Loss 96, geometrical MM 0.1/$1000
You see, the curves outlooks are opposite. Of course, a live system can hardly be so "stable", but I have included this example only to illustrate what can happen if we do not consider a chart of testing with "0.1 lot" very critically.
Now let's see what will happen if we make the geometric MM more aggressive (for example 0.2 or even 0.33 lot per $1K of deposit; you can meet such cases in the Forum). Further you will see charts belonging only to boundary values of loss trades (a profit trade is still equal to 100 points): if a loss trade exceeds a boundary value, the behavior of curves at a geometrical MM even worsens.
Loss trade - 84 points (profit trade is larger than the loss trade by 16 points). MM - geometrical, 0.2 lot/$1K of deposit.

Loss 84, geometrical MM 0.2/$1000
Loss trade - 75 points (profit trade is larger than the loss trade by 25 points). MM- geometrical, 0.33 lot/$1K deposit.

Loss 75, geometrical MM 0.33/$1000
Conclusion: higher aggressiveness of a strategy with the unchanged mathematical expectation of a profit trade sets higher requirements to the strategy: the mathematical expectation of a trade in points must be increased. We can determine a formula defining a threshold value of a loss trade in points (loss) with the following parameters:
- profit of a profitable trade (profit),
- aggressiveness of the geometrical MM (aggr), i.e. position volume in lots per each $10K of a deposit,
- value of 1 point for 1 lot of a security (pointval).
To prove the formula we need only to open the first two trades, starting from the deposit $10K, and then this correlation will be fulfilled irrespective of an obtained deposit (it is proved a little earlier, because the X parameter is canceled).
- The first trade brings profit: deposit is equal to $10K. Open a position with the volume equal to aggr lots. We gain profit equal to aggr * profit * pointval. Close the trade.
- Open the second trade, it makes loss. By the time of the trade opening the deposit is equal to $10000+ aggr*profit*pointval = $10K*(1+ aggr*profit*pointval/10000). Trade volume is aggr*(1+ aggr*profit*pointval/10000). The desired trade loss in dollars is equal to aggr*(1+ aggr*profit*pointval/10000) * loss * pointval.
- Equate the two obtained expressions and get a formula for loss:
loss = profit / (1+ aggr*profit*pointval /10000)
Let's check the correctness of the formula on EURUSD (pointval=$10):
- if profit=100, aggr=1 we obtain loss = 100/(1+1*100*10/10000) = 100/1.1 ~ 90.91 pips. As found earlier, the threshold value in this case is equal to 91 points (see the first chart);
- if profit=100, aggr=2 we obtain loss = 100/1.2 ~ 83.33. The threshold value obtained earlier in an experiment is equal to 84 points;
- if profit=100, aggr=3.33 we obtain loss = 100/1.33 ~ 75.19. The threshold value obtained earlier in an experiment is equal to 75 points.
Agreement with the experimental data is not bad. However the real balance graph can't look like this: usually the percentage ratio of profit and loss trades is not equal. We will not try to apply the model for more complicated cases, because the general principle of the artificial balance curve construction is clear. Let's finish our investigation by testing the EA with the third MM type called "moderate".
Test 3: Lot is proportionate to the square root of a deposit
Strategy Tester Report 20_200 expert_v4.2_AntS
Alpari-Demo (Build 215)
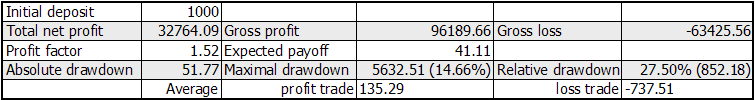

Expert Advisor 20_200 expert_v4.2_AntS, moderate MM
RF = 32764.09 / 5632.51 = 5.82
In this case the initial deposit is equal to $1K, initial lot - 0.1.
This MM takes the intermediary position between the two analyzed above. The maximal drawdown is not very large, but relative drawdown is still rather large, though much less than in the variant with the geometrical MM. Nevertheless the curve is quite attractive and much better than the second one (for the EA "20_200"). Besides it is much more stable than the second variant.
There are different variations of this variant. For example, if we take an initial deposit equal to $10K and set an initial lot equal to 1.0 (commenting the previous code variant):
case 2: size = 1. * MathSqrt( AccountBalance() / 10000 );
for almost 8 years the profit shown earlier increases tenfold, but relative drawdowns do not change.
Conclusion
The majority of conclusions is drawn in the part devoted to the geometrical MM. The author is planning to publish the second article of the "Fallacies" series to cover some of statistical regularities appearing in the analysis of trade results sequence of some "interesting" strategies. The level of material description is a little higher than in the present article but no too incomprehensible.
And now I have the final comment to the article heading: yes, money management is secondary, because apparently money management can hardly help you to save a strategy that is making loss with 0.1 lot and turn it into a profitable and robust one. However true is the second statement partially disproving the proverb "never too much of a good thing": any strategy that allows for different types of money management, even if it's very profitable and robust one, can be killed by an inadequately aggressive MM.
Translated from Russian by MetaQuotes Ltd.
Original article: https://www.mql5.com/ru/articles/1526
 Expert Advisors Based on Popular Trading Systems and Alchemy of Trading Robot Optimization (Part II)
 Comparative Analysis of 30 Indicators and Oscillators
 MetaEditor:Templates as a Spot to Stand On
 Expert Advisors Based on Popular Trading Systems and Alchemy of Trading Robot Optimization
- Free trading apps
- Over 8,000 signals for copying
- Economic news for exploring financial markets
You agree to website policy and terms of use
Correct me if I am off base here, but shouldn't money management NOT be based on lots per balance....but instead be based on RISK per trade? Instead of calculating .1 lot per $1000, calculate lots based on the stoploss for the particular trade. So, say you want to risk 3% of your balance per trade, then based on the stoploss for that trade say it is 30 pips, maybe calculated on the low of the previous bar...say...Open[0]-Low[1]+(2*Point) and your balance is $1000 then the 3% risk is $30, so 0.1 lots at 30pips risk =$30. It LOOKS the same as the .1 per $1000....UNTIL you run into the money management scenario discussed initially in this article where exponential "dints" made HUGE drawdowns. Using risk to calculate the lot would keep the "dints" proportional. I will see if I can modify lucky EA to use risk MM.
VeryGood Article and Clear Points, I love it!
Btw,When can we read Part2?
https://www.mql5.com/en/forum/16514#comment_715789
What a beautiful table. Beautiful.