Comparative Analysis of 30 Indicators and Oscillators
Александр | 20 May, 2008
Introduction
The abundance of indicators and oscillators developed nowadays inevitably leads to the problem of choosing the most efficient of them. Very often a beginning trader first facing this plenty of available analysis and forecasting tools starts testing them on history data and demo accounts. After that a set of conclusions is made about the efficiency and uselessness of this or that indicator in certain situations.
However such an estimation is not always objective because of the large number of parameters (symbol, chart period, volatility, etc.) and therefore the large amount of the analyzed information. More reliable conclusions about certain indicators and oscillators can be made after conducting their comparative analysis.
Actually the comparative analysis of indicators and oscillators is impossible without their simultaneous consideration bounding them to a price chart. However attaching even ten different indicators to a chart considerably overloads it. The obtained figure becomes tangled and unsuitable for analysis. An Expert Advisor described in this article can solve this problem and make the conduction of the comparative analysis more convenient.
Expert Advisor
Pay attention, this EA is not intended for the execution of live trading and therefore does not contain the money management block. Block of trade execution is implemented in a very simple way. The main task of the Expert Advisor is the provision of information about the presence or absence of signals from different indicators in connection with a price chart.
The program analyzes the following indicators and oscillators:- Acceleration/Deceleration — АС
- Accumulation/Distribution - A/D
- Alligator & Fractals
- Gator Oscillator
- Average Directional Movement Index - ADX
- Average True Range - ATR
- Awesome Oscillator
- Bears Power
- Bollinger Bands
- Bulls Power
- Commodity Channel Index
- DeMarker
- Envelopes
- Force Index
- Ichimoku Kinko Hyo (1)
- Ichimoku Kinko Hyo (2)
- Ichimoku Kinko Hyo (3)
- Money Flow Index – MFI
- Moving Average
- MACD (1)
- MACD (2)
- Moving Average of Oscillator (MACD Histotgram) (1)
- Moving Average of Oscillator (MACD Histotgram) (2)
- Parabolic SAR
- RSI
- RVI
- Standard Deviation
- Stochastic Oscillator (1)
- Stochastic Oscillator (2)
- Williams Percent Range
For the implementation of this task a digital matrix consisting of "-1", "0" and "1" is drawn on a chart. Each matrix line belongs to a certain indicator or oscillator. The matrix columns are formed at each moment of time (according to the selected chart period). The appearance of "-1" in a certain matrix line denotes the presence of a signal to sell produced by a certain indicator (oscillator); appearance of "1" - presence of a buy signal, "0" denotes the absence of any signal. Fig. 1 illustrates the program operation results.
Fig. 2 illustrates the analysis of RVI operation based on the matrix. In the line 26 (it contains data about this indicator) "1" is recorded when the main line moves above the signal one (the indicator recommends to buy), "-1" - when the signal line is above the main one (Sell signal). Due to the indicator characteristics this line does not contain "0".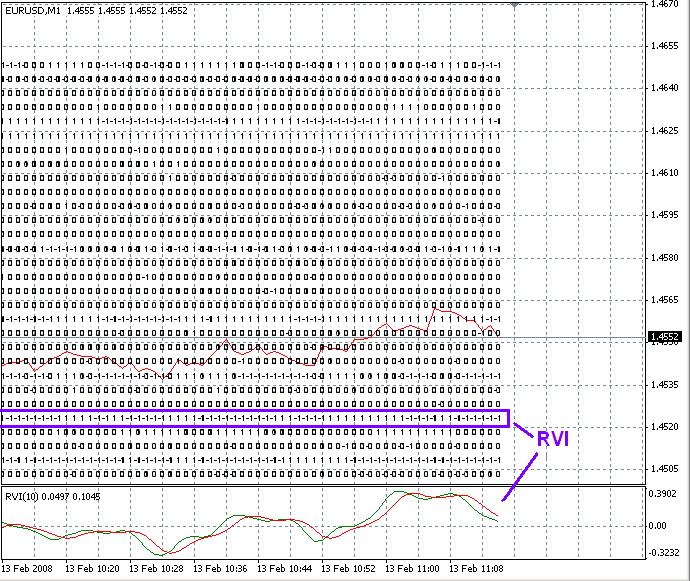
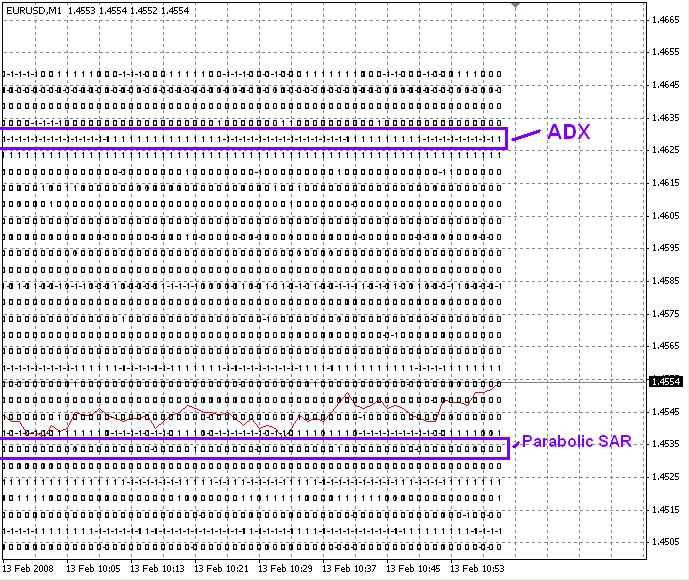
Due to characteristics of indicators and oscillators, we can detect two types of indexes in the matrix: constantly significant ones, the corresponding flags (values in the matrix) of which are never equal to zero, and pointwise significant, the flags of which can accept zero and make signals only in some certain moments of time (for example, Parabolic SAR). It is shown in Fig. 3.
It is recommended to analyze the obtained information and then form a package of indicators the following way. First of all select the chart part with a trend. Then the period of possible trades is specified. The beginning of such a trend can be a flat period before the selected trend or trend origination; the end of the period is the last time moment when a trade is still profitable. Thus anticipatory and late indicator signals are not taken into account. In fig. 4 such a period is indicated by green lines. After that information by indicators (oscillators) is analyzed inside this period: all indicators showing trend correctly are taken, other ones are shifted away. After that the package can be extended or restricted by the analogous analysis on other time intervals, as a result the final package will be formed.
The program provides the testing of formed packages. For this purpose in a corresponding line of the strategy processing Block enumerate conditions (indicator showings) based on which the final decision about selling (or buying) is made.
Thus the combined analysis of the price behavior and signals produced by each certain indicator (oscillator) provides the possibility of selecting the most efficient of them for further formation of a package of indicators.
Algorithm
At the first stage values of "flags" (-1, 0, 1) are defined for each indicator (oscillator). Assuming that one indicator (for example, MACD) produces signals different ways (convergence/divergence, crossing of a zero line, etc.), the program code contains the description of its defining principle. For example, analysis of the oscillator "Williams Percent Range" is implemented so:
//30. Williams Percent Range
//Buy: crossing -80 upwards
//Sell: crossing -20 downwards
if (iWPR(NULL,piwpr,piwprbar,1)<-80&&iWPR(NULL,piwpr,piwprbar,0)>=-80)
{f30=1;}
if (iWPR(NULL,piwpr,piwprbar,1)>-20&&iWPR(NULL,piwpr,piwprbar,0)<=-20)
{f30=-1;}
After that unique objects of the 'Text' type are formed from the obtained digital values of flags (to avoid duplication of object names current time value is used) and the displayed:
timeident=TimeCurrent(); //Time to form the unique object name
for (i=0;i<=29;i++) //Loop for displaying values

//Forming unique object names
{ident=DoubleToStr(30-i,0)+"   "+DoubleToStr(timeident,0);

//Creating objects, indicating their location
ObjectCreate(ident,OBJ_TEXT,0,timeident,WindowPriceMin()+Point*5*(i+1));

info=DoubleToStr(f[30-i],0); //Forming a text line to be displayed
ObjectSetText(ident,info,6,"Arial", Black);} //Describing the display format
To check the formed packages the program includes "The block of processing a strategy and placing the Main Flag". This block contains conditions providing which the EA must buy (if the Main Flag is equal to 1) and sell (if the Main Flag is equal to -1). If the described conditions are not fulfilled, the Main Flag stays equal to zero and trades are not executed. The EA also contains a block of position closing (it is commented).
if(f8==1&&f21==1) //Set of conditions, providing which Buy is executed
flag=1;
if(f8==-1&&f21==-1) //Set of conditions, providing which Sell is executed
flag=-1;
Parameters of each indicator (oscillator) are described in the form of variables, which allows their automatic optimization (initial parameters are those generally accepted).
Conclusion
As said above, the offered Expert Advisor is not a ready automated trading system. Its main task is the conduct of a comparative analysis of indicators and oscillators for further formation of a package. The EA demonstrates signals produced by indicators not overloading a trader's desktop making the analysis very convenient.
The flexibility of the EA is in the following: a new set of indicators can be included into the matrix and formed packages can be tested on history data.