MQL4 Language for Newbies. Custom Indicators (Part 1)
Antoniuk Oleg | 30 October, 2007
Introduction
This is the fourth article from the series "MQL4 Languages for Newbies". Today we will learn to write custom indicators. We will get acquainted with the classification of indicator features, will see how these features influence the indicator, will learn about new functions and optimization, and, finally, we will write our own indicators. Moreover, at the end of the article you will find advice on the programming style. If this is the first article "for newbies" that you are reading, perhaps it would be better for you to read the previous ones. Besides, make sure that you have understood properly the previous material, because the given article does not explain the basics.
Types of Indicators
Now I will show you, what kinds of indicators exist. Of course, you have seen a lot of them, but now I would like to draw your attention to features and parameters of indicators, thus we will make a small classification of features and parameters. It will then help you to write custom indicators. So, the first simple indicator:
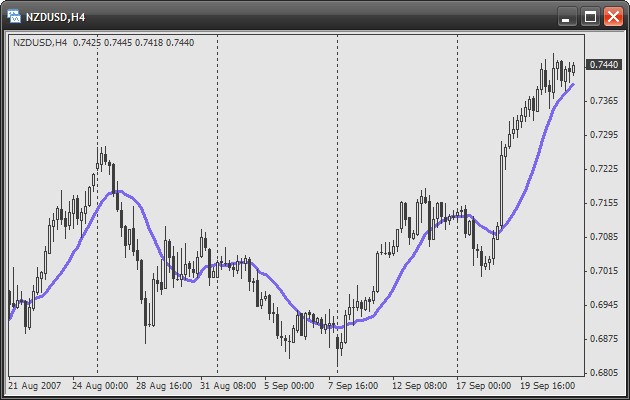
This is Moving Average, MA, a widely used technical indicator. Pay attention to the following important facts:
- the indicator is drawn in the chart window
- the indicator shows only one value
- the range of the indicator values is unlimited and depends on the current prices
- the line is drawn with a certain color, width and style (solid line)
Now let us view another indicator:
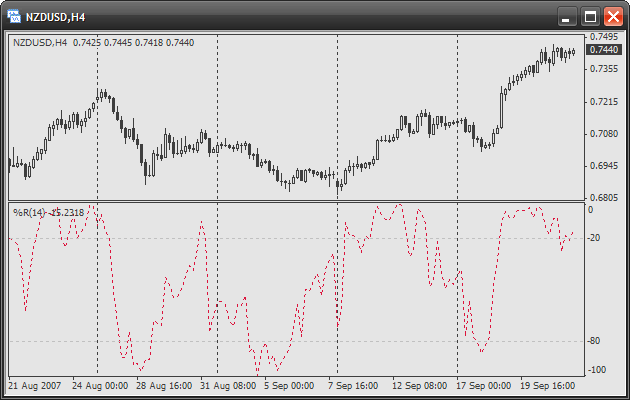
It is Williams’ Percent Range, %R. Pay attention to the following important facts:
- the indicator is drawn in a separate subwindow
- like in the previous case, the indicator shows only one value
- the range of the indicator values is strictly limited
- the drawn line has another style, color and width
Thus, the following indicator properties exist:
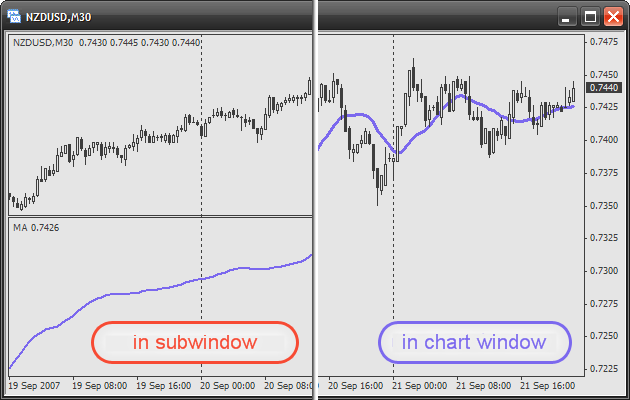
- the indicator is drawn: in a chart window or in a separate subwindow. Now let us try to understand, why Moving Average is drawn on the chart, and Williams’ Percent Range, %R is drawn in a separate window. The difference is in the range of the shown values. Note, that the second indicator shows values in the range from 0 to -100. Now imagine that we show these values in a chart window. And what would happen?? You would not see this line, because the price has a much narrower range. In our case it is from 0.6805 to 0.7495. But it is not all. Actually, prices are positive numbers, and our value is negative. Indicators are drawn in a separate subwindow if their values are outside the price range of the active chart. And if the range is almost the same (for example, different kinds of moving averages), an indicator is drawn in a chart window. In future set this indicator parameter according to this simple logics. Here is a picture:
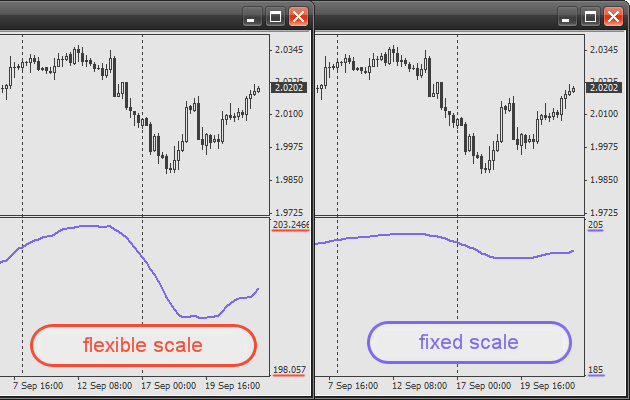
- an indicator that is drawn in a separate subwindow may be limited to a strict range. It means the terminal sets a fixed scale for showing indicator values; and even if values exceed the range, you will not see them. If you disable this parameter, the terminal automatically will change the scale so that it contains all values of an indicator. See the picture:
- an indicator may show its values using different colors, styles and width. You have seen it quite often when setting up the drawing of indicators in the terminal. Here is one restriction: if you use a line width more than 1, you may use only one style - solid line.
Here is one more indicator:
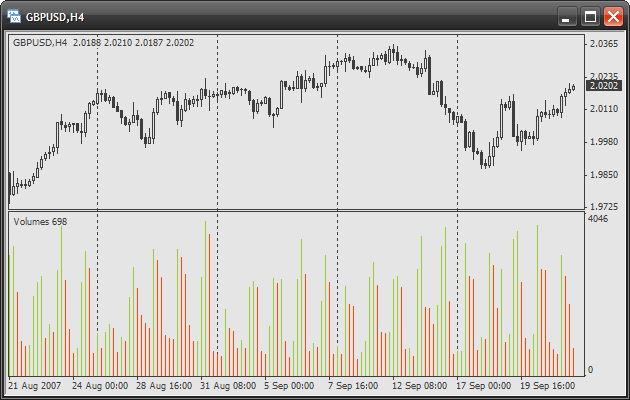
As you see, the indicator Volumes is drawn in the form of a histogram. So, there are several types of showing indicator values. Here is an example of another type:
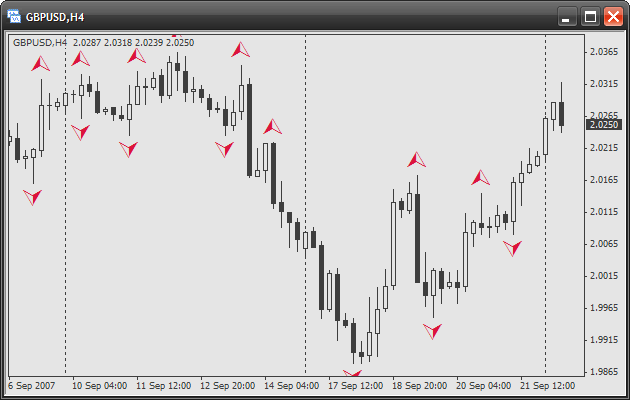
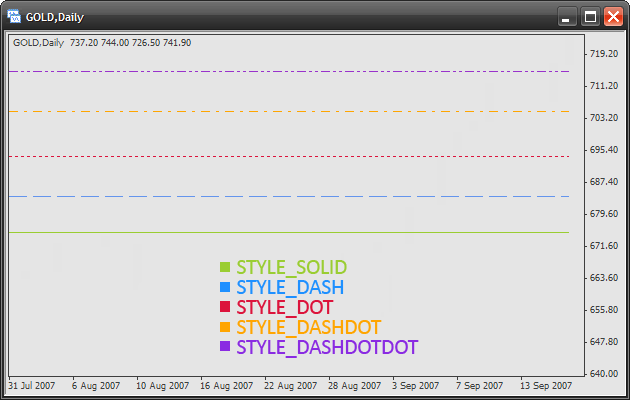
The indicator Fractals is drawn in the form of special symbols. Now look at the following indicator:
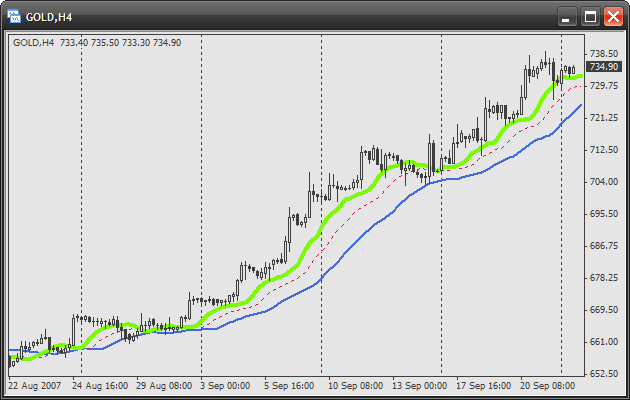
This is Alligator. Note, the indicator simultaneously draws three values (balance lines). How does it work? Actually, any indicator (there are some exceptions, but we will talk about them later) uses data buffers when showing values.
Data buffer is almost a simple array. Its peculiarity is in the fact that this array is partially managed by the terminal. The terminal changes the array so, that at the receipt of each new bar, a shift takes place. It is done for the purpose that each array element corresponds to a certain bar. The maximal number of shown data buffers in one indicator is 8. It may seem strange now, but soon you will understand that it could not be otherwise. Just remember that there is a separate data buffer for each line in Alligator. Each data buffer has its own parameters, according to which the terminal draws them. In our case there are 3 buffers that can be described in the following way:
- The first buffer is drawn by a solid green line at a width 3.
- The second buffer is drawn by a dashed line of red color and width 1.
- The third buffer is drawn by a solid blue line at a width 2.
It is not necessary for an indicator to draw a buffer. It can be used for intermediary calculations. That is why the number of buffers may be larger than you see. But the most important property of data buffer is that each buffer element should correspond to a certain bar on a chart. Just remember this. Soon you will see how this works in a code.
Now let us draw a conclusion of our small excursion. Any indicator has the following parameters:
- one or more data buffers (though not necessarily) for showing its values or for intermediary calculations. Each buffer, in its turn has its own parameters that define how it will be drawn and whether it will be drawn. For example: draw the value in the form of a histogram, symbol or line; what color and style;
- where the indicator should be drawn (in a chart window or in a subwindow);
- if the indicator is drawn in a subwindow, should we limit the range or should the scaling be automatic.
Make sure that you clearly understand all these parameters. Now we will use a Wizard for creating a custom indicator.
Creating a Custom Indicator
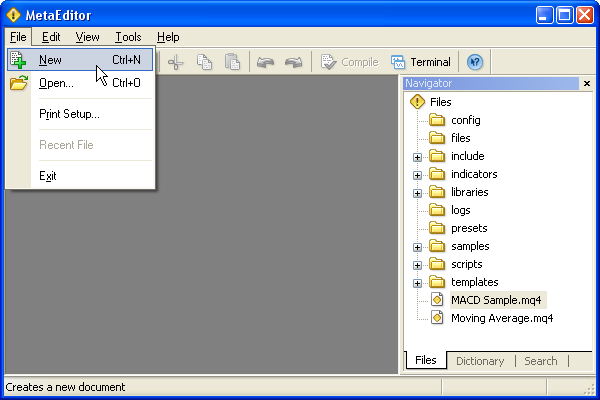
Start MetaEditor, select File->New:
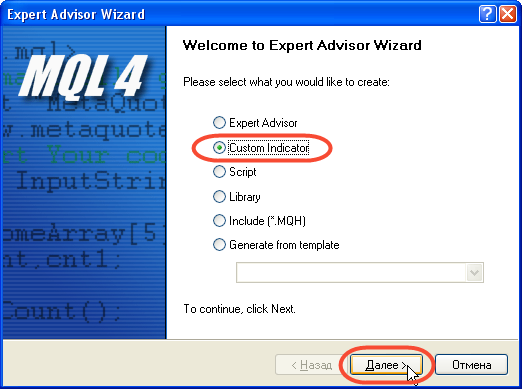
Then we see a window Expert Advisor Wizard, select Custom Indicator, click Next:
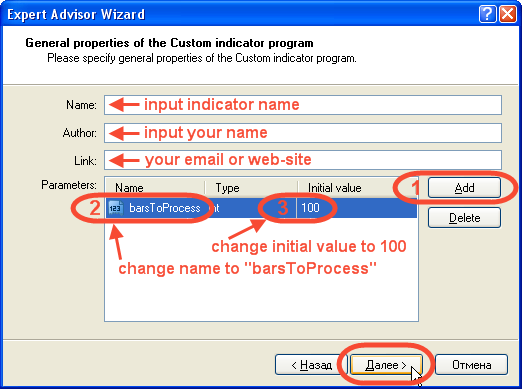
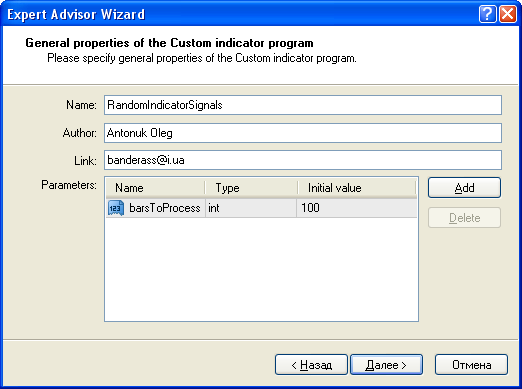
Fill in fields Name, Author and Link. Everything is as usual here, but now you may add parameters. What is this?
Parameters are common variables that can be set by a user. And what is important, these variables may be used in an indicator code. The application of parameters is obvious - you enable users to set up some aspects of the indicator operation. This can be anything you wish. For example, timeframe to use, operating mode, number of bars for averaging etc.
As an example let us try to add a parameter that will show the number of bars processed for the calculation of the indicator values. Where can it be used? Imagine that your indicator seriously loads your processor because of too many calculations. And you often change the timeframe of the chart and view only the last 100-200 bars. Then you do not need other calculations that waste time. This parameter will help you in such a situation. Of course, there will be nothing difficult in our indicator that can waste the computer resources. This is only a variant of using indicator parameters.
So, for adding a parameter click Add (1). After that you may change a variable name (2). In our case we substitute it for barsToProcess. You may also change the initial value (3), i.e. default value. Change it into 100. Besides you may change the variable type, but in our case we do not need to change anything, because type int suits perfectly to our purposes. After all necessary changes are made, click Next:
It is almost ready. Now indicate how the indicator should be drawn: in a separate window or in a chart window. You may also limit the range. Check Indicator in separate window. Below is an empty field Indexes (data buffers). Here you may add the necessary number of data buffers (maximum 8). Besides, you may always add or delete a buffer later, changing the code. Click Add for adding a buffer. Now you may change the way the buffer will be drawn: line, histogram, section, arrow. We will not change anything, so our type is Line. Set up the color and click OK.
Finally, your first indicator is ready! Well, it does not draw anything, but it is a code! The file with the source code is in the folder with indicators: MetaTrader4\experts\indicators.
Let us Analyze Each Line
Now let us see, what Meta Editor has created:
//+------------------------------------------------------------------+
//|                                             myFirstIndicator.mq4 |
//|                                                     Antonuk Oleg |
//|                                                   banderass@i.ua |
//+------------------------------------------------------------------+
As usual the head consisting of one-line comments includes the information you have written earlier. Next:
#property copyright "Antonuk Oleg"
Do you still remember the preprocessor directive #define from the second article? We used it for declaring constants. So, here is one more directive used for denoting specific properties of an indicator. In our case it is used for indicating authorship. Please note that is starts with the special sign #, then goes the key word property (without a space). Then comes a concrete property that we want to set, in our case it is copyright, and then the value of this property. In our case it is a line with your name. Using the directive #property you may set up many specific aspects of the indicator. You will see it now. All these properties will be set up by default. Let us go further:
#property link "banderass@i.ua"
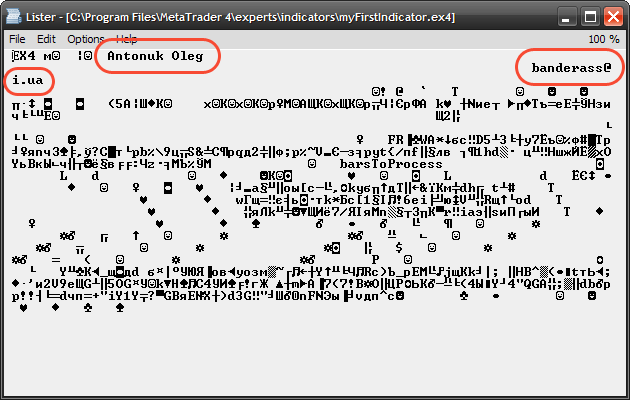
This directive shows, how to contact the author. You may ask where this information (the author's name and contact information) is, because it is not shown anywhere. But it is included into the executable file. And if you view the executable file as a common text, you will see this information:
Next:
#property indicator_separate_window
This directive shows, that the indicator must be drawn in a separate subwindow. As you see, there are no additional parameters, as distinct from the previous directive.
#property indicator_buffers 1
This directive indicates, how many data buffers will be used by the indicator. You may have noticed that directives are in some way similar to common functions: they also accept some parameters and do something in response. But there is an important difference: they are executed in the first instance (before compilation).
#property indicator_color1 DarkOrchid
Indicate default color for the first buffer. Note that buffer numeration starts from one, not from zero. Try to remember it, so that you have no confusion in future. The color is indicated using one of many predetermined names. You may see key words for all available colors in the help: MQL4 Reference -> Standard Constants -> Web-Colors. Similarly you may indicate the color for other buffers, simply change the buffer number.
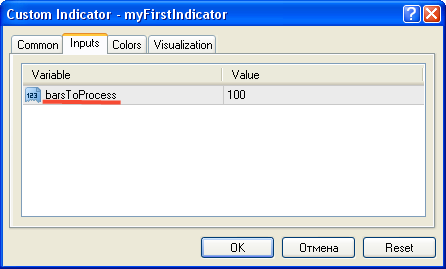
extern int barsToProcess=100;
This is our parameter of the indicator. We have set it in the Wizard. Note that the only difference from a common variable is the key word extern before the variable type. This is how the parameter will look like for a user at the indicator start:
Next:
double ExtMapBuffer1[];
This is a usual array. But the dimensionality is not indicated and initialization is not performed. This array will later be set up as a data buffer.
Then we declare and describe functions. As distinct from a usual script, each indicator has 3 functions, not 1:
- init() - this function is called by the terminal only once, when we start the indicator. Its purpose is to prepare the indicator for operation, set up data buffers, check parameters (what a user has written) and other preparatory actions. This function is not obligatory. If you do not perform a code in it, you may delete it.
- deinit() - this function is also called only once, when you delete an indicator from a chart. You should prepare the indicator for the termination of its operation. For example, close opened files, delete graphical objects from the file (do not worry, you will learn how to do it). This function is also not obligatory.
- start() - as distinct from scripts, in indicators this function is called at each tick. I.e. when new quotes appear from the currency pair, to the chart of which you have attached the indicator, this function is called. Besides, this function is called at the indicator start, i.e. after the function init().
Let us see what happens in each function:
int init()
{
   SetIndexStyle(0,DRAW_LINE);
   SetIndexBuffer(0,ExtMapBuffer1);

   return(0);
}
Here we see the calling of two important functions for setting a data buffer:
SetIndexStyle(0,DRAW_LINE);
This function sets how to draw the data buffer. The first parameter indicates, to what buffer the change should be applied. Please note, that in this function (and similar functions) the buffer numeration starts from zero, not from one like in directives. It is an important moment, so be careful. The second parameter indicates, how to draw the chosen buffer. In our case we use the constant DRAW_LINE, which shows that the buffer will be drawn as a line. Of course, there are other constants, but we will talk about them later.
SetIndexBuffer(0,ExtMapBuffer1);
This function "binds" an array to a buffer number. I.e. it shows that the buffer with the indicated number will use the indicated array for storing data. So, changing the elements of this array you will change the value of the buffer. Actually an array is a data buffer. The first argument is the name of the array that should be bound.
return(0);
End of the function, return zero - the initialization was successful.
int deinit()
{
//----

//----
   return(0);
}
The function of deinitialization is empty by default.
int start()
{
   int counted_bars=IndicatorCounted();
//----

//----
   return(0);
}
Now comes the most important function - the main code is located here. Pay attention: the variable counted_bars is declared beforehand, it is initialized by the function IndicatorCounted(). This variable is usually used for the optimization and speedup of the indicator operation, this will be analyzed later. And now let us draw something in the indicator window.
Finishing the Indicator
Let us decide what should be displayed. What will the indicator show us? Something simple. First let's draw random numbers. Why not? This guarantees 50% of profit signals.
Let's write in our function init() a code for the initialization of the generator of random numbers:
int init()
{

   SetIndexStyle(0,DRAW_LINE);
   SetIndexBuffer(0,ExtMapBuffer1);

   // initialization of the generator of random numbers
   MathSrand(TimeLocal());

   return(0);
}
The initialization is ready, now comes the function start():
int start()
{
   int counted_bars=IndicatorCounted();

   for(int i=0;i<Bars;i++)
   {
      ExtMapBuffer1[i]=MathRand()%1001;
   }

   return(0);
}
Compile - F7. Start the terminal, find the panel Navigator, select the section Custom Indicators and double-click the name of our indicator:
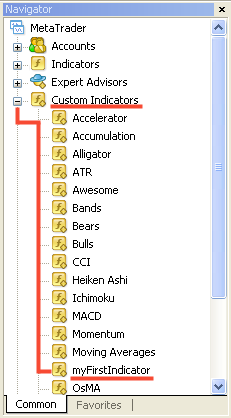
The indicator will be attached to the active chart:
You see, it all works. Now let us see what the code does:
for(int i=0;i<Bars;i++)
We use the cycle for to go through all elements of the data buffer. As a certain bar corresponds to each element of the buffer, we use the cycle, starting from the zero bar (the last available) and end with the first available, which is in succession one less than the variable Bars (because we count bars from zero).
{
   ExtMapBuffer1[i]=MathRand()%1001;
}
At each iteration a counter is increased by one, and we move from the last available bar to the first one at the same time assigning to each buffer element (which corresponds to a certain bar) a random number from 0 to 1000. If it is difficult for you to understand, how a certain buffer element corresponds to a certain bar, try to change the cycle in the following way and see the result in the terminal:
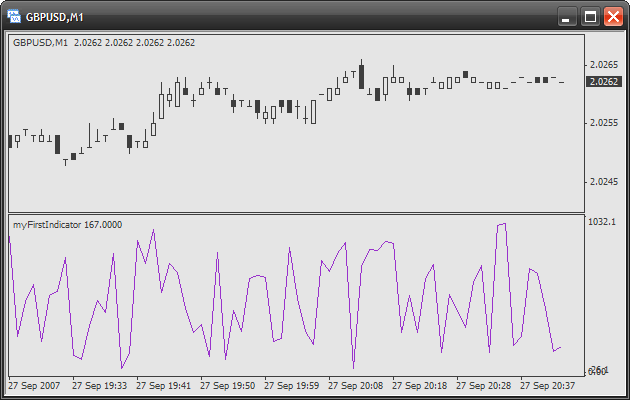
for(int i=0;i<Bars;i++)
{
   ExtMapBuffer1[i]=i;
}
Now the indicator will show the number of each bar, look:
You see, the bar number increases from the last bar to the first one (from 0 to Bars). Hope now you understand the correspondence of buffer elements to bars on the chart.
Now let us get back to the code of the "random" indicator. If you used it at least several minutes, you would see that each indicator tick draws absolutely different chart. I.e. each tick makes recalculations of what was calculated the previous time. This is inconvenient for us because we cannot see even what happened a tick ago. But this does not matter, because no one will use such an indicator - we are simply learning to write it. There is one more thing. Imagine, you indicator makes a lot of complex calculations and calculation of one bar requires large processor resources. In such a case, if a new price appears, your indicator will calculate the value for each available bar, even if it was done earlier. Is it clear? Instead of calculating only once, it will calculate again and again. Eliminating such problems connected with unreasonable waste of resources is called optimization.
How can we solve this problem? Usually it is done in the following way. First an indicator is calculated on all available candlesticks, and only then when quotes are received, it will recalculate the value only for the last candlestick. This is reasonable - no unnecessary actions. Now let us optimize the function start(), so that it works in the following way:
int start()
{
   int counted_bars=IndicatorCounted(),
       limit;

   if(counted_bars>0)
      counted_bars--;

   limit=Bars-counted_bars;

   for(int i=0;i<limit;i++)
   {
      ExtMapBuffer1[i]=MathRand()%1001;
   }

   return(0);
}
Let us analyze each line:
int counted_bars=IndicatorCounted(),
We declare the variable counted_bars that will store the number of bars calculated by the indicator. Actually the function IndicatorCounted() returns the number of unchanged bars after the previous call of the function start(). So, if it is the first start() calling, IndicatorBars() will return 0, because all bars are new for us. If it is not the first calling, changed is only the last bar, so IndicatorBars() will return a number equal to Bars-1.
limit;
Here is one more variable that will be used as a limiter, i.e. will help the cycle to be completed earlier, omitting already calculated candlesticks.
   if(counted_bars>0)
      counted_bars--;
As it was already said, if IndicatorCounted() returns 0, the function start() is called for the first time and all bars are "new" for us (the indicator was not calculated for them). But if it is not the first calling of start(), the value equal to Bars-1 will be returned. So, this condition tracks such a situation. After that we diminish the variable counted_bars by 1. Only the last bar can be changed, so why do we do this? The fact is, there are some situations, when the last tick of the previous bar remains unprocessed, because when the last tick came, the last but one tick was processed. And the custom indicator was not called and was not calculated. That is why we diminish the variable counted_bars by 1, in order to eliminate this situation.
limit=Bars-counted_bars;
Here we assign to the variable limit (the limiter) the number of last bars that need to be recalculated. While the variable counted_bars stores the number of already calculated candlesticks, we simply find the difference between Bars (the total number of available bars) and counted_bars for defining, how many candlesticks must be calculated.
for(int i=0;i<limit;i++)
{
   ExtMapBuffer1[i]=MathRand()%1001;
}
The cycle itself almost did not change. We changed only the condition of implementation. Now the cycle will be performed while the counter i is less than limit.
Now optimization is over. If you observe the updated version of the indicator, you will see that when a new tick is received, the value only of last bar changes. Try to use such an optimization constantly, even if your indicator does not calculate anything difficult. This is haut ton.
Do you remember an indicator parameter barsToProcess that we added in the Wizard. Now it is high time to use it. We simply need to add a couple of lines before the cycle:
int start()
{
   int counted_bars=IndicatorCounted(),
       limit;

   if(counted_bars>0)
      counted_bars--;

   limit=Bars-counted_bars;

   if(limit>barsToProcess)
      limit=barsToProcess;

   for(int i=0;i<limit;i++)
   {
      ExtMapBuffer1[i]=MathRand()%1001;
   }

   return(0);
}
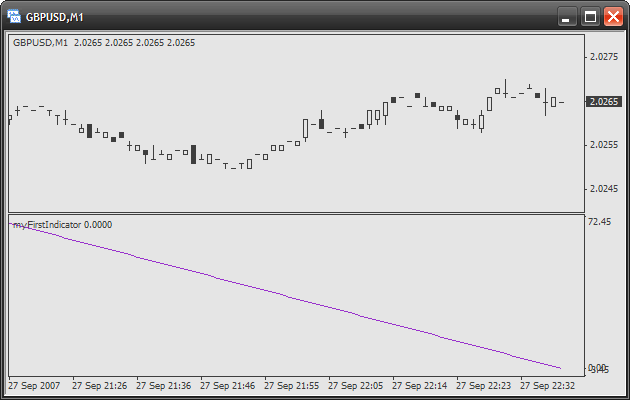
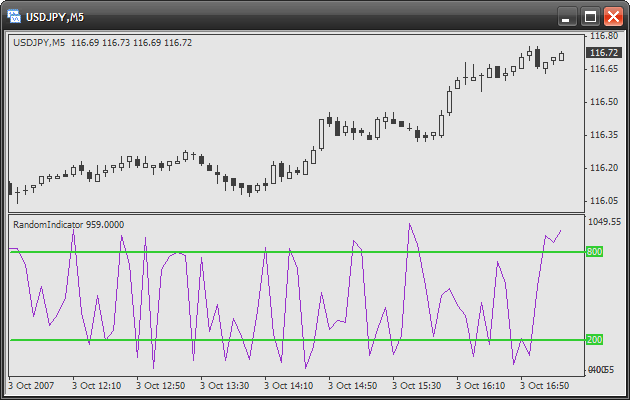
You see, everything is quite simple. We check if limit is more than barsToProcess. If yes, diminish the limiter through assigning. As a result, if we set barsToProcess=100, you will see a picture like:
As you see, only the number of bars set by us is calculated.
Our indicator is almost ready. But we do not have clear signals for entering the market. So we need to add more certainty. For this purpose we will use levels.
Levels are horizontal lines drawn by the indicator using a certain style, color and width. It should be noted here that the maximal number of levels on one bar is 8. Besides you may set levels using directives or functions. It is more preferable to use the first variant, if you want to set levels by default. For the dynamic change of levels during the indicator's operation use functions. So let us set two levels: the first one on the point 800, the second - 200. For this purpose let us add several directives at the beginning of the indicator code:
//+------------------------------------------------------------------+
//|                                             myFirstIndicator.mq4 |
//|                                                     Antonuk Oleg |
//|                                                   banderass@i.ua |
//+------------------------------------------------------------------+
#property copyright "Antonuk Oleg"
#property link      "banderass@i.ua"

#property indicator_level1 800.0
#property indicator_level2 200.0
#property indicator_levelcolor LimeGreen
#property indicator_levelwidth 2
#property indicator_levelstyle 0

#property indicator_separate_window
Let us analyze new directives:
#property indicator_level1 800.0
This directive shows, that the level 1 should be places at the point 800.0. Pay attention that buffer numeration starts with 1, like in the directives for buffer setting. For setting up another level, simply change the level number at the end of a directive:
#property indicator_level2 200.0
There is an important limitation in setting the external form of levels. You cannot setup each level individually. All settings are applied absolutely to all levels. If you need to setup each level individually, you should use objects (and do not use levels at all), which will be described in the next article.
#property indicator_levelcolor LimeGreen
This directive sets color, which will be used for drawing all levels.
#property indicator_levelwidth 2
This directive sets width for drawing lines of all levels. You may set the width from 1 to 5. Do not forget, that if a width is more than 1, levels will be drawn in a solid line. If you need another style of drawing levels, use only the width 1.
#property indicator_levelstyle STYLE_SOLID
This directive sets style for drawing lines. There are the following preset constants:
- STYLE_SOLID - solid line
- STYLE_DASH - dashed line
- STYLE_DOT - dotted line
- STYLE_DASHDOT - dash-dotted line
- STYLE_DASHDOTDOT - dash-dotted line with double dots
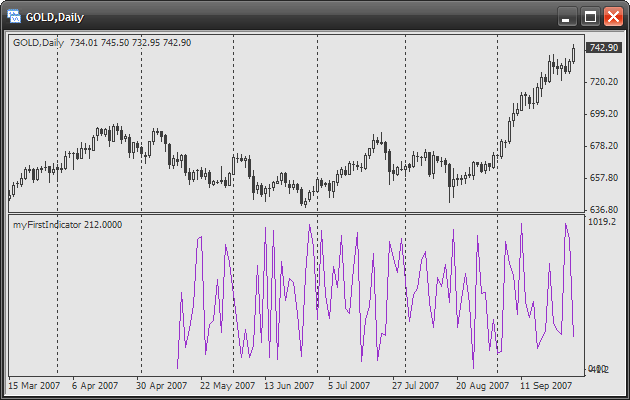
We have finished developing our "random" indicator. Now let us save the source file with a more appropriate name - randomIndicator.mq4. Recompile the source file once again. This indicator will also be used in the following part. The final version should look like this:
Function iCustom
Now let us dwell on a very useful function - iCustom. It is used for getting values of any custom indicator. Remember, for built-in indicators we use functions for working with technical indicators described in the previous article (for example: iADX(), iMACD etc.). For all other indicators (custom indicators) use the function iCustom. This function is a universal one and can be applied to any custom indicator that meets the following requirements:
- the indicator is compiled and is in the form of an executable file (*.ex4)
- the indicator is in the folder MetaTrader 4\experts\indicators
The function prototype has the following form:
double iCustom( string symbol, int timeframe, string name, ..., int mode, int shift);
Parameters:
- symbol – defines, which financial security (currency pair) should be used for the calculation of a custom indicator values. Use NULL (or 0), if you need the current (active) security (chart).
- timeframe – defines, on which timeframe (period) the indicator should be used. Use 0 for the current period or one of constants (PERIOD_M1, PERIOD_M5, PERIOD_M15, PERIOD_M30, PERIOD_H1, PERIOD_H4, PERIOD_D1, PERIOD_W1, PERIOD_MN1).
- name – the name of the executable file of the custom indicator. Only the name should be indicated: do not write the extension (.ex4) or the path to the file (experts/indicators/). For example, if the name of the executable file of the custom indicator is "RandomIndicator.ex4", you should write "RandomIndicator". The register here is not relevant. It means you may write "RANDOMindicator" and it will work.
- ... – here you should indicate all the values of the custom indicator parameters. For example, in our indicator RandomIndicator there is only one parameter - barsToProcess. I.e. in our case we write here 100 (or any other suitable for you value). If the number of parameters is more than one, the are indicated in the same succession as they are declared in the custom indicator, comma separated. Now we will try to write an indicator based on this function and you will understand it better.
- mode – the operation mode of the custom indicator. Actually it is the number of the data buffer, the value of which you want to get. The numeration starts from zero (not like in directives). If the custom indicator has only one data buffer, this parameter should be equal to 0.
- shift – defines, to what bar the custom indicator should be used.
Examples of Usage:
ExtMapBuffer[0]=iCustom(NULL,PERIOD_H1,"Momentum",14,0,0);

// assign to the first element of the array ExtMapBuffer the value of the custom
// indicator Momentum on the last available bar. We use here the active
// security on hour chart. The name of the executable file: Momentum.
// This indicator has only one parameter - period. In our case the period
// is equal to 14. This indicator has only one data buffer, so we use zero,
// in order to get access to its values.
double signalLast=iCustom("EURUSD",PERIOD_D1,"MACD",12,26,9,1,0);

// declare a new variable signalLast and assign to it the value of the custom
// indicator индикатора MACD on the last available bar. We use the pair EURUSD on
// a daily chart. The name of the executable file: MACD. This indicator has 3 parameters:
// period for quick average, period for slow average and period for a signal line.
// This indicator also has 2 data buffers. The first one is with values of the main line. The second one
// with values of a signal line. In our case we take the value of the signal line.
Signal Indicator
Now we will write one more simple indicator. So, imagine the following situation. You have written quite a complex indicator with many data buffers. Many of them are displayed in a separate window, others are used for intermediary calculations. You know exactly signals to buy and to sell. But the difficulty is, it is very hard to trace the signals. You need to constantly look into your monitor, trying to find crossing lines, which are above levels or below them. That is why you decide to write one more indicator that could do it for you and would only show you the entry signals. For example, these could be arrows showing in what direction you should open positions. This is only a fantasy showing where a signal indicator could be appropriate. Our situation is much easier, but still is similar to the first one.
We will write a signal indicator based on the previous indicator RandomIndicator. First we need to define entry conditions - here we will need our levels. So conditions will be the following:
- if a line moves above the upper level (800.0), buy
- if a line moves below the lower level (200.0), sell
Now it is high time to write a new indicator. Use Expert Advisor Wizard to create a new custom indicator. Add one additional parameter as in the previous case:
And the last step (Drawing properties of the Custom indicator program) should be the following:
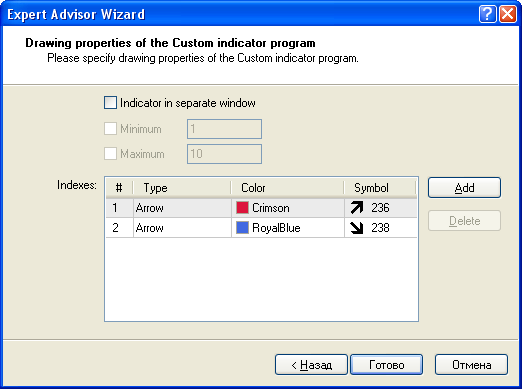
First add two data buffers that will be used for drawing signals to buy and to sell in the form of arrows. Change the type of data buffers into Arrow. Change colors and symbol codes. Below are all available symbol codes:
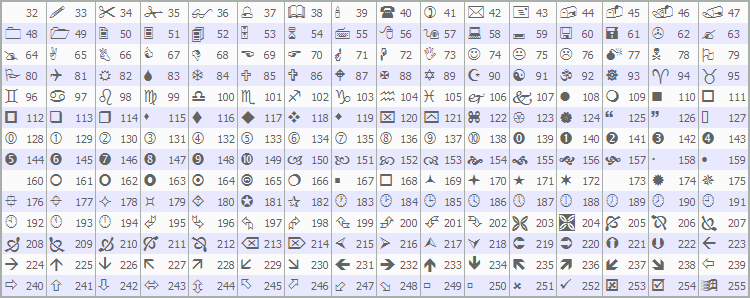
We do not need to draw the indicator in a separate window, because we are going to draw signals in the chart window.
We use two data buffers, because we cannot draw different arrows (symbols) using only one buffer. Each data buffer that is displayed in the form of symbols can be drawn only by one symbol. Now let us analyze very attentively the indicator initialization code:
int init()
{
//---- indicators
   SetIndexStyle(0,DRAW_ARROW);
   SetIndexArrow(0,236);
   SetIndexBuffer(0,ExtMapBuffer1);
   SetIndexEmptyValue(0,0.0);
   SetIndexStyle(1,DRAW_ARROW);
   SetIndexArrow(1,238);
   SetIndexBuffer(1,ExtMapBuffer2);
   SetIndexEmptyValue(1,0.0);
//----
   return(0);
}
Pay attention that now another constant for the type of data buffer drawing is used - DRAW_ARROW:
SetIndexStyle(0,DRAW_ARROW);
We also see two new functions that are used for setting the symbol drawing. SetIndexArrow is used to set what symbol will represent a buffer. The first argument is the buffer number, the second one is the symbol code that will represent the indicator:
SetIndexArrow(0,236);
SetIndexEmptyValue is used for indicating an "empty" value. It means we indicate the value, at which we need to draw nothing. It is very convenient in our case, because signals are generated not on every bar. It works the following way: when we do not need to draw an array on the current bar, you assign to the corresponding data buffer element an "empty" value, in our case it is 0. The first argument of the function is the number of the data buffer. The second one is the "empty" value:
SetIndexEmptyValue(0,0.0);
The remaining initialization code sets buffers analogous to the "random" indicator, that we analyzed earlier. Now let us finish the code in the function start():
int start()
{
   int counted_bars=IndicatorCounted(),
       limit;

   if(counted_bars>0)
      counted_bars--;

   limit=Bars-counted_bars;

   if(limit>barsToProcess)
      limit=barsToProcess;

   for(int i=0;i<limit;i++)
   {
      double randomValue=iCustom(NULL,0,"RandomIndicator",barsToProcess,0,i);

      if(randomValue>800.0)
         ExtMapBuffer1[i]=High[i]+5*Point;
      else
         ExtMapBuffer1[i]=0.0;

      if(randomValue<200.0)
         ExtMapBuffer2[i]=Low[i]-5*Point;
      else
         ExtMapBuffer2[i]=0.0;
   }

   return(0);
}
The whole code until the cycle is repeated from the "random" indicator. Actually this code is standard in any indicator and is repeated with small changes. Now let us analyze the cycle in details:
   for(int i=0;i<limit;i++)
   {
      double randomValue=iCustom(NULL,0,"RandomIndicator",barsToProcess,0,i);

      if(randomValue>800.0)
         ExtMapBuffer1[i]=High[i]+5*Point;
      else
         ExtMapBuffer1[i]=0.0;

      if(randomValue<200.0)
         ExtMapBuffer2[i]=Low[i]-5*Point;
      else
         ExtMapBuffer2[i]=0.0;
   }
First we declare the variable randomValue (random value) and assign to it the value of our "random" indicator on the current bar. For this purpose we use the function iCustom:
double randomValue=iCustom(NULL,0,"RandomIndicator",barsToProcess,0,i);

// get the value of the "random" indicator on the i-th bar. Use the active chart on the current period.
// The name of the executable file of indicator: RandomIndicator. Single parameter of "random" indicator
// is number of bars for calculation. In our indicator there is also analogous variable, that is why
// we use it. In "random" indicator only 1 data buffer, so we use 0, for getting
// access to its values.
If the value of the "random" indicator is more than the upper level (800), this is a signal to buy:
if(randomValue>800.0)
   ExtMapBuffer1[i]=High[i]+5*Point;

// if there is signal to buy, assign to current element of data buffer the highest
// value of the current bar. Besides add 5 points, so that the arrow were a little higher
// than the current price. The predetermined variable Point is used to get automatically
// a multiplier for presenting points. Otherwise we would have to write something like
// this: ExtMapBuffer1[i]=High[i]+0.0005;
Otherwise, if there is no Buy signal:
else
   ExtMapBuffer1[i]=0.0;

// if no Buy signal, assign to the current element of data
// buffer "empty" value, which is equal to 0.0.
// Now no symbol will be shown on this bar.
If the value of the "random" indicator is below the lower level (200), this is a Sell signal:
if(randomValue<200.0)
   ExtMapBuffer2[i]=Low[i]-5*Point;

// if it is signal to sell, assign to the current element of data buffer the lowest
// value of the current bar. Besides diminish the value by 5 points, so that the arrow were
// a little lower than the current price.
Otherwise, if there is no Sell signal:
else
   ExtMapBuffer2[i]=0.0;

// if no Sell signal, assign to the current element of data
// buffer "empty" value. Now no symbol will be shown on this bar.
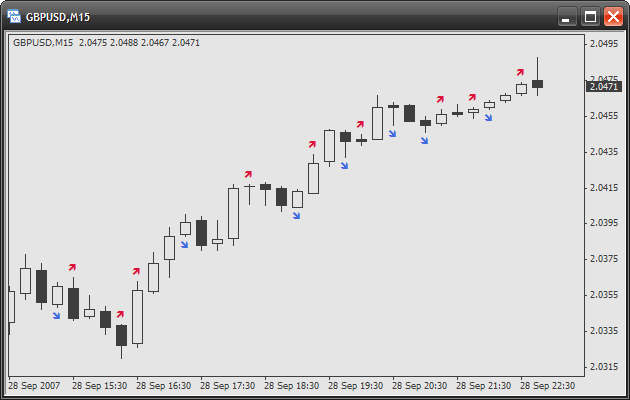
This was the cycle. Compile the indicator and start it in the terminal:
About the Style
No, this is not the rules of choosing a tie to suit a coat and shirt, though it is always timely. The programing style is very important, if you do not write your code only for yourselves. Actually, each developer has his own programming style. Each one designs cycles in his own way, makes different indents (or no indents at all), declares variables etc. You should find your own programming style, which you will always use later. I would like to give you a several recommendations that will help you to make your code easy to read and understand:
- do not write many operations in one line semi-colon separated (;)
- write names of variables and functions in English
- in variable names use capitals as delimiters
- avoid the excessive use of abbreviations and reductions in the names of variables and functions
- make indents of a certain length to have even code blocks
- in each new body (of a cycle or a condition) make additional indents
- make the grouping of one-type variables
- make proper comments for large and difficult code blocks
- make proper comments for the functions written by you (their assignment, parameters)
Conclusion
You have learned something new today. You have written two simple indicators. Well, they are useless, but I am not teaching you to trade successfully! You have seen, how indicators operate, what parameters and properties they have. You have learned to set buffers and work with them. You have got acquainted with several new functions. The function iCustom is very important and will further be used even in Expert Advisors. If you meet any difficulties, reread the article once again, trying to understand. If you still have some questions, please do not hesitate to use forums or write comments to the article.