Testing Visualization: Account State Charts
Andrey Khatimlianskii | 27 July, 2007
Introduction
I think, it is not only my wish to view the information about the account state
during testing in the visualization mode in a more informative form.
What was the amount of free margin before opening the last position? Where is the
balance curve directed to? How large was the drawdown on equity for the last day?
Some of these questions were discussed in the articles Testing Visualization: Functionality Enhancement and Testing Visualization: Trade History. But they do not contain any tool for quick and easy viewing the information on
the account. In this article we will discuss programs for drawing charts of the
account state during testing in the visualization mode. As an example we will examine
Balance and Equity charts. The article also contains instructions on building charts
of other account attributes.
Is it Easy?
One would think, what can be easier than writing an indicator, displaying Balance?
The only buffer is fulfilled by the last known Balance value upon the receipt of
bars. This is the algorithm.
But there is one problem: the indicator, displayed on the testing visualization
chart, does not have the access to the state of the tested account. All functions, responsible for this information, return the values of the
real account.
In this article we will learn to avoid this "peculiarity". For this purpose
we need:
- receive the information about the account state from the Expert Advisor;
- pass it to the indicator and visualize it.
For passing the relevant data we will use Global variables of the terminal, and for their visualization - standard functions of custom indicators.
It is easy!
We need to add into the Expert Advisor, which will be tested, a code of saving the
Balance into the Global variable. All we need is add one line in the beginning
of the function start():
int start()
{
   // saving the last value of the balance into the global variable
   GlobalVariableSet( "vGrafBalance", AccountBalance() );

   // Expert Advisor code

   return(0);
}
The indicator code is not much more difficult:
#property indicator_separate_window
#property indicator_buffers 1
#property indicator_color1 Blue

double balance[];

int init()
{
    IndicatorShortName( "vGrafBalance" );
    IndicatorDigits( 2 );

    SetIndexStyle( 0, DRAW_LINE );
    SetIndexBuffer( 0, balance );
    SetIndexLabel( 0, "Balance" );
}
int start()
{
    balance[0] = GlobalVariableGet( "vGrafBalance" );
    return(0);
}
That is all! Now we can compile the indicator, the new version of the Expert Advisor and start testing!
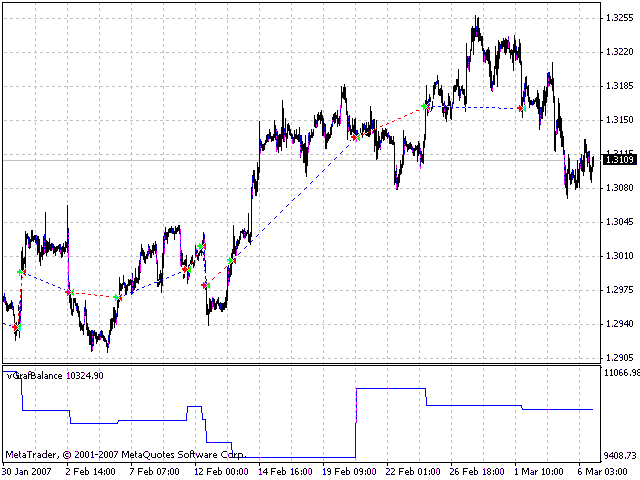
After clicking the Start button and attaching an indicator to the chart, we will
see something like this:

You see, the balance curve reflects real changes - at the closing of each trade its value changes.
What else can be done?
All other graphs are built the same way:
- add into the Expert Advisor a line, updating the value of the necessary Global variable;
- create a simple indicator, reading the value of this variable and reflecting it on the chart.
Note, that the variable name for each characteristic must be unique, i.e. it must
not be identical with the names of other variables.
Besides, it should be identical with the name of the variable, read by the indicator.
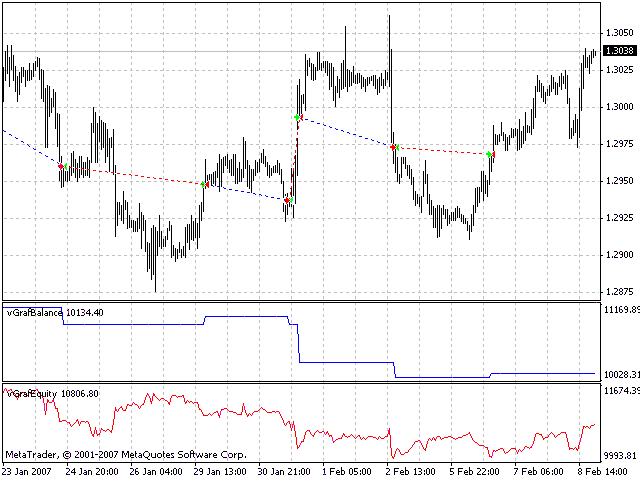
The second example shows how to add the Equity chart to the Balance chart.
The code of the Expert Advisor:
int start()
{
   // saving the last value of the balance into the global variable
   GlobalVariableSet( "vGrafBalance", AccountBalance() );
   // saving the last value of the equity into the global variable
   GlobalVariableSet( "vGrafEquity", AccountEquity() );

   // Expert Advisor code

   return(0);
}
The indicator code:
#property indicator_separate_window
#property indicator_buffers 1
#property indicator_color1 Red

double equity[];

int init()
{
    IndicatorShortName( "vGrafEquity" );
    IndicatorDigits( 2 );

    SetIndexStyle( 0, DRAW_LINE );
    SetIndexBuffer( 0, equity );
    SetIndexLabel( 0, "Equity" );
}
int start()
{
    equity[0] = GlobalVariableGet( "vGrafEquity" );
    return(0);
}
Example of use:

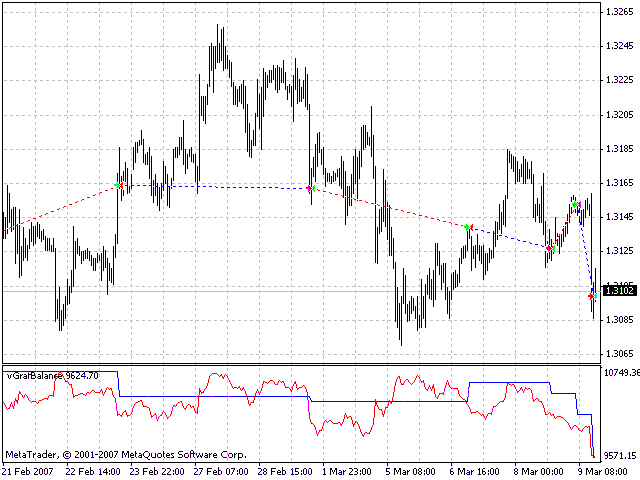
We may attach one indicator to the another one to view the correlation of two characteristics:

Conclusion
The article describes the process of creating indicators, visualizing the account
state. We have analysed the simplest indicators - Balance and Equity indicators.
You can create any other graph: percentage of profitable trades, expected payoff,
Average lot or Profit of a position in points - everything is available.
The information can be beautifully presented!