ZUP - Universal ZigZag with Pesavento Patterns. Part 1
Eugeni Neumoin | 9 July, 2007
Introduction
Everybody who takes working on financial markets seriously, start creation of their individual trading systems earlier or later. The author of this present article created ZUP, ZigZag Universal with Pesavento Patterns, as a result of this search. The MetaQuotes Software Corp. suggested me writing an article about this indicator. This present article is the first attempt to do it. In this and in the successive articles, I will describe the features of indicator ZUP, version 60 (ZUP_v60). It happened so that Data Centers through that the author accessed to financial markets were using the MetaTrader 4 platform. The standard indicators embedded in the trading terminal did not provide necessary analyses of the market with necessary efficiency. I prefer to arrange the place where I am rather than to find another one. Therefore, I had to do so that I would be able to make all necessary market analyses using the MetaTrader 4 Client Terminal, which allows creation of one's own indicators using its embedded language, MQL4.
During the year elapsed since I started to develop my indicator, many interesting ideas have appeared. Many of them have been implemented. The fact that the indicator had an open code and was freely accessed contributed to the influx of information and ideas. This is a principal decision to develop an uncommercial indicator. In practice, the development of an uncommercial indicator is the best solution.
Theoretical Considerations
After a short research, I decided to combine ZigZags with different algorithms and automated building of Pesavento Patterns and Fibo Levels of the ZigZag fractures in one universal indicator. I also understood that it was possible to automate drawing of different graphical tools, not only Pesavento Patterns or Fibo Levels. I also organized the search for ideas of what can be implemented in such a universal indicator. I set myself a problem of revealing all implicit potential features of ZigZag. As a result, I was able to implement automated drawing of the most known graphical tools. Some new graphical tools, the ideas of which were proposed by various visitors of the forum at ONIX, were implemented, too. The indicator's logic is simple:
- place quotes of the selected symbol to the indicator's input;
- find the market maximums and minimums in the chart using various ZigZags;
- anchor various graphical tools onto the above maximums and minimums.
Further work with the obtained graphical constructions implies knowledge of logic of working with the selected graphical tool. In this present article, ZigZags embedded in the ZUP will be described. There will also mentioned some graphical tools used in the ZUP. They will be described in more details in the second article devoted to the use of embedded graphical tools. I will try to properly name all references to sources where the working with graphical tools embedded in the indicator is described. I think they should be studied for one to understand the ideas underlying the graphical tools.
The book I have recently read is referenced to as [1]. The subtitle of this book is Secrets of Golden Section. The book tells about how the Golden Section appears in all natural phenomena. After that, I read the book referenced as [2]. These two sources helped me to understand in what direction the indicator develops. My previous development was a bit chaotic. Below are some citations from Yu.N. Sokolov's book:
"Do the foundations of the universe exist and, if yes, what are these? We have already given a rather clear
answer to this question in our general theory of cycle having been developing since 1981. Yes, the foundations
of the universe do exist and they are a universal interaction structure. Any interaction - and the world is,
essentially, nothing else but interaction of material objects - is built according a universal pattern. This
pattern is cyclic, i.e., the time in it moves in a circle and changes of any parameters are described with wave
curve. We called this pattern 'interaction quantum'… Studying of the interaction quantum structure resulted in our conclusion of that the entire outworld is described
by only one law – by the law of cyclic structure of the interaction quantum's space-time…" [2:7, translated by MetaQuotes Software Corp., 2007]
In an interaction, two forces participate.
"The Golden Section is a constant of the interaction quantum … A question occurs where the limit to increasing
of one force and decreasing of the other force is. There must be such a limit, this results from the reasoning
below. Let us imagine that there is no such a limit. Then we can increase the one force and descrease the other
one down to zero. This results in that the only one force remains, and this is the same as if there were no interaction
at all. This is impossible, of course. Therefore, there is a limit to increasing the one force and decreasing
the other one. The problem of limits in changing the forces can, in our opinion, be solved using the Golden Section. The Russian science experiences recovery in recent years concerning the role of the Golden Section in different
fields of science and technology. Scientists have brought out clearly that the Golden Section is a universal
constant. However, the nature of the Golden Section is still unexplored. We think that this nature can only be
studied within the general cycle theory (GCT)…". [2:29, translated by MetaQuotes Software Corp., 2007]
How the central tenets of the GCT can be applied in scientific research. The fluctuative nature of interaction is determined by a "game" or interaction of two opposed and mutually
causal forces, trends. It is this "game" that determines the cycle structure. Therefore, to apply the
general theory of cycle, it is necessary to start with the most important thing – with detecting those two
opposed forces. When investigating different systems, we will have different names for those forces. If we consider
interaction in inorganic nature, those forces will be active/reactive forces… It is the most important thing
for further analysis to detect the forces clearly in every research. After two opposed trends have been found,
it is necessary to set two opposed and mutually causal cycle poles. One pole is composed of the maximalvalue
of the positive force and the minimal value of the negative force. The second pole is opposite to the first one
and is composed of the minimal value of the positive force and the maximal value of the negative force. As shown
above, these are these poles, between which the oscillatory process takes place.
The next stage consists in finding a parameter that would detect the inertial mass and rate of changing the two
opposed forces. The process rate is tracked within a certain period of time, a sequence diagram is built by the
procedure described above. The sequence diagram shows the wave length, the amplitude and the oscillatory "gap"
size. If it is necessary, the interference of neighboring cycles towards the given cycle…» [2:46, translated by MetaQuotes Software Corp., 2007]
I will not give figures and formulas from the work [3] here. They are rather interesting.
You can read this work yourselves if you wish.
It is not very difficult to detect the two opposed forces on financial markets
- those are Bulls and Bears. To find the cycle poles (extremums) on financial markets,
we use ZigZag in our ZUP indicator. There are many algorithms for drawing a ZigZag
indicator. Indicators ZigZag based on different algorithms are embedded in the
ZUP. It is very important to find exact locations of extremums for both time and
price, i.e., the extremums must be placed precisely on the maximum or minimum of
the corresponding price bar. It is necessary to forecast the further development
of the cycle properly. Various graphical tools are used to research interactions
between the cycle poles. Since the golden Section appears in all natural phenomena,
different Fibo tools are emphasized in ZUP. Graphical tools are anchored to the
market extremums found using ZigZag.
Graphical tools embedded in the ZUP can be static and dynamic. The static ones
are anchored to the zigzag breaks already formed, i.e., to the breaks that will
not change anymore. The dynamic ones have their anchoring point located on the
first ray of the zigzag that changes its location all the time. The dynamic graphical
tools allow to make a quick decision. If the market develops, the design of the
graphical tool will help us to see the intended further market trend. If the first
ray of ZigZag changes, the dynamic graphical tool will be rebuilt automatically.
Description of ZigZags Embedded in the ZUP
The ZUP has many different parameters. The main parameter is the ExtIndicator. It chooses a ZigZag that will help to find the market extremums. The ExtIndicator number is set one after another as new ZigZags or modes are embedded into the ZUP. I would like to precondition that, whatever ZigZag is used, it is not recalculated on every tick. It is recalculated if:
- the price falls outside the null bar (the market goes above the null bar's High level, below the null bar's Low level, or a new null bar appears);
- the earlier history is pumped;
- the terminal has been started at pumping of history that had appeared during the terminal was off.
All ZigZag indicator styles are set using parameter ExtStyleZZ:
- ExtStyleZZ = true - sets the ZigZag line styles using the COLORS tab (menu Charts->Indicators->ZUP_v60->Properties->Colors);
- ExtStyleZZ = false - the ZigZag is shown as points at minimums and maximums.
The First ZigZag
ExtIndicator = 0 enables the standard ZigZag provided in the MetaTrader 4 Client
Terminal before summer 2006. This ZigZag was slightly modified. The ideas for modifying
were taken from the article published by Nikolay Kositsin: Multiple Null Bar Re-Count in Some Indicators. I also used my own solutions. Below are setup parameters for this ZigZag:
- minBars corresponds with ExtDepth in the ZigZag provided within MetaTrader 4;
- ExtDeviation corresponds with ExtDeviation;
- ExtBackstep corresponds with ExtBackstep.
The Second ZigZag
ExtIndicator = 1 enables Alex's ZigZag (Automatic Channel).
Algorithm
The average value of the first bar is calculated. Then the conditional average price
of a bar is calculated. The trend direction in the next bar is detected by the
shift of the bar conditional average price. The trend changes if the conditional
average price deviates by a given value in points minSize or minPercent in percents.
Parameters:
- minSize -filtering by the amount of points, gives the amount of points;
- minPercent - percentage filter, gives the percentage, for example, 0.5.
If you use percentage, set the desired value whereas minSize = 0.
Третий ZigZag
ExtIndicator = 2 allows working with ZigZag Ensign. ZigZag Ensign is a conditional
name. This version of the ZigZag was developed after I had observed the operating
of the indicator underlying Pesavento Patterns built in Ensign. On the website of Ensign Softwar, there was a short description of this indicator's building principles.
The algorithm of the indicator realized in Ensign can slightly differ from that
realized in the ZUP.
Algorithm.
The first bar's minimum and maximum are compared to those of the follow-up bars.
If a bar is found where the minimum and the maximum values are larger/smaller than
those of the first bar, the trend direction is determined. If the minimum and maximum
are larger than those of the first bar - it is the bullish trend. If they are smaller
- it is the bearish trend. Then the algorithm for the bullish market (uptrend)
is described. For the bearish trend (downtrend) - vice versa. The trend is determined
as an uptrend. Store the bar maximum value in the hlast variable. If the next bar
maximum value is above that of the preceding bar, the next bar will continue the
bullish trend. Store the new value of the bar maximum hlast. If the maximums are
equal, the trend is considered not to be changed. the trend remains bullish. If
on the next bar the bar maximum is below the preceding maximum (hlast), the following
alternatives appear:
- The minBars of the bars are skipped. For each of those minBars of the bars, the maximum must be below that of the last bar (hlast), from which the counting of minBars started. If at least on one bar the price exceeds the maximum of the last bar (hlast), the trend will be considered to be bullish up to and including this bar. The minBars of the bars are calculated starting from the next bar. Then the bars are analyzed starting from the bar numbered as minBars + 1. If hlast – Low[minBars + 1] > minSize, the trend becomes bearish. I.e., if the minimum of the bar numbered as minBars + 1 or that of any successive bar deviates from the hlast by a value exceeding the minSize, the trend changes and becomes bearish. In this case, the bar numbered as minBars + 1 is counted starting from the last maximum (hlast) in the direction of the null bar.
- If any of minBars is closed below the last minimum, the trend will become bearish, too, without waiting for the bar numbered as minBars + 1 to income. Trend changes and the new ZigZag ray is drawn after closing the bar, on which the trend has turned.
Parameters
minBars, minSize – the names are the same as in the Ensign.
Alex's ZigZag and Ensign ZigZag do not have disadvantages of the standard ZigZag:
the processor is not overloaded, only the last bar is calculated, no successive
maximums occur, the last minimums and maximums are predictable. Besides, the last
maximum can only grow and the last minimum can only decrease. Those are trend indicators.
On the other hand, it is necessary to search in parameters for Alex's ZigZag and
Ensign ZigZag on different timeframes. The search in parameters is necessary to
find the proper wave structure on different timeframes. For the ZigZag ExtIndicator
= 0, the same parameters can be used in different timeframes.
The Fourth ZigZag
ExtIndicator = 3 - allows working with the ZigZag Ensign with a bit modified algorithm.
Here, only minBars value should be specified. The minSize value given in the indicator
window will be ignored. The minSize value is variable and equal to the size (from
the minimum to the maximum) of the bar, on which the last ray of the ZigZag indicator
ends. At re-drawing of the last ray of the ZigZag indicator, the new value of the
minSize is calculated.
The Fifth ZigZag
ExtIndicator = 4 enables the Tauber's ZigZag. Tauber is a poster at the ONIX forum.
I will describe it here by courtesy of the author:
"I used MetaTrader as the basis (ZigZag embedded in the MetaTrader 4 Client Terminal - nen's note). The algorithm is recursive, short and logically comprehensive:
- The global maximum is sought among all bars.
- The remaining bars are divided into two parts from the right and from the left of the maximal bar.
- The global minimum is sought in both halves.
- Each half is divided into two parts again, and so on.
The process is monitored in the same way as in the ZigZag, but by only one parameter - the percentage or the difference in pips." (Translated by MetaQuotes Software Corp., 2007)
Some more citations:
"The algorithm is recursive - the function that finds the maximum calls by
itself the function that finds the minimum, and vice versa. It is the way they
divide the chart into smaller and smaller fractals. The process stops when the
difference in prices between the successive maximum/minimum and the nearest minimum/maximum
becomes smaller than the minSize. The main difference is in that the result depends
on the only parameter, the minSize, which is the classical definition of the ZigZag
and provides accurate finding of all the important peaks."
The Sixth ZigZag
ExtIndicator = 5 enables a ZigZag that simulates Gann Swings. It's a trend indicator.
Algorithm
A detailed description of how to build Gann Swings is given in [4]. Some well-known
indicators to build Gann Swings were created by the algorithm described by the
author of this book. The description is very detailed and you could even say boring.
But, nevertheless, there are many questions that occur when you try to follow the
description and build the indicator. There are some combinations of candlesticks
that are not easy to analyze. Swings are difficult to build, too. You can interpret
the current situation in different ways. This is, perhaps, the reason why the known
realizations of Gann Swings in indicators have some deviations from the algorithm
described in the book.
In our case, there are two deviations. They both relate to the processing of the
external bar. External bar is a bar that has High higher and Low lower than the
preceding one. The above-mentioned book says that a Maximum and a Minimum must
be built on the external bar. But it is impossible to work in the ZUP with a ZigZag
having both the maximum and the minimum within the same bar. Moreover, the description
says that the maximum and the minimum must alternate in a certain sequence. The
external bar extremum that is the closest to the candlestick opening must go first.
This can be realized in the real time. But when it comes down to history, a "loose
interpretation" starts. So, swings built in the real time can differ from
those built on the same period of time, but after it has become history. I.e.,
where there was a maximum in the real time, we can get a minimum when building
swings on historical data of the same period. To avoid any ambiguousness, the trend
will continue the trend that had prevailed before the external bar came. However,
since the trend must change on the external bar, according to the description,
let us consider for the intermediate, main trend and for trends of higher orders
the external bar as a bar, from which the count of bars starts to detect a possible
further trend. This is the main difference. As compared to other indicators building
Gann Swings, this difference slightly impacts swing detection. "Small"
swings that should have been on the external bar did not play any role in the overall
picture. In some cases, the indicator found swings skipped by other indicators
on significant periods of historical data.
The second deviation is insignificant. In some cases, this deviation helps to find
swings on flat periods of quotes history. It is rather difficult to describe this
deviation in a popular language within the scope of this article, so I will omit
it here. I followed, in a manner, other programmers who had relized swings in their
indicators. I processed the external bar in the way that it became similar to realizations
in other indicators. However, I did not study its realizations in other indicators.
I didn't see other indicator codes either. It is difficult to read others' codes.
I only looked at the picture made by the other indicator.
Parameters
minBars sets the trend:
- minBars = 0 - small trend - one-bar trend;
- minBars = 1 - intermediate trend - two-bar trend;
- minBars = 2 - main trend - three-bar trend;
- minBars > 2 - a trend of higher level.
DT Mode
The DT mode was first utilized by klot in his indicator named DT-ZigZag.mq4. In this mode, the current timeframe chart
will show a ZigZag built on a larger timeframe. The building algorithm in ZUP differs
from that developed by klot. Only his idea was used.
In the DT mode, the external ZigZags are used. The external ZigZags have different
building algorithms. You should use the ZigZags provided in the latest available
ZUP versions:
- ExtIndicator = 6 - the DT mode with the external indicator ZigZag_new_nen3.mq4. Its algorithm corresponds with the ZigZag from the mode of ExtIndicator = 0;
- ExtIndicator = 7 - the DT mode with the external indicator DT_ZZ.mq4. DT_ZZ.mq4 was developed by klot;
- ExtIndicator = 8 - the DT mode with the external indicator CZigZag.mq4. CZigZag. mq4 was developed by Candid;
- ExtIndicator = 10 - the DT mode with Gann Swings with the external indicator Swing_ZZ. mq4. Its algorithm corresponds with the ZigZag from the mode of ExtIndicator = 5.
When the ZUP is being installed, four external ZigZags should be stored in the folder
containing custom indicators of the client terminal.
Parameters
GrossPeriod - the amount of minutes of the timeframe underlying the ZigZag drawing
in the DT mode. GrossPeriod can take the following values: 5-15-30-60-240-1440-10080-43200
with the timeframes of M5-M15-M30-H1-H4-D1-W1-MN, respectively. For all DT modes,
GrossPeriod sets the larger timeframe, which provides data to build the ZigZag
on the current timeframe. Along with GrossPeriod, parameters minBars, ExtDeviation
and ExtBackstep are used to set up the ZigZag:
- for ExtIndicator = 7, the ZigZag is set up only by the minBars value;
- for ExtIndicator = 8, the ZigZag is set up by values of minBars and ExtDeviation;
- for ExtIndicator = 10, the ZigZag is set up only by the minBars value.
Drawing in the Chart
The chart below shows the exemplary drawing of a ZigZag on the 4-hour timeframe
using data from the daily timeframe. The red points are located on minimums and
maximums of 4-hour candlesticks that go to make up daily candlesticks. The ZigZag
breakpoints were drawn on the corresponding daily candlesticks. The six red points
correspond with the six 4-hour candlesticks.
There come up situations when for the maximum or minimum of the larger timeframe
candlestick it is not possible to find candlesticks with the corresponding maximum
or minimum on a smaller timeframe. Then the ZigZag breakpoints will be built on
the value of price taken from a larger timeframe. Since there are no candlestick
with the same price on a smaller timeframe, the sequence of points will "hang
in the air", as well as the ZigZag breakpoints. Here we can use the ZigZagHighLow
to choose the point, to which we can anchor the tools - Pesavento Patterns, Andrews' Pitchfork, and so on:
- ZigZagHighLow = true - tools are anchored to the minimums and maximums of bars on a smaller timeframe;
- ZigZagHighLow = false - tools are anchored to the ZigZag breakpoints, i.e., to minimums and maximums of bars on a larger timeframe.
Let us consider the exemplary drawing of several ZigZags from different timeframes. There are two ZUP_v60 with ExtIndicator = 6 in the chart. We can select points color and diameter in the COLORS tab, number is 5. The first indicator has Grossperiod = 10080. Points color is Red and diameter is 5. ZigZag lines color is Maroon selected in the COLORS tab of the indicator parameters window, number is 0. The amount of red points is 16. There are 16 4-hour candlesticks in a weekly candlestick. The second indicator has GrossPeriod = 1440. Points color is DarkGreen, points diameter is 1. The ZigZag lines color is Aqua. The amount of dark green candlesticks is 6. There are six 1-hour candlesticks in a daily candlestick.
To superimpose results from different indicators, as shown in our example above (dark green points are superimposed over the red ones), it is necessary to keep the order of attaching ZUP indicators to the chart. First, attach the indicator with red points. Then - with dark green ones. An important property of this method: If we change the timeframe of the chart with the given set of indicators (4-hour for weekly), the indicator with dark green points will not be shown in the chart. the indicator with dark green points uses data of the daily timeframe. The daily timeframe is smaller compared to the weekly one. In the DT mode, the ZigZag is build on a smaller timeframe on the data taken from the larger one. Therefore, ZigZag of the smaller, the daily, timeframe should not be shown on the weekly timeframe. When switching to the timeframe larger than the daily one, the daily timeframe data should not be displayed. The indicators of the above example on a daily chart are displayed below. The amount of points changed. There are 5 red points now since the amount of daily candlesticks in a weekly candlestick is five. And there is 1 dark green point there now.
Red and dark green points help to find the timeframe, the data of which were used to build the respective ZigZag. For better understanding, all drawings within each timeframe can be made under one color scheme. In particular, in DT mode, the points for different timeframes can be of different, predefined colors.
One more important addition. When working in the DT mode on timeframe GrossPeriod,
the history depth must be larger than that on the working timeframe. If this is
not provided, ZigZag will be drawn falsely when it goes on a smaller timeframe
into the deeper history than that of the GrossPeriod. Also, when working in the
DT mode, skipping of quotes on different timeframes will cause false ZigZag drawing.
If the ZigZag has been built falsely in the DT mode, for example, two minimums
and two maximums one by one have been built, it is necessary to check quotes of
the current timeframe and those of the GrossPeriod for whether there are any skipped
bars. If there are skipped bars, it is necessary to remove the history of the corresponding
timeframe from C:\Program Files\MetaTrader\history\xxx\ and reload the history.
ZigZag on RSI Indicator
ExtIndicator = 9 is an operation mode in a window under the chart containing RSI. A special version of ZUP has been developed, ZUP_RSI_v48, where this mode is involved to build the ZigZag on data of the RSI. ExtIndicator = 9 is used only in ZUP_RSI_v48. This version does not utilize features that have become available in version 49 and in later versions. After version 48 has been attached to the chart, it is necessary to change timeframe for the system to start drawing graphical tools. The ZigZag is drawn on RSI using a trend algorithm. Below is an example of drawing the ZUP_RSI_v48 in the mode of ExtIndicator = 9 on the chart from the previous example. Speaking somewhat previously, I would say that ZUP_RSI_v48 helped to show Pesavento Patterns and static Andrews' Pitchfork in the chart.
Parameters used in the mode of ExtIndicator = 9 (some concepts that occur below in description of this version will be explained in the second article):
- minBars - RSI Period - averaging period to calculate the index;
- Price - selection of price, on which the RSI will be drawn for the RSI mode:
0 - PRICE_CLOSE - close price;
1 - PRICE_OPEN - open price;
2 - PRICE_HIGH - the highest price;
3 - PRICE_LOW - the lowest price;
4 - PRICE_MEDIAN - the median price, (high+low)/2;
5 - PRICE_TYPICAL - the typical price, (high+low+close)/3;
6 - PRICE_WEIGHTED - the weighted close price, (high+low+close+close)/4;
- minPercent - specifies the amount of "RSI indicator points", after which the new ZigZag ray will appear.
This mode limitations:
- The only one indicator can be shown. The second and all following indicator copies won't work correctly.
- I didn't closely specify levels of 100% and 0%. This is why the ZigZag's peaks and troughs won't coincide with those of RSI. The ZigZag will be shown within the full window height. When the chart is rescaled, the ZigZag will be rescaled, too.
- I didn't correct the displaying of Andrews' Pitchfork for certain candlesticks in this version. This is not so actual for this mode.
All other ZUP tools work in this mode including the bars counting on the ZigZag ray which is very interesting for research. All modes set by ExtIndicator work, as well. ZigZag with all its tools is displayed in a window below the chart, not in the chart window. There are, perhaps, some defects in this version. It is rather difficult to test the indicator for such a non-standard mode. This version is intended for experiments.
Search for Gartley Patterns
ExtIndicator = 11 includes ExtIndicator = 0 into the active scanning mode to search for Gartley Patterns. The active scanning mode used to search for Gartley Patterns is very processor-intensive. When the market moves intensively, the terminal may hang for a certain period of time. When the calculation loop is finished, it stops hanging. Active scanning searches in the minBars (Depth). A ZigZag is built for each value of minBars (Depth). Then the Gartley Patterns are searched for on the ZigZag drawn. This operation repeats for the entire range of the minBars (Depth) values, from minDepth to maxDepth until a Gartley pattern is found. The indicator uses the following parameters:
- ExtGartleyOnOff - enables Gartley patterns show for all modes but ExtIndicaotr = 11. So, if a pattern has been drawn for the selected mode, it will be found. There will not be any search in the ZigZag parameters. Gartley patterns are searched for on the only drawn ZigZag. This parameter does not relate to mode ExtIndicator = 11;
- maxDepth - sets the maximum value for the ZigZag's Depth parameter to range at active scanning to search for Gartley Patterns. This parameter should be used less frequently in order to reduce the load of processor. However, a too small value will not allow finding some patterns, so the parameter should be sorted out by experiment;
- minDepth - sets the minimum value of Depth to search for Gartley Patterns;
- DirectionOfSearchMaxMin - sets the direction for searching in Depth:
false - from minDepth to maxDepth;
true - from maxDepth to minDepth.It is better to use true: The "larger" Gartley patterns will be found first of all. In some cases, there are several patterns formed in the "working area". I.e., D points of patterns coincide or are very close. At active scanningб the search is stopped as soon as the first pattern is found. So this allows to choose what pattern will be found the first: the smallest or the largest one.
- maxBarToD - sets the largest amount of bars from null bar to the pattern's D point. If no pattern is found in this area, no search for patterns will be performed after this amount of bars. It is important for trading that the D point is on bars close to the null bar. If it is far from the null bar, the pattern found can lose its importance for trading;
- ExtDeltaGartley - sets the tolerance of price deviation from the recommended pattern retracement values. By default, it is 0.09 to 9%;
- ExtCD - the value of the pattern's CD ray relative to the BC ray, after which the pattern analysis starts;
- ExtColorPatterns - color of the pattern's triangles.
To see what pattern is found, it is necessary to enable the infoTF. In the second line of comments, the name and the type (Bullish or Bearish) of the pattern will be shown. The active scanning algorithm is used to search for patterns. If a pattern is found, a ZigZag having the following parameters will be drawn:
- Depth - the value, at which the pattern was found on the drawn ZigZag;
- ExtDeviation and ExtBackstep - parameters set in the indicator's window.
The found pattern acts as if it calibrates the ZigZag with the found value. If no
pattern is found, a ZigZag with the following parameters will be built: minBars,
ExtDeviation and ExtBackstep as set in the ZUP.
In the names of triangles that color the patterns, we can see the value of ExtIndicator,
ZigZag parameters for the corresponding ExtIndicator and the amount of bars to
the D point. The triangle name is available through properties of the triangle.
Having opened the triangle properties, we will see in the graphical object name,
for example, *Triangl2_ExtIndicator=0_11/5/3_14 where:
- * - ZUP set number;
- Triangl2 - the right triangle of the pattern;
- ExtIndicator=0 - ZigZag, on which the pattern was drawn;
- 11/5/3 - minBars=11, ExtDeviation=5, ExtBackstep = 3;
- 14 - the amount of bars to the pattern's D point.
It can happen that the market moves intensively after a pattern has been found. Then the pattern is getting "lost". It means that the ZigZag, on which the pattern was found, has been redrawn. To re-build the "disappeared" pattern, you can switch to a smaller timeframe. There are more candlesticks on a smaller timeframe, so the ZigZag will be able to "catch" the lost pattern.
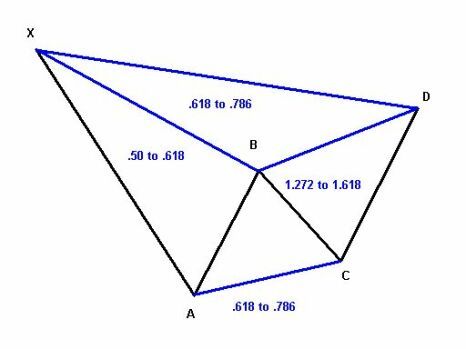
A Bearish Gartley Pattern Model
A Bullish Gartley Pattern Model
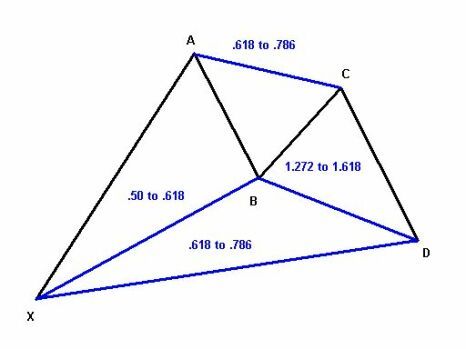
If we clearly build all retracements as described by Scott Carney (Harmonic Price Patterns), the pattern's D point will be in the range. The range is caused by the fact that the D point can be found using different retracements: the BD and the XD (the XD retracement is equal to the relationship between the AD and the XA. Retracement XD=AD/XA). These retracements do not often converge. Due to this uncertaintyб we can make a conclusion that the algorithm of "butterflies" drawing should be a "bulk". The algorithm must consider all permissible retracements in bulk. This is why we call it a "bulk" algorithm.
Where the butterfly is built using a "bulk" algorithm, a finer adjustment
starts using Pesavento Patterns and dynamic/static Fibo tools to clarify trading
conditions. ZUP finds a spatiotemporal formation and names it as one of Gartley
Patterns. Then we should work with this formation to clarify trading conditions.
To define netering points on the market, some filters should be used. Combinations
of candlesticks, trendlines, or other indicators can be utilized as filters. Below
is an example drawn in the mode of ExtIndicator = 11:
At that, I'm finishing review of ZigZags embedded in ZUP_v60.
Conclusion
The article gives a brief description of ideas underlying ZUP - ZigZag Universal
with Pesavento Patterns. It also describes ZigZags embedded in the ZUP. In the
author's opinion, the main ZigZag drawing algorithms are realized in the ZUP. This
allows a trader to select the most preferable algorithm to work with. All embedded
graphical tools included in the article will be automatically attached to the selected
ZigZag. It is possible that ZigZags based on other algorithms will be embedded
later.
In .zip files attached to the article, the set of ZUP_v60 and ZUP_RSI_v48 indicators
can be found. In the indicator version in the file, some errors have been eliminated.
Version ZUP_v60 initially uploaded in the ONIX forum has some errors. The indicator
is rather sophisticated. I would not rule out that, in some market situations,
some erroneous constructions can be made. The drawing errors can be caused by:
- errors in the indicator code;
- inaccuracy caused by special features of anchoring graphical tools to bars in MetaTrader 4. Particularly, Fibo Channels just cannot be built properly, in some cases;
- if a graphical tool is built using ZUP on a timeframe and saved on the chart, it often changes its own characteristics when switching to another timeframe in MetaTrader 4. So the graphical tool can appear as drawn in a wrong way. In my second article, I'm going to propose some changes of this feature to the developing team of MetaTrader 4. However, if the graphical tool is not saved on the chart, but used together with the ZUP, no erroneous constructions will appear when switching to another timeframe. This can be achieved by recalculation of anchoring points for graphical tools.
Errors of the 1st type can be corrected while they are found. I hope to eliminate
errors of type 2 and type 3 with the help of the Client Terminal developers. Indicators
and graphical tools embedded in the ZUP will be described in the next article.
List of References
- Stakhov, A., Sluchenkova, A., Scherbakov I. Kod da Vinci i ryadi Fibonacci (Da Vinci Code and Fibonacci Series). St. Petersburg, Publishing House 'Piter', 2007.
- Sokolov, Yu.N. Obschaya teoriya tsikla ili edinaya teoriya fizicheskikh vzaimodeystviy. Published by the North Caucasian State Technical University: Stavropol, 2003 (English version at http://www.ncstu.info/content/_docs/pdf/cycles/goldbook/06e.pdf).
- Sokolov, Yu.N. Obschaya teoriya tsikla.
- Hyerczyk, James A. Pattern, Price & Time: Using Gann Theory in Trading Systems. - John Wiley & Sons, Inc. 1998. 300 p.
- Carney, Scott M. The Harmonic Trader. 1999. 305 p.
- Pesavento, Larry. Fibonacci Ratios with Pattern Recognition. Edited by Steven Shapiro.
- Traders Press Inc. 1997
- Pesavento, Larry. Profitable Patterns for Stock Trading. - Traders Press Inc. 1999.