Tricolor Indicators and Some Opportunities for Maximal Simplification of Writing Indicators
Nikolay Kositsin | 13 July, 2007
Introduction
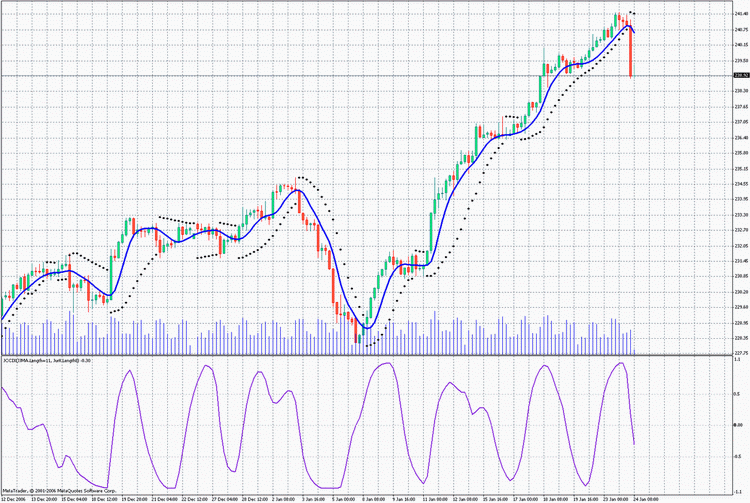
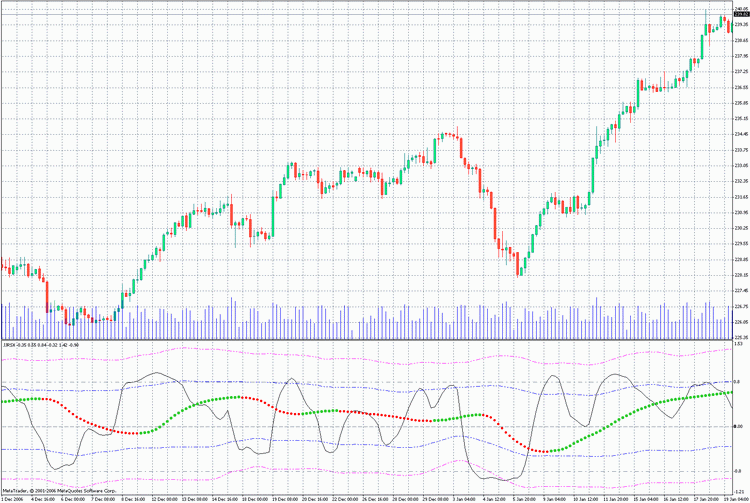
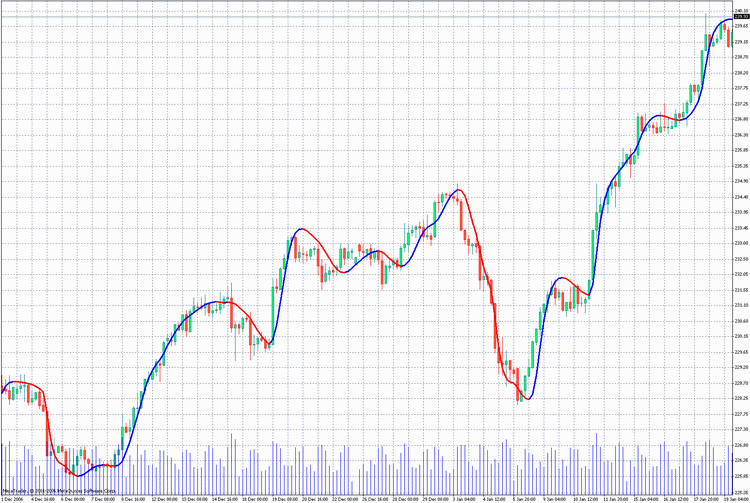
In many cases the best source of information remains color. Its change signals very vividly and promptly about the current changes in the market features. That is why tricolor trend indicators very often appear to be more informative and efficient than their monochrome analogs. Just look at the example, represented in two variants:
In a usual version with uncolored indicators of trend direction:
and a version, when the indicators are differentiatedly colored depending on the trend direction:
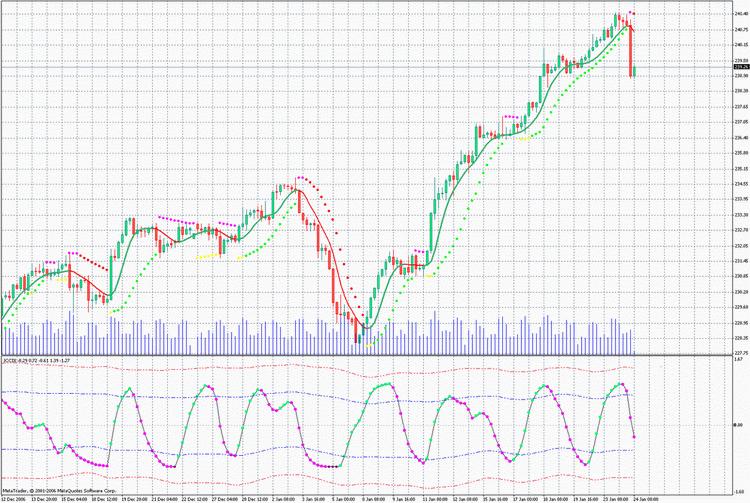
You can see that it is easier and clearer to work with the second chart! Building such indicators in MQL4 will not cause any problems. There is no serious increase in the resource consumption. So, not using this opportunity in trading means losing the possibility of simplifying the strenuous work of a constant observation of the market situation.
Let's learn to build such indicators.
Tricolor Indicator 3c_JJRSX1
First of all let's build a tricolor linear diagram based on the oscillator JJRSX:
iCustom(NULL,0,"JJRSX",Length,Smooth,Smooth_Phase,
        Input_Price_Customs,0,bar).
There shouldn't be any problems in writing a tricolor analogue, signalling about the trend change using color::
/*
For the operation of the indicator place the files
JJMASeries.mqh
JurXSeries.mqh
PriceSeries.mqh
into the folder (directory): MetaTrader\experts\include\
Heiken Ashi#.mq4
into the folder (directory): MetaTrader\indicators\
*/
//+------------------------------------------------------------------+
//|                                                    3c_JJRSX1.mq4 |
//|                           Copyright c 2006,     Nikolay Kositsin |
//|                              Khabarovsk,   farria@mail.redcom.ru |
//+------------------------------------------------------------------+
#property copyright "Copyright c 2006, Nikolay Kositsin"
#property link      "farria@mail.redcom.ru"
//---- drawing the indicator in a separate window
#property indicator_separate_window
//---- number of the indicator buffers
#property indicator_buffers  3
//---- colors of the indicator
#property indicator_color1  BlueViolet
#property indicator_color2  Magenta
#property indicator_color3  Gray
//---- width of the indicator lines
#property indicator_width1 3
#property indicator_width2 3
#property indicator_width3 3
//---- parameters of the horizontal levels of the indicator
#property indicator_level1  0.5
#property indicator_level2 -0.5
#property indicator_level3  0.0
#property indicator_levelcolor MediumBlue
#property indicator_levelstyle 4
//---- INPUT PARAMETERS OF THE INDICATOR
extern int        Length = 8;  // depth of the indicator smoothing
extern int        Smooth = 3; // depth of the additional JMA smoothing
// changing within the limits -100 ... +100,
// influences the quality of the transient process;
extern int  Smooth_Phase = 100;
/* Selecting prices, based on which the indicator will be calculated
(0-CLOSE, 1-OPEN, 2-HIGH, 3-LOW, 4-MEDIAN, 5-TYPICAL, 6-WEIGHTED,
7-Heiken Ashi Close, 8-SIMPL, 9-TRENDFOLLOW, 10-0.5*TRENDFOLLOW,
11-Heiken Ashi Low, 12-Heiken Ashi High, 13-Heiken Ashi Open,
14-Heiken Ashi Close.) */
extern int Input_Price_Customs = 0;
//---- indicator buffers
double Ind_Buffer1[];
double Ind_Buffer2[];
double Ind_Buffer3[];
//+------------------------------------------------------------------+
//| JJRSX initialization function                                    |
//+------------------------------------------------------------------+
int init()
  {
// styles of drawing the indicator
   SetIndexStyle(0,DRAW_HISTOGRAM, STYLE_SOLID);
   SetIndexStyle(1,DRAW_HISTOGRAM, STYLE_SOLID);
   SetIndexStyle(2,DRAW_HISTOGRAM, STYLE_SOLID);
// 4 indicator buffers are used for calculation
   SetIndexBuffer(0,Ind_Buffer1);
   SetIndexBuffer(1,Ind_Buffer2);
   SetIndexBuffer(2,Ind_Buffer3);
// setting the indicator values, which will be invisible on the chart
   SetIndexEmptyValue(0,0);
   SetIndexEmptyValue(1,0);
   SetIndexEmptyValue(2,0);
// names for window data and labels for subwindows
   SetIndexLabel(0,"Up_Trend");
   SetIndexLabel(1,"Down_Trend");
   SetIndexLabel(2,"Straight_Trend");
   IndicatorShortName("JJRSX(Length="+Length+")");
// Setting the format of accuracy (number of signs after a decimal point)
//for the visualisation of the indicator values
   IndicatorDigits(0);
// correction of the invalid value of the parameter Length
  if(Length<1)Length=1;
// setting the bar number, starting from which the indicator will be drawn
   int draw_begin=3*Length+30+1;
   SetIndexDrawBegin(0,draw_begin);
   SetIndexDrawBegin(1,draw_begin);
   SetIndexDrawBegin(2,draw_begin);
//---- end of the initialization
return(0);
  }
//+------------------------------------------------------------------+
//| JJRSX iteration function                                         |
//+------------------------------------------------------------------+
int start()
  {
// Declaration of the integer statistic variables
   static int time2;
// Declaration of the decimal static variables
   static double ValueM;
// Declaration of the decimal variables
    double Value0,Value1,trend;
// Declaration of the integer variables and retrievement of the calculated bars
    int bar,limit,MaxBar,Tnew,counted_bars=IndicatorCounted();
// check for errors
    if (counted_bars<0)return(-1);
// the last calculated bar should be recalculated
    if (counted_bars>0) counted_bars--;
// defining the number of the oldest bar,
// starting from which all bars will be recalculated
    MaxBar=Bars-3*Length-30;
    //---- defining the number of the oldest bar,
    //starting from which all new bars will be recalculated
    limit=Bars-counted_bars-1;
    //+--- zero initialization
    if (limit>=MaxBar)
      for(bar=Bars-1;bar>=MaxBar;bar--)
       {
        limit=MaxBar;
        Ind_Buffer1[bar]=0.0;
        Ind_Buffer2[bar]=0.0;
        Ind_Buffer3[bar]=0.0;
       }
//+--- retrieving the variable values
    Tnew=Time[limit+1];
    if (limit<MaxBar)
    if (Tnew==time2)
     {
      Value1=ValueM;
     }
    else
     {
      if (Tnew>time2)
           Print("Error in retrieving variables!!! Tnew>time2");
      else Print("Error in retrieving variables!!! Tnew");
      Print("Indicators will be recounted on all bars!!");
      return(-1);
     }
//----+ THE MAIN CYCLE OF CALCULATING INDICATORS
    while (bar>=0)
      {
       //+--- Saving the variables values +====+
     if (bar==1)
      {
       if(((limit==1)&&(time2==Time[2]))||(limit>1))
         {
          ValueM=Value1;
          time2=Time[bar];
         }
      }
     //+---+====================================+
        Value0=iCustom(NULL,0,"JJRSX",Length,Smooth,Smooth_Phase,
                       Input_Price_Customs,0,bar);
        if (bar==MaxBar)
          {
           Value1=Value0;
           continue;
          }
        //---- Tricolor indicator code
        trend=Value0-Value1;
        if(trend>0)
          {
            Ind_Buffer1[bar]=Value0;
            Ind_Buffer2[bar]=0;
            Ind_Buffer3[bar]=0;
          }
        else
          {
            if(trend<0)
              {
                Ind_Buffer1[bar]=0;
                Ind_Buffer2[bar]=Value0;
                Ind_Buffer3[bar]=0;
              }
            else
              {
                Ind_Buffer1[bar]=0;
                Ind_Buffer2[bar]=0;
                Ind_Buffer3[bar]=Value0;
              }
          }
        //----
        Value1=Value0;
        //----+
        bar--;
     }
    //---- end of the calculation of the indicator values
    return(0);
  }
//+--------------------------------------------------------------+
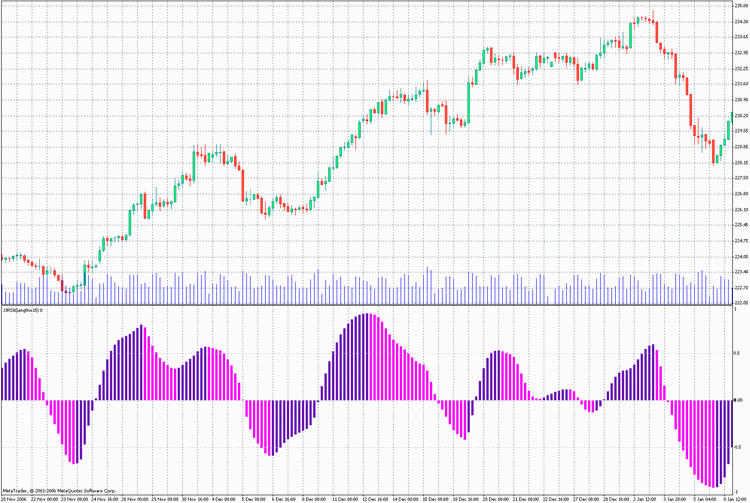
Three indicator buffers are used for the indicator, and for the values of the source indicator JJRSX on the first bar the valuable Value1 is used. Not to lose the value of the variable Value1 between ticks, it is saved in the static variable ValueM. Algorithm of the indicator compares the current value of the indicator with the value on the previous bar and places this value into the necessary indicator buffer. In order to make the analogous indicator on the basis of another custom indicator, you simply need to change the name of the custom indicator in the line of the reference to the custom indicator:
Value0=iCustom(NULL,0,"JJRSX",Length,Smooth,Smooth_Phase,
               Input_Price_Customs,0,bar);
In the line
MaxBar = Bars - 3*Length - 30;
change the calculation formula, also change the calculation formula in the line
int draw_begin = 3*Length + 30 + 1;
in the initialization block. And of course change the external variables into necessary ones. You can make the chart more informative by adding the indicator BollingerBands and the option of changing the form of the indicator from linear into a dot diagram. In addition, using this indicator as a template will cause some inconveniences in searching necessary lines for change inside the program code, which will not be changed in other tricolor charts. It would be more rational to place this program code into mqh-file and use it inside the indicator using the operator #include. Let's do it. In this case the indicator code acquires a simple form without any excessive elements. It is easily used as a template for writing other oscillator diagrams:
/*
For the operation of the indicator place files
JJMASeries.mqh
PriceSeries.mqh
3c_BB_Osc.mqh
into folder (directory): MetaTrader\experts\include\
JJRSX.mq4
Heiken Ashi#.mq4
nto folder (directory): MetaTrader\indicators\
*/
//+------------------------------------------------------------------+
//|                                                     3c_JJRSX.mq4 |
//|                               Copyright © 2006, Nikolay Kositsin |
//|                              Khabarovsk,   farria@mail.redcom.ru |
//+------------------------------------------------------------------+
#property copyright "Copyright © 2006, Nikolay Kositsin"
#property link      "farria@mail.redcom.ru"
//---- drawing the indicator in a separate window
#property indicator_separate_window
//---- number of the indicator buffers
#property indicator_buffers 8
//---- colors of the indicator
#property indicator_color1 Gray
#property indicator_color2 LimeGreen
#property indicator_color3 Red
#property indicator_color4 Purple
//---- Bollinger Bands colors
#property indicator_color5 Blue
#property indicator_color6 Blue
#property indicator_color7 Magenta
#property indicator_color8 Magenta
//---- width of the indicator lines
#property indicator_width1 2
#property indicator_width2 2
#property indicator_width3 1
#property indicator_width4 1
//---- style of the envelope line
#property indicator_style1 4
//---- style of Bollinger Bands line
#property indicator_style5 4
#property indicator_style6 4
#property indicator_style7 4
#property indicator_style8 4
//---- parameters of horizontal lines of the indicator
#property indicator_level1 0.0
#property indicator_levelcolor SteelBlue
#property indicator_levelstyle 4
//---- INPUT PARAMETERS OF THE INDICATOR
extern int  Length = 8;  // depth of JurX indicator smoothing
// depth of JJMA smoothing of the retrieved indicator
extern int  Smooth = 3;
// parameter changing within limits -100 ... +100, influences
// the quality of transient processes of smoothing
extern int  Phase = 100;
/* Selecting colors, based on which the indicator is calculated
(0-CLOSE, 1-OPEN, 2-HIGH, 3-LOW, 4-MEDIAN, 5-TYPICAL, 6-WEIGHTED,
7-Heiken Ashi Close, 8-SIMPL, 9-TRENDFOLLOW, 10-0.5*TRENDFOLLOW,
11-Heiken Ashi Low, 12-Heiken Ashi High,  13-Heiken Ashi Open,
14-Heiken Ashi Close.) */
extern int Input_Price_Customs = 0;
//---- Declaration of the function COUNT_begin() for counting the bar number,
// starting from which the indicator will be drawn and
// Bollinger Bands wikk be calculated
int COUNT_begin()
{int count_begin=2*Length+30;return(count_begin);}
//---- declaration of the function digits() for setting the accuracy format
// (number of signs after a decimal point) for the visualization
// of the indicator values
int digits(){return(2);}
//---- setting the indicator values, which will be invisible on the chart
int EmptyValue=0.0;
//---- Declaration of the name of the indicator
string Label = "JJRSX";

//---- Including into the indicator text its main text
#include <3c_BB_Osc.mqh>
//---- declaration of the function INDICATOR
//---- reference to the source indicator for retrieving the source values
double INDICATOR(int INDICATOR.bar)
 {
  return(iCustom( NULL, 0, "JJRSX", Length, Smooth, Phase,
         Input_Price_Customs, 0, INDICATOR.bar) );
 }
//---- ---------------------------------------------------------------+
The excessive code is placed in the file 3c_BB_Osc.mqh and is represented in the indicator by one line only
#include <3c_BB_Osc.mqh>
The mqh-file contains also the external variables for Bollinger Bands and for choosing the style of the chart presentation. Naturally, the file 3c_BB_Osc.mqh must be placed in the folder: \MetaTrader\EXPERTS\INCLUDE.
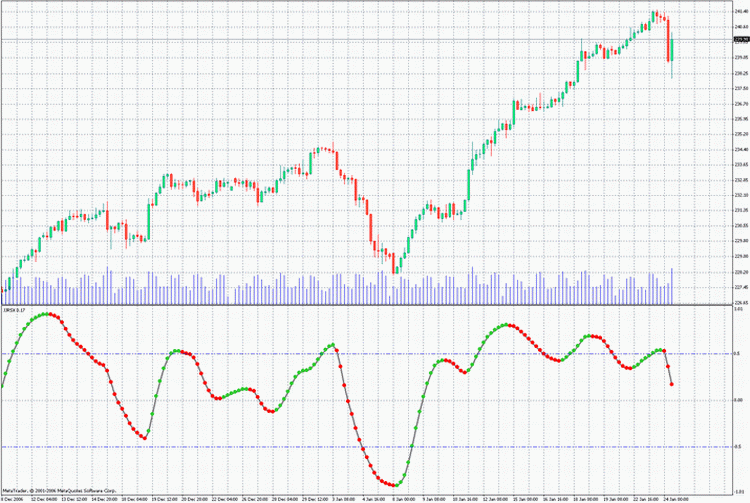
The Algorithm of Building a Tricolor Indicator
Now, to create a new tricolor oscillator, you simply need to save this file under a new name in the folder \MetaTrader\EXPERTS\indicators and make the following changes:
1. Choose the desired colors of the indicator elements and other parameters;
2. Insert new input parameters of the indicator, copying them from the custom indicator;
3. Insert into the function COUNT_begin() a formula for counting a start bar (usually it is enough to insert the external variable of the indicator, which determines the period or sum of this variable with the variable, performing the additional smoothing of the oscillator);
4. Insert into the line
digits()
  {
    return(2);
  }
the necessary value of the indicator accuracy. If the indicator changes from 0 to 100, insert zero, if the indicator changes from 0 to 1, insert 2 (two signs after the decimal point!);
5. Set up the indicator values, which will be invisible on the chart;
6. Create a name for the indicator;
7. Insert the reference to the custom indicator iCustom(). After that compile the code and the indicator is ready!
One more thing, which you could want to change, is to smooth a little the form of the oscillator. For this case you simply need to add the letter "J" into the name of the mqh-file in the text of the indicator: it was:
#include <3c_BB_Osc.mqh>
now
#include <3c_BBJ_Osc.mqh>
In compilation the file with JMA smoothing of the custom oscillator will be used.
A Tricolor Indicator 3c_JJRSX2
You can further improve the indicator. It would be rather convenient to add one more monochromic quick JJRSX, it would be quite reasonable. Let's divide the indicator by the analogue with the example into two parts, placing into the mqh-file the part of the code, which maximally simplifies the perception of the indicator (3c_BB_Osc2. mqh):
/*For the operation of the indicator place the files
JJMASeries.mqh
JurXSeries.mqh
PriceSeries.mqh
3c_BB_Osc2.mqh
into the folder (directory): MetaTrader\experts\include\
JJRSX.mq4
Heiken Ashi#.mq4
into the folder (directory): MetaTrader\indicators\
*/
//+------------------------------------------------------------------+
//|                                                    3c_JJRSX2.mq4 |
//|                               Copyright c 2006, Nikolay Kositsin |
//|                              Khabarovsk,   farria@mail.redcom.ru |
//+------------------------------------------------------------------+
#property copyright "Copyright c 2006, Nikolay Kositsin"
#property link      "farria@mail.redcom.ru"
//---- drawing the indicator in a separate window
#property indicator_separate_window
//---- the number of the indicator buffers
#property indicator_buffers 8
//---- colors of the indicator
#property indicator_color1 Gold
#property indicator_color2 LimeGreen
#property indicator_color3 Red
#property indicator_color4 Purple
//---- Bollinger Bands colors
#property indicator_color5 Blue
#property indicator_color6 Blue
#property indicator_color7 Magenta
#property indicator_color8 Magenta
//---- width of the indicator lines
#property indicator_width1 1
#property indicator_width2 2
#property indicator_width3 1
#property indicator_width4 1
//---- style of the envelope line
#property indicator_style1 4
//---- style of Bollinger Bands lines
#property indicator_style5 4
#property indicator_style6 4
#property indicator_style7 4
#property indicator_style8 4
//---- parameters of the horizontal levels of the indicator
#property indicator_level1  0.0
#property indicator_level2  0.8
#property indicator_level3 -0.8
//---- INPUT PARAMETERS OF THE INDICATOR
//---- input parameters of the quick monochromic JJRSX
extern int  Length1 = 8;  // depth of JurX smoothing of the indcator
// depth of JJMA smoothing of the retrieved indicator
extern int  Smooth1 = 3;
// parameter changing within limits -100 ... +100,
//influences the quality of transient process of smoothing
extern int  Phase1 = 100;
//Selecting prices, based on which the indicator will be calculated
extern int Input_Price_Customs1 = 0;
/*(0-CLOSE, 1-OPEN, 2-HIGH, 3-LOW, 4-MEDIAN, 5-TYPICAL, 6-WEIGHTED,
7-Heiken Ashi Close, 8-SIMPL, 9-TRENDFOLLOW, 10-0.5*TRENDFOLLOW,
11-Heiken Ashi Low, 12-Heiken Ashi High,  13-Heiken Ashi Open,
14-Heiken Ashi Close.) */
//---- input parameters of the slow tricolor JJRSX
extern int  Length2 = 40;  // depth of JurX smoothing of the inidcator
// depth of JJMA smoothing of the retrieved indicator
extern int  Smooth2 = 12;
// parameter changing within limits -100 ... +100,
// influences the quality of transient process of smoothing
extern int  Phase2 = 100;
// Selecting prices, based on which the indicator will be calculated
extern int Input_Price_Customs2 = 0;
/*(0-CLOSE, 1-OPEN, 2-HIGH, 3-LOW, 4-MEDIAN, 5-TYPICAL, 6-WEIGHTED,
7-Heiken Ashi Close, 8-SIMPL, 9-TRENDFOLLOW, 10-0.5*TRENDFOLLOW,
11-Heiken Ashi Low, 12-Heiken Ashi High,  13-Heiken Ashi Open,
14-Heiken Ashi Close.)*/
//---- The style of performing the horizontal lines of the indicators
extern int    Levels_Style = 3;         // Style of levels lines
extern int    Levels_Width = 0;         // Width of leevls lines
extern color  Levels_Color = SlateGray; // color of levels lines
//---- Declaration of the function COUNT_begin() for counting the bar number,
// starting from which the indicator will be drawn and
// Bollinger Bands will be calculated
int COUNT_begin(){int count_begin=2*Length2+30;return(count_begin);}
//---- declaration of the function digits() for setting the accuracy format
//(number of signs after the decimal point) for the visualization of the
//indicator values
int digits(){return(2);}
//---- setting the indicator values, which will be invisible on the chart
int EmptyValue=0.0;
//---- Determining the indicator name
string Label = "JJRSX";

//---- Including into the indicator text its main text
#include <3c_BB_Osc2.mqh>
//---- declaration of the function INDICATOR1
//---- reference to the source indicator for retrieving source values
double INDICATOR1(int INDICATOR1.bar)
 {
  return(iCustom( NULL, 0, "JJRSX", Length1, Smooth1, Phase1,
         Input_Price_Customs1, 0, INDICATOR1.bar) );
 }
//---- declaration of the function INDICATOR2
//---- reference to the source indicator for retrieving source values
double INDICATOR2(int INDICATOR2.bar)
 {
  return(iCustom( NULL, 0, "JJRSX", Length2, Smooth2, Phase2,
         Input_Price_Customs2, 0, INDICATOR2.bar) );
 }
//---- --------------------------------------------------------------+
The indicator code has not become much more complicated, now it includes two references to the custom indicator JJRSX and two groups of the external indicator parameters, equal to the number of JJRSX indicators. There shouldn't be any problems in using these indicators as templates for building similar charts based on some other oscillators.
Tricolor Moving Averages
Now let's dwell on the variants of writing tricolor moving averages. At first site we could write a code absolutely analogous to the one described in the first example. But the previous chart can have one disadvantage: if the moving direction changes on each bar, there will be juxtaposition of colors, which is not normal. The only way to avoid this disadvantage is to use three more buffers! Three additional buffers are not likely to make such indicator too much lengthy, if the excessive code is placed in a mqh-file. As for writing a tricolor moving average, it will be identical to previous ones:
/*
For the operation of the indicator place files
JJMASeries.mqh
PriceSeries.mqh
3Color.mqh
into folder (directory): MetaTrader\experts\include\
J2JMA.mq4
into folder (directory): MetaTrader\experts\indicators\
*/
//+------------------------------------------------------------------+
//|                                                     3c_J2JMA.mq4 |
//|                           Copyright c 2006,     Nikolay Kositsin |
//|                              Khabarovsk,   farria@mail.redcom.ru |
//+------------------------------------------------------------------+
#property copyright "Copyright c 2006, Nikolay Kositsin"
#property link "farria@mail.redcom.ru"
//---- drawing the indicator in the main window
#property indicator_chart_window
//---- number of indicator buffers
#property indicator_buffers 6
//---- indicator colors
#property indicator_color1 Blue
#property indicator_color2 Blue
#property indicator_color3 Red
#property indicator_color4 Red
#property indicator_color5 Gray
#property indicator_color6 Gray
//---- INPUT PARAMETERS OF THE INDICATOR
extern int Length1 = 5;   // depth of the first smoothing
extern int Length2 = 5;   // depth of the second smoothing
// parameter of the first smoothing, changing within limits -100 ... +100,
//influences the quality of the transient process;
extern int Phase1  = 100;
// parameter of the second smoothing, changing within limits -100 ... +100,
//influences the quality of the transient process;
extern int Phase2  = 100;
/* Choosing prices, based on which the indicator is calculated
(0-CLOSE, 1-OPEN, 2-HIGH, 3-LOW, 4-MEDIAN, 5-TYPICAL, 6-WEIGHTED,
7-Heiken Ashi Close, 8-SIMPL, 9-TRENDFOLLOW, 10-0.5*TRENDFOLLOW,
11-Heiken Ashi Low, 12-Heiken Ashi High,  13-Heiken Ashi Open,
14-Heiken Ashi Close.) */
extern int Input_Price_Customs = 0;
//---- declaration of the function digits() to set up the accuracy format
// (number of signs after the decimal point) for the visualization of the
// indicator values
int digits(){return(Digits);}
//---- Declaration of the function COUNT_begin() for calculation of the bar number,
//starting from which the indicator will be drawn
int COUNT_begin(){return(60);}
//---- setting the indicator parameters, which will be invisible on the chart
int  EmptyValue=0;
//---- lable for the indicator
string Label="J2JMA";
//---- inserting into the indicator text its main text
#include <3Color.mqh>
//---- declaration of the function INDICATOR
//---- reference to the source indicator to retrieve source values
double INDICATOR(int INDICATOR.bar)
 {
  return(iCustom(NULL,0,"J2JMA",Length1,Length2,Phase1,Phase2,0,
         Input_Price_Customs,0,INDICATOR.bar) );
 }
//---- --------------------------------------------------------------+
It should be noted, that for moving averages you shouldn't change anything when setting the format of accuracy for moving averages!
int digits()
  {
    return(Digits);
  }
If the moving average, which you want to present in a tree-color variant, is unsteady, it can be easily smoothed. Just add in the line
#include <3Color.mqh>
the letter "J". We get:
#include <3ColorJ.mqh>
Indicator Templates, Build on the Basis of Larger Timeframes
Here are two more indicator templates, built on the basis of a larger timeframe, they also can be build based on any moving average or oscillator
//----+ - - - - - - - - - - - - - - - - - - - - - - - - - - - - - - -+
//Version  July 1, 2006                                              |
//Editing   Nikolay Kositsin  15.06.2006  farria@mail.redcom.ru      |
//----+ - - - - - - - - - - - - - - - - - - - - - - - - - - - - - - -+
/*
Building a moving average on the current timeframe based on another,
larger timeframe. Attention!!! Indicator values are recalculated not
on the last bar, but on the number of bars, equivalent to a
candlestick of the large timeframe!

For the operation of the indicator place files
JJMASeries.mqh
PriceSeries.mqh
HTF.mqh
into folder (directory): MetaTrader\experts\include\
J2JMA.mq4
Heiken Ashi#.mq4
into folder (directory): MetaTrader\indicators\
*/
//+------------------------------------------------------------------+
//|                                                    J2JMA_htf.mq4 |
//|                            Copyright c 2005, GS  Conversion only |
//|                    http://www.gustis.narod.ru/;     gsb51@mail.ru |
//+------------------------------------------------------------------+
#property copyright "  Copyright c 2005, GS  Conversion only"
#property link      " http://www.gustis.narod.ru/;     gsb51@mail.ru"
//---- drawing the indicator in the main window
#property indicator_chart_window
//---- number of indicator buffers
#property indicator_buffers  4
//---- indicator colors
#property indicator_color1 BlueViolet
#property indicator_color2 Lime
#property indicator_color3 Red
#property indicator_color4 Gray
//---- width of indicator lines
#property indicator_width1 3
#property indicator_width2 1
#property indicator_width3 1
#property indicator_width4 3
//---- style of indicator lines
#property indicator_style1 0
//---- INPUT PARAMETERS OF THE INDICATOR
//Parameters of custom indicator iCustom
extern int Length1 = 5;   // depth of the first smoothing
extern int Length2 = 5;   // depth of the second smoothing
// parameter of the first smoothing, changing within limits -100 ... +100,
//influences the quality of the transient process;
extern int Phase1  = 100;
// parameter of the second smoothing, changing within limits -100 ... +100,
//influences the quality of the transient process;
extern int Phase2  = 100;
//Choosing prices, based on which the indicator is calculated
extern int Input_Price_Customs = 0;
/*
//---- INPUT PARAMETERS HTF +--------------------------------------------+
extern int  TFrame_Period = 240; // The larger period in minutes
// smoothing of the moving average. The most optimal value is equal
// to the relation of the larger timeframe periods to the chart period
extern int         Smooth = 48;
extern bool Trend_Visible = true;// visualization of the trend indication
// minimal speed of the moving average, considered as a trend
extern int  Trend_Minimum = 5;
extern int         Shift  = 0;   // shift of the indicator along the time axis
*/
//---- declaration of the function digits() to set up the accuracy format
// (number of signs after the decimal point) for the visualization of the
// indicator values
int digits(){return(Digits);}
//---- setting the indicator parameters, which will be invisible on the chart
int EmptyValue=0;
string Label="J2JMA";
//---- inserting into the indicator text its main text
#include <HTF.mqh>
//---- declaration of the function INDICATOR
//---- reference to the source indicator to retrieve source values
double INDICATOR(int INDICATOR.bar)
 {
  return(iCustom(NULL,TFrame_Period,"J2JMA",Length1,Length2,Phase1,Phase2,
         0,Input_Price_Customs,0,INDICATOR.bar) );
 }
//---- -----------------------------------------------------------+
For a normal operation of the moving average both charts should be open! Note that history data on the both charts must all be from one broker!
As for the last moving average, it should be noted, that at its seemingly indicative trend nature, attaching it to an Expert Advisor is senseless. No matter what wanders it could promise, it will not happen in reality! The moving average is recalculated not on the last bar of the current timeframe, but on the last bar of a larger timeframe! Multiple attempts of this Sisyphean labor, as expected, brought no results!
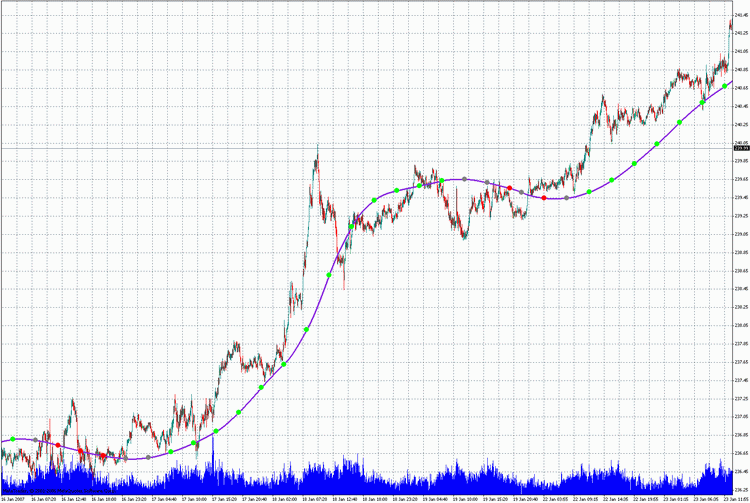
In this case we should explain the main point of the algorithm, which is in the basis of this indicator. The values, by which the indicator is build, are taken from the bars of the larger timeframe. After the smoothing of the price raw is calculated, the retrieved values are transferred onto a smaller timeframe, the lacking intermediary values of the smaller timeframe are added on by the method of linear interpolation. But as the chart has the form of a polygonal line, we would naturally want to smooth it. It is done in this indicator!
After such transformations this curve acquires a rather graceful form, but still is calculated by the number of bars of a smaller timeframe, equivalent to one candlestick of a larger timeframe. And finally, it should be noted, that the ability to put an excessive program code into mqh-file is especially convenient in building not only indicators, but also experts. It allows saving huge amount of labor, releases from routine, makes programming a rather fascinating and interesting work.
/*
//----+ - - - - - - - - - - - - - - - - - - - - - - - - - - - - - - -+
//Version  July 1, 2006                                              |
Editing   Nikolay Kositsin  15.06.2006  farria@mail.redcom.ru        |
//----+ - - - - - - - - - - - - - - - - - - - - - - - - - - - - - - -+
Building a moving average on the current timeframe based on another,
larger timeframe. Attention!!! Indicator values are recalculated not
on the last bar, but on the number of bars, equivalent to a
candlestick of the large timeframe!

For the operation of the indicator place files
JJMASeries.mqh
PriceSeries.mqh
HTF_Channal.mqh
into folder (directory): MetaTrader\experts\include\
J2JMA.mq4
Heiken Ashi#.mq4
into folder (directory): MetaTrader\indicators\
*/
//+------------------------------------------------------------------+
//|                                            J2JMA channel_htf.mq4 |
//|                            Copyright c 2005, GS  Conversion only |
//|                    http://www.gustis.narod.ru/;     gsb51@mail.ru |
//+------------------------------------------------------------------+
#property copyright "  Copyright c 2005, GS  Conversion only"
#property link      " http://www.gustis.narod.ru/;     gsb51@mail.ru"
//---- drawing the indicator in the main window
#property indicator_chart_window
//---- number of indicator buffers
#property indicator_buffers  6
//---- indicator colors
#property indicator_color1 BlueViolet
#property indicator_color2 Gray
#property indicator_color3 Gray
#property indicator_color4 Lime
#property indicator_color5 Red
#property indicator_color6 Gray
//---- width of indicator lines
#property indicator_width1 3
#property indicator_width2 0
#property indicator_width3 0
#property indicator_width4 1
#property indicator_width5 1
#property indicator_width6 1
//---- style of indicator lines
#property indicator_style1 0
#property indicator_style2 4
#property indicator_style3 4
//---- INPUT PARAMETERS OF THE INDICATOR
//Parameters of custom indicator iCustom
extern int Length1 = 5;   // depth of the first smoothing
extern int Length2 = 5;   // depth of the second smoothing
// parameter of the first smoothing, changing within limits -100 ... +100,
//influences the quality of the transient process;
extern int Phase1  = 100;
// parameter of the second smoothing, changing within limits -100 ... +100,
//influences the quality of the transient process;
extern int Phase2  = 100;
//Choosing prices, based on which the indicator is calculated
extern int Input_Price_Customs = 0;
/*
//---- INPUT PARAMETERS HTF +--------------------------------------------+
extern int  TFrame_Period = 240; // The larger period in minutes
extern int         Smooth = 48;  // smoothing of the moving average
extern bool Trend_Visible = true;// visualization of the trend indication
// minimal speed of the moving average, considered as a trend
extern int  Trend_Minimum = 5;
extern int         Shift  = 0;   // shift of the indicator along the time axis
*/
//---- declaration of the function digits() to set up the accuracy format
// (number of signs after the decimal point) for the visualization of the
// indicator values
int digits(){return(Digits);}
//---- setting the indicator parameters, which will be invisible on the chart
int EmptyValue=0;
string Label="J2JMA";
//---- inserting into the indicator text its main text
#include <HTF_channel.mqh>
//---- declaration of the function INDICATOR
//---- reference to the source indicator to retrieve source values
double INDICATOR(int INDICATOR.bar)
 {
  return(iCustom(NULL,TFrame_Period,"J2JMA",Length1,Length2,Phase1,Phase2,
         0,Input_Price_Customs,0,INDICATOR.bar) );
 }
//-------------------------------------------------------------------+
Conclusion
In this article we analyzed the building of tricolor charts and tricolor moving averages based on the available code fragments, which were put into mqh-files. Using the above described procedure of building tricolor indicators, using the given examples as templates, you can easily build analogous indicators based on any moving averages and oscillators. Using this method you can also build indicators, displaying data from other timeframes, which can be rather convenient, when placed on one chart, allowing to observe processes that take place in different time scales simultaneously.
The zip-file NK_library.zip contains more than hundred indicators, written using different algorithms of smoothing. These indicators are more than enough to learn to use the above described examples for writing other analogous indicators. All indicators from the zip-file with the versions of smoothing function operate with Expert Advisors without errors. Save the indicators from the zip-file in the folder of a client terminal MetaTrader 4: \MetaTrader\EXPERTS\indicators. The functions of smoothing and fragments of program code are in the folder INCLUDE. All the files from this folder should be saved in the folder of the client terminal MetaTrader 4: \MetaTrader\EXPERTS\INCLUDE.