Drawing Horizontal Break-Through Levels Using Fractals
Victor Chebotariov | 5 September, 2008
Fractals
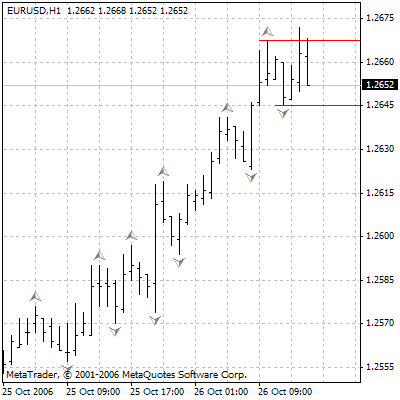
Fractals are one of five indicators of Bill Williams' trading strategy that allows you to find a top or a bottom. The technical definition of an up-fractal is a series of minimum five sequential bars, which has two bars with lower maximums located directly before the highest maximum and after it. The opposite configuration (a series of five bars, which has two bars with higher minimums located directly before the lowest minimum and after it) corresponds to down-fractals. The fractals have the High and Low values and are marked with the arrows on the chart.

If you look at the chart carefully, you'll understand that overpassing the fractal level often tends to continue the movement in the fractal's direction. At a rising market, this kind of overpassing serves for keeping on a long position, the low level of a fractal is the support level overpassing which will be a signal for closing the long position. Everything works in the same manner, but reversely, at a down-trend. Using this strategy at a flat market will produce no results.
Indicator of Fractal Levels
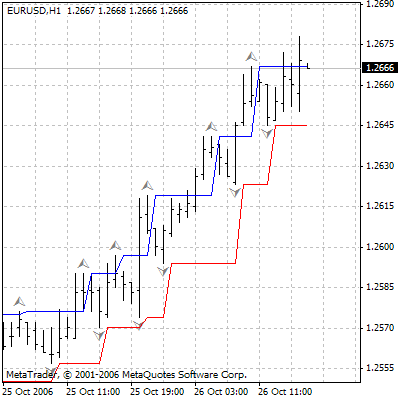
In order to determine the level of the last upper or lower fractal more simply, we can write a simple indicator that will draw these levels with the horizontal lines.
Using the "Expert Advisor Wizard" we will create the main body of the indicator. To do it we should execute the sequence of commands "File -> Create" or press the  button at the toolbar. The "Expert Advisor Wizard" will be opened on the screen.
- At the first step you should choose "Custom Indicator".
- At the second step you should specify the name, author, link and parameters, as we will use the Fractals indicator for our indicator we won't have any adjustable paremeters, so we specify just the name, author and link.
- At the third step the wizard offers us to specify the parameters of displaying the custom indicator. As our indicator should be displayed on the main chart, we do not check the "Indicator in separate window" field. Further we are offered to determine the indexes. We will need two indexes: one for the level of the upper fractal and the other for the level of the lower fractal. Both indexes will have the "Line" type, we choose the Blue color for the first index and the Red color for the second index, and then press the "Finish" button.
The creation of the body of the program is finished, it should be as follows:
//+------------------------------------------------------------------+
//|                                                 FractalsLine.mq4 |
//|                             Copyright © 2006, Victor Chebotariov |
//|                                      http://www.chebotariov.com/ |
//+------------------------------------------------------------------+
#property copyright "Copyright © 2006, Victor Chebotariov"
#property link      "http://www.chebotariov.com/"

#property indicator_chart_window
#property indicator_buffers 2
#property indicator_color1 Blue
#property indicator_color2 Red
//---- buffers
double ExtMapBuffer1[];
double ExtMapBuffer2[];
//+------------------------------------------------------------------+
//| Custom indicator initialization function                         |
//+------------------------------------------------------------------+
int init()
  {
//---- indicators
   SetIndexStyle(0,DRAW_LINE);
   SetIndexBuffer(0,ExtMapBuffer1);
   SetIndexStyle(1,DRAW_LINE);
   SetIndexBuffer(1,ExtMapBuffer2);
//----
   return(0);
  }
//+------------------------------------------------------------------+
//| Custom indicator deinitialization function                       |
//+------------------------------------------------------------------+
int deinit()
  {
//----

//----
   return(0);
  }
//+------------------------------------------------------------------+
//| Custom indicator iteration function                              |
//+------------------------------------------------------------------+
int start()
  {
   int    counted_bars=IndicatorCounted();
//----


//----
   return(0);
  }
//+------------------------------------------------------------------+
Now it only remains to add a little piece of code and our indicator will be ready.
We need:
1. To calculate the value of the indicator for each bar on the current chart, to do it we need the cycle:
int i=Bars-counted_bars-1;

while(i>=0)
  {
   // Here we calculate the value of the indicator for each bar (i)
   i--;
  }
2. To get the values of the upper and lower fractals:
double upfrac_val=iFractals(NULL,0,MODE_UPPER,i+1);
double lofrac_val=iFractals(NULL,0,MODE_LOWER,i+1);
3. The most important - to memorize the value of the last fractal, to do it we will have recourse to the global variables:
if(upfrac_val>0)
  {
   GlobalVariableSet(Symbol()+Period()+"upfrac",upfrac_val);
  }
else if(lofrac_val>0)
  {
   GlobalVariableSet(Symbol()+Period()+"lofrac",lofrac_val);
  }
4. It is left to read the data from the global variables and pass it to our indexes:
ExtMapBuffer1[i] = GlobalVariableGet(Symbol()+Period()+"upfrac");
ExtMapBuffer2[i] = GlobalVariableGet(Symbol()+Period()+"lofrac");
The ready state of our indicator has the following appearance:
//+------------------------------------------------------------------+
//|                                                 FractalsLine.mq4 |
//|                             Copyright © 2006, Victor Chebotariov |
//|                                      http://www.chebotariov.com/ |
//+------------------------------------------------------------------+
#property copyright "Copyright © 2006, Victor Chebotariov"
#property link      "http://www.chebotariov.com/"

#property indicator_chart_window
#property indicator_buffers 2
#property indicator_color1 Blue
#property indicator_color2 Red
//---- buffers
double ExtMapBuffer1[];
double ExtMapBuffer2[];
//+------------------------------------------------------------------+
//| Custom indicator initialization function                         |
//+------------------------------------------------------------------+
int init()
  {
//---- indicators
   SetIndexStyle(0,DRAW_LINE);
   SetIndexBuffer(0,ExtMapBuffer1);
   SetIndexStyle(1,DRAW_LINE);
   SetIndexBuffer(1,ExtMapBuffer2);
//----
   return(0);
  }
//+------------------------------------------------------------------+
//| Custom indicator deinitialization function                       |
//+------------------------------------------------------------------+
int deinit()
  {
//----

//----
   return(0);
  }
//+------------------------------------------------------------------+
//| Custom indicator iteration function                              |
//+------------------------------------------------------------------+
int start()
  {
   int    counted_bars=IndicatorCounted();
//----
   int i=Bars-counted_bars-1;

   while(i>=0)
     {
      double upfrac_val=iFractals(NULL,0,MODE_UPPER,i+1);
      double lofrac_val=iFractals(NULL,0,MODE_LOWER,i+1);
      if(upfrac_val>0)
        {
         GlobalVariableSet(Symbol()+Period()+"upfrac",upfrac_val);
        }
      else if(lofrac_val>0)
        {
         GlobalVariableSet(Symbol()+Period()+"lofrac",lofrac_val);
        }
      ExtMapBuffer1[i] = GlobalVariableGet(Symbol()+Period()+"upfrac");
      ExtMapBuffer2[i] = GlobalVariableGet(Symbol()+Period()+"lofrac");
      i--;
     }
//----
   return(0);
  }
//+------------------------------------------------------------------+
It is left to compile it executing the menu command "File -> Compile" or pressing the  button at the toolbar.
Newly-made indicator can be attached to a chart.

Practical Application
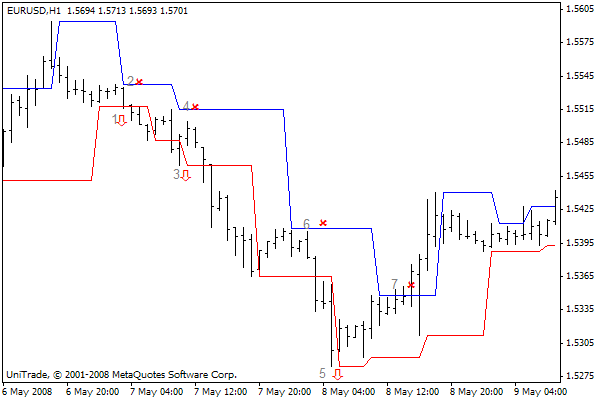
In the first instance, the fractal levels can be useful while moving the StopLoss level under the red line at a rising market. You should keep the StopLoss above the blue line at a receding market. In such a manner the safe intelligent distance between the StopLoss and the market will be ensured.
For example, we entered the market (see the chart, mark 1) with the stop above the blue line (mark 2), if the red line is broken through (mark 3) we move the StopLoss (mark 4), if a new breakthrough occurred (mark 5), we move the StopLoss analogously (mark 6). If the blue line is broken through (mark 7), we liquidate the position.

In order to use the FractalsLine as a trailing-stop we should add two small pieces of code into the EA:
Getting the data from the FractalsLine indicator:
double FLU = iCustom(NULL,0,"FractalsLine",0,0); // Blue fractal line
double FLL = iCustom(NULL,0,"FractalsLine",1,0); // Red fractal line
Trailing-stop based on the FractalsLine indicator:
if(Close[0]>FLU) //Trailing-stop for the long positions
  {
   if(OrderStopLoss()<FLL-3*Point || OrderStopLoss()==0)
     {
      OrderModify(OrderTicket(),OrderOpenPrice(),FLL-3*Point,OrderTakeProfit(),0,Green);
      return(0);
     }
  }
if(Close[0]<FLL) //Trailing-stop for the short positions
  {
   if(OrderStopLoss()>FLL+(Ask-Bid+3)*Point || OrderStopLoss()==0)
     {
      OrderModify(OrderTicket(),OrderOpenPrice(),FLL+(Ask-Bid+3)*Point,OrderTakeProfit(),0,Red);
      return(0);
     }
  }
The implantation of the trailing-stop based on the FractalsLine indicator into the MACD Sample expert advisor brought a positive result. This can be seen from the comparative tests.
Testing of the Standard MACD Sample
| Symbol | EURUSD (Euro vs US Dollar) | ||||
| Period | 1 Час (H1) 2008.01.02 12:00 - 2008.06.30 23:00 (2008.01.01 - 2008.07.01) | ||||
| Model | Every tick (the most precise method based on all available least timeframes) | ||||
| Parameters | TakeProfit=50; Lots=0.1; TrailingStop=30; MACDOpenLevel=3; MACDCloseLevel=2; MATrendPeriod=26; | ||||
| Bars in test |
4059 | Ticks modelled |
1224016 | Modelling quality |
90.00% |
| Missmatched charts errors | 1 | ||||
| Initial deposit |
10000.00 | ||||
| Total net profit |
182.00 | Gross profit |
1339.00 | Gross loss |
-1157.00 |
| Profit factor | 1.16 | Expected payoff |
3.79 | ||
| Absolute drawdown |
697.00 | Maximal drawdown |
827.00 (8.16%) | Relative drawdown |
8.16% (827.00) |
| Total trades |
48 | Short positions (% won) | 28 (82.14%) | Long positions (% won) | 20 (85.00%) |
| Profit trades (% of total) | 40 (83.33%) | Loss trades (% of total) | 8 (16.67%) | ||
| Largest | profit trade | 50.00 | loss trade | -492.00 | |
| Average | profit trade | 33.48 | loss trade | -144.63 | |
| Maximum | consecutive wins (profit in money) | 14 (546.00) | consecutive losses (loss in money) | 3 (-350.00) | |
| Maximum | consecutive profit (count of wins) | 546.00 (14) | consecutive loss (count of losses) | -492.00 (1) | |
| Average | consecutive wins | 7 | consecutive losses | 1 | |

Testing of MACD Sample with Trailing-stop Based on the FractalsLine Indicator
| Symbol | EURUSD (Euro vs US Dollar) | ||||
| Period | 1 Hour (H1) 2008.01.02 12:00 - 2008.06.30 23:00 (2008.01.01 - 2008.07.01) | ||||
| Model | Every tick (the most precise method based on all available least timeframes) | ||||
| Bars in test |
4059 | Ticks modelled |
1224016 | Modelling quality |
90.00% |
| Missmatched charts errors | 1 | ||||
| Initial deposit |
10000.00 | ||||
| Total net profit |
334.00 | Gross profit |
1211.00 | Gross loss |
-877.00 |
| Profit factor |
1.38 | Expected payoff |
5.14 | ||
| Absolute drawdown |
211.00 | Maximal drawdown |
277.00 (2.75%) | Relative drawdown |
2.75% (277.00) |
| Total trades |
65 | Short positions (% won) | 41 (41.46%) | Long positions (% won) | 24 (62.50%) |
| Profit trades (% of total) | 32 (49.23%) | Loss trades (% of total) | 33 (50.77%) | ||
| Largest | profit trade |
50.00 | loss trade | -102.00 | |
| Average | profit trade | 37.84 | loss trade | -26.58 | |
| Maximum | consecutive wins (profit in money) | 3 (150.00) | consecutive losses (loss in money) | 4 (-168.00) | |
| Maximum |
consecutive profit (count of wins) | 150.00 (3) | consecutive loss (count of losses) | -168.00 (4) | |
| Average | consecutive wins | 2 | consecutive losses | 2 | |

Conclusion
The mentioned tests show that the profitableness has grown up and the drawdown has decreased as well, using the FractalsLine.