Trading Tactics on Forex
Trading Tactics
After having analyzed the market, a trader needs to know whether he or she will speculate for a rise or for a fall. Besides, the trader has to decide what part of his or her capital to invest into a trade. And, finally, the last step is buying or selling of a contract. This is the most difficult stage of trading at margin markets where the precision of entering and leaving the market is very important. The final decision about how and when to enter the market must be based on the combination of technical factors, equity management and order type.
The precising the market entering/quitting time based on technical analyses is specific for very short-term nature of such analyses. It is determined by days, hours, and even minutes, but not by weeks or months. In all cases, the same technical tools are used. The most common principles of these analyses are given below.
- Tactics at Price Breaks.
There are three variations of the trader's action at price breaks:
-
to take a position in advance, forecasting the break;
-
to open a position when the break is in progress;
-
to wait for the inevitable rollback after break.
There are pros and contras about each of the above approaches, sometimes a combined approach is used. When working with several lots, a trader can open one position at each of the three stages. One can open a small position before the forecasted break, then buy some more immediately after the break, and finally open additional positions at an insignificant price fall during correction that follows the break. If one trades with small positions, two questions will have impact on one's decisions first of all:-
what amount of money can one risk on this trade?
-
how agressive will one act?
The most conservative trader will in this situation open a long position at the rollback. However, paradoxical as it is the wait-and-see tactics can also be risky meaning one can miss the opportunity to enter the market while waiting for a rollback.
-
- Trendline Cross
This alert allows to enter the market or to leave it early enough, especially if a significant, many times "approved" trendline has been crossed. Of course, other technical factors should not be left out.
If a trendline is used as a support/resistance level, long positions will be opened when prices fall to the level of a stable up-trend line, short positions will be opened when prices rise to the down-trend level.
- Support/Resistance Levels
A break of the support level can be a signal to open a long position, which can later be protected using a stop order. The latter can be placed below the nearest support level or, to be more protective, just below the break level, which now will perform a supporting function.
Prices rising to the resistance level at a down-trend and falling to the support level at an up-trend can be used to open new positions and to add lots to profitable positions already opened. When choosing protective stop levels, it is important to take support/resistance levels into consideration.
- Price Correction
For an up-trend, the intermediate price falls that make percentages of the previous growth by Fibonacci can be used to open new or additional long positions. It must be noted that, in this case, analysis of percentages of correction length relates to very short market movements.
A proper moment to open a long position would be a 38-% price rollback that takes place after a Bull break at an up-trend. It would be rather reasonable to open short positions when, at a down-trend, prices jump up covering 38 to 62% of the preceding fall length.
- Gaps
Price gaps that are formed on bar charts can also be sued to choose a proper moment to open or close positions. For example, gaps formed during price growth often become support levels. That is why, at an up-trend, it is reasonable to open long positions when prices fall to the upper border of the gap or a bit below it. A stop order can be placed below the gap. At a down-trend, an open position should be opened when prices reach the lower border of the gap or a bit above it. The protective stop order is placed above the gap, in this case.
- Averaging
Averaging is a trading strategy used when one has made a mistake or just made a trade (the first coming to one's mind) and the price has moved against, and one makes a new operation of the same type but at a more profitable price. The most important disadvantage of averaging is that one cannot know to what price the market will go against the trader. The averaging demands to invest a double amount of money compared to that invested before. If one has much money on the account, he or she can stand the price movement of 100, 200 and even more pips. Such movements are not very frequent on the market, though. This strategy is not the best one, especially if you have made a mistake by trend direction sensing.
Practicable Strategies
-
a strong long trend will warn you when you work against it on short positions;
-
you will gain self-reliance when playing with a short position in the long trend direction.
Another strategy consists in working on middle-termed trends, up to a few days long. It is also desirable to secure with options, which are most attractive for amateur traders. The middle-sized positions are more stable for gaining profits, though such a play needs more complicated analyses. The trading quality also depends on the ability to play a short-term game (to choose the right time for opening/closing a position). To open a middle-sized position, on has to both make a technical analysis and be attentive about news: Are any fundamental news income before the position is closed? Are any regional markets closed at that time? Psychological factors will pale into insignificance. For all its external stability, the market must be closely watched as it can spring all possible surprises at the very wrong time. If you play a middle-term game based on fundamental factors, you should also make sure that the technical analysis does not contradict your positions.
The third strategy consists in opening a position for a short time, from a few minutes to a few hours. This strategy is used by professionals. Pros: there is no risk of unfavorable fundamental news and price changes during the time when you are away. Contras: large expenditures (commissions, spread, internet providing, etc.), high probability of unfavorable price movements, the necessity of steady monitoring, concentration and exertion during the working day. The main help can be provided by occilators (you should follow the rules of open time choosing). You should not rejoice at small profits obtained using this strategy. You are in danger to lose all profits gained for a long time and on many trades.
Recommended Practices of Forex Trading Tactics
A trading technique consists of five stages:
- trend detection;
- detection of the rollback start point;
- detection of the rollback end point;
- getting confirmation from another indicator or system;
- entering the market with placing stop order and TP.
Let us consider all these stages in more details by the example of a trading technique based on MACD. Let's use MACD with periods of 5, 13, 8.
We will consider that:
- it is the up-trend when the average on the MACD is above zero and there is no bull divergence with the price, i.e., every new peak in the price chart is confirmed by the next peak of the indicator (average on the MACD);
- it is the down-trend when the average on the MACD is below zero and there is no bear converegence with the price, i.e., every new trough in the price chart is confirmed by the next trough of the indicator (average on the MACD);
- the rollback starts if the slow line is met by the quick line top-down; this requires an up-trend, i.e., the average on the MACD is above zero and there is no bull divergence;
- the rollback in the up-direction starts if the slow line is met by the quick line bottom-up; this requires a down-trend, i.e. the average on the MACD is below zero and there is no bear converegence.
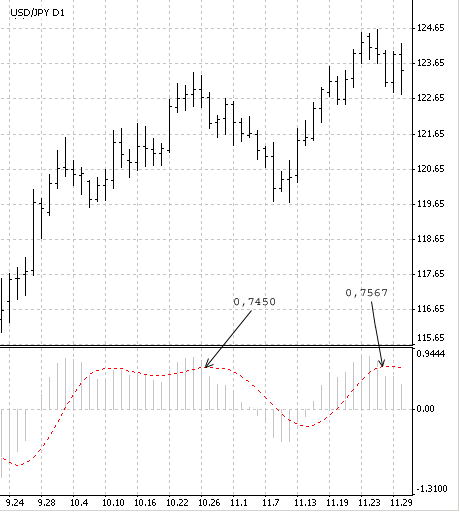
Stage 1. Trend Detection on a Daily Chart.

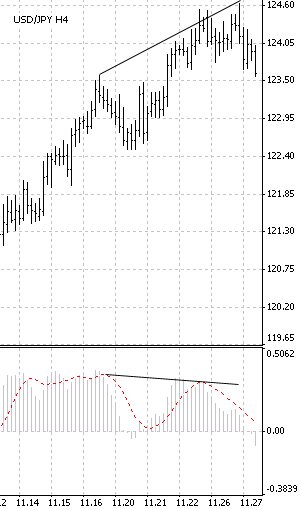
Stage 2. Detection of the Rollback Start Point.

Since there is a bull divergence on the average of MACD on the 4-hour chart, the rollback will really start on the daily timeframe.
Stage 3. Detection of the Rollback End Point.
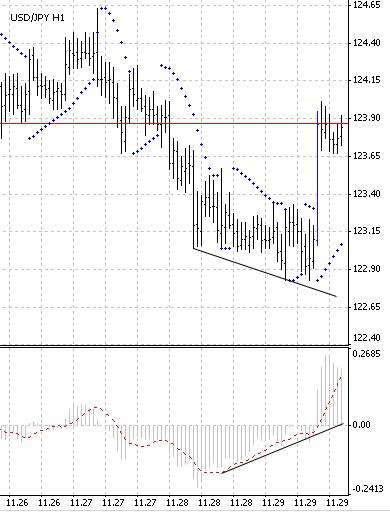
The end point of the rollback can be detected by either bear convergence on the average of MACD on a 4-hour chart or bear convergence on the average of MACD on a 1-hour chart. The signal from the 4-hour chart will be stronger, of course. But the one-hour convergence will be enough, too. In Fig. 3 (one-hour chart), bear convergence means that the rollback ends.
Stage 4. Getting Confirmation from Another Indicator or System.

Stage 5. Placing Stop Order and TP.
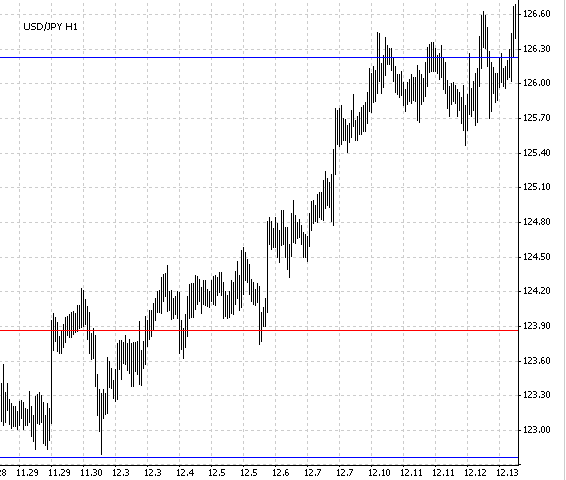
The stop order will be placed under the latest trough, about 15 pips below (to exclude the "stock noise"). Take Profit will be placed at a double distance. This means that the profit/loss ratio is 2/1. In our example, the trough is at 122.83. This is why we will place stop 15 pips lower - at 122.68. Take Profit will be placed at 123.86+2*(123.86-122.68)=126.22.
The result of our operation is shown in Fig. 4. Triggering of Take Profit brought us a profit of 236 pips, which in money terms makes USD1870 on Forex (USD187 - on mini Forex).

Notes about the Trade.
Making such a trade breaks the recommended money-management rules since heady dynamics on the blue bar (Fig. 3) resulted in that the stop order had to be placed at a large distance from the entering point. Moreover, there was an attempt to jump into the market immediately after a rash movement, an attempt to "catch the leaving train". All this resulted in uneasy hours of watching how the price was approaching to the stop level. This trade should be skipped according to the money-management rules.
This tactics can be used on smaller periods, too, but it is necessary to remember that the smaller the timeframe is the less foreseeable it is due to market noise.
Translated from Russian by MetaQuotes Ltd.
Original article: https://www.mql5.com/ru/articles/1428
 Graphic Expert Advisor: AutoGraf
 Secrets of MetaTrader 4 Client Terminal: File Library in MetaEditor
 Beginners' Mistakes when Working with MetaTrader 4 Client Terminal
 Orders Management - It's Simple
- Free trading apps
- Over 8,000 signals for copying
- Economic news for exploring financial markets
You agree to website policy and terms of use