Expert Advisor for Trading in the Channel
Genkov | 5 September, 2013
Introduction
I would like to share my experience with novice traders who know the MQL4 basics and I am going to introduce a program that can be helpful when trading in the channel. Before you start trading in the channel, you should have a clear understanding of the channel's underlying principles and how the channel size and direction change depending on the price movement. Each channel line is plotted based on fully formed fractals within the range of visible bars in the chart.
Semi-automatic Expert Advisor for Trading in the Channel
I will leave out the standard program start here. You can find it in the files attached.
First, let's decide on the number of bars for fractal search by periods. Here, we will also set the space value for arrows to be displayed in the chart.
switch (Period())
{
case 1:     B_F=12; space=0.0002; break;
case 5:     B_F=48; space=0.0003; break;
case 15:    B_F=24; space=0.0004; break;
case 30:    B_F=24; space=0.0004; break;
case 60:    B_F=12; space=0.0007; break;
case 240:   B_F=15; space=0.0012; break;
case 1440:  B_F=10; space=0.0030; break;
case 10080: B_F=6;  space=0.0040; break;
}
We start creating the channel by searching for datum points (bars) through which channel lines will be drawn. For upper or lower identified points, we will introduce the following conditions at the level of global variables:
- Extrem = (0) - fractal not found,
- Extrem = (1) - upper fractal found, // any positive number
- Extrem = (-1) - lower fractal found // any negative number
Let's set the initial indeterminacy values for datum points and their positions in the chart as follows:
NB1=-1; NB2=-1; Extrem=0;
Testing will start from the third bar (counted as "0") in view of the possible "fractal formation".
TestBar=2; // number of the bar being tested
To identify the cases where the tested bar matches the maximum or the minimum value lying within the above defined ranges, we will add a 'while' loop. The loop condition will be an expression with negative values of bar numbers. In addition, the number of the bar being tested will have to be smaller than the total number of tested bars.
while(((NB1==-1) || (NB2==-1)) && (TestBar<AllB))
Let's first assume that the points of extremum lie low and test the bars to see if they match with the minimum values. If two points are found, the loop conditions will become false and the execution of the operator will be terminated.
Below is the snippet of the 'while' loop for identifying lower chart points. The search for higher datum points is implemented in the similar manner.
//start counting from the third bar (counted as "0") to be able to "identify the fractal"
TestBar=2;  // number of the bar being tested
NB1=-1; NB2=-1; Extrem=0;   // assume that the numbers of bars and the extremum are not determined
while(((NB1==-1) || (NB2==-1)) && (TestBar<AllB))
  {//w1
// -------------------------------------------------------------------------------------+
//  If: - the Extrem value is smaller than (1)(two possible options are: "0" and "-1"),
//  and the index of the smallest price value coincides with the index of bar under consideration
// -------------------------------------------------------------------------------------+
   if((Extrem<1) && (TestBar==iLowest(Symbol(),Period(),MODE_LOW,B_F*2+1,TestBar-B_F)))
     {//w2
      // if "0" when there was no extremum at that moment,
      if(Extrem==0)
        {//w3
         // assign: the value of (-1) to the identified point of extremum, thus indicating
         // that this is the lower extremum; the number to the determined bar (NB1) and the price value (Pr1).
         Extrem=-1; NB1=TestBar; Pr1=Low[NB1];
        }//-w3
      else  if(Extrem!=0) // the first point was found earlier
                          // otherwise the number and the price value will be assigned to point 2
        {//w4
         NB2=TestBar; Pr2=Low[NB2];
        }//-w4
      // for control purposes, the values can be printed - Print("   bar #= ",NB2," price value= ",Pr2);
     }//-w2
// -------------------------------------------------------------------------------------+
If only one point is found, the loop conditions will remain true and the operator will proceed to higher extrema. If 2 higher points cannot be found, it will mean that there are currently no points to create a channel.
if((NB1==-1) || (NB2==-1)) // no datum points are found on the last AllB bars
With two datum points available, we calculate the rate of price change:
RatePr=(Pr2-Pr1)/(NB2-NB1);
We then find the first reference point of the channel line as a projection of the first datum point on the "0" bar:
double Tk1=Pr1-NB1*RatePr;
The second reference point of the channel line is identified within the visual range in the left side of the chart, e.g. 50 bars to the left from the second datum point.
double Tk2=Tk1+(NB2+50)*RatePr;
Let's now plot the opposite channel line parallel to the determined line:
To find the third datum point, we will test bars lying between the other two datum points from NB1 to NB2 (or from "0" to NB2, and from the second bar to NB2). Testing will be done based on extrema that are lying in the direction opposite to the points found. For example, if the points we have determined are higher chart points, the bars will be tested based on Lows. After finding the third datum point, the other two reference points for the opposite channel line are determined in the same section.
The snippet below is provided with detailed comments.
// Plot the opposite channel line parallel to the determined line.
// Find the datum point for the opposite channel line:
// Take the minimum price of the 2nd bar as the origin of search.
Tk3=Low[2]-2*RatePr; // projection of the 2nd bar on the "0" bar
for(i=3;i<=NB2;i++) // start searching from the 3rd bar
  {//2(1)Up
   if(Low[i]<Tk3+i*RatePr) // using the minimum value of the price projection on the "0" bar
     {//3(1)Up
      Tk3=Low[i]-i*RatePr; // third reference point (projection on the "0" bar)
      Pr5=Low[i];          // the third datum point for the lower channel line
      NB5=i;               // number of the bar of the third datum point
     }//-3(1)Up
  }//-2(1)Up
After the third datum point has been found, you can draw these points in the chart, having deleted the existing ones beforehand.
The snippet of the program for drawing datum points in the chart is provided below.
ObjectDelete("Rep1"); ObjectDelete("Rep2"); ObjectDelete("Rep3"); ObjectDelete("Rep5");
   ObjectCreate("Rep1",OBJ_ARROW, 0, TmR1, Pr1+2*space);
      ObjectSet("Rep1", OBJPROP_COLOR, Yellow);
      ObjectSet("Rep1", OBJPROP_ARROWCODE,72);
   ObjectCreate("Rep2",OBJ_ARROW, 0, TmR2, Pr2+2*space);
      ObjectSet("Rep2", OBJPROP_COLOR, Yellow);
      ObjectSet("Rep2", OBJPROP_ARROWCODE,72);
   ObjectCreate("Rep5",OBJ_ARROW, 0, TmR5, Pr5-space);
      ObjectSet("Rep5", OBJPROP_COLOR, Yellow);
      ObjectSet("Rep5", OBJPROP_ARROWCODE,71);
  ObjectDelete("Cross2");
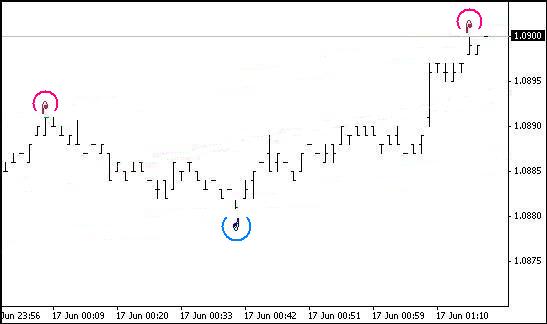
As a result, you should be able to see marks above/below the datum points in the chart (please see below).
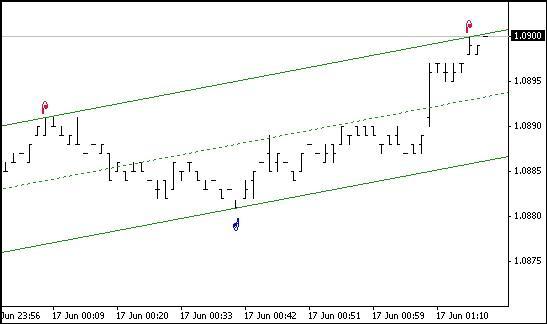
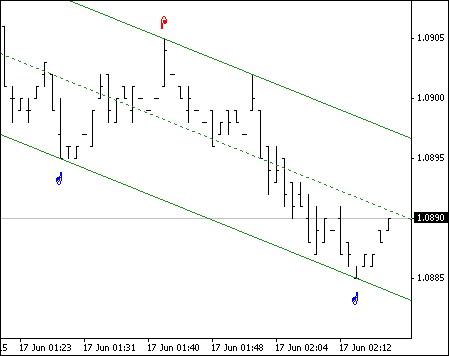
After determining three datum points and four reference points the lines can be plotted in the chart:
DelObj1();
ObjectCreate("Tr1",OBJ_TREND,0,Tm2,Tk2,Tm1,Tk1);
  ObjectSet("Tr1",OBJPROP_COLOR,Lime);
  ObjectSet("Tr1",OBJPROP_WIDTH,1); //2
  ObjectSet("Tr1",OBJPROP_STYLE,STYLE_SOLID);
ObjectCreate("Tr2",OBJ_TREND,0,Tm2,Tk4,Tm1,Tk3);
  ObjectSet("Tr2",OBJPROP_COLOR,Lime);
  ObjectSet("Tr2",OBJPROP_WIDTH,1); //2
  ObjectSet("Tr2",OBJPROP_STYLE,STYLE_SOLID);
ObjectCreate("Med",OBJ_TREND,0,Tm2,(Tk2+Tk4)/2,Tm1,(Tk1+Tk3)/2);
  ObjectSet("Med",OBJPROP_COLOR,Lime);
  ObjectSet("Med",OBJPROP_WIDTH,1);
  ObjectSet("Med",OBJPROP_STYLE,STYLE_DOT);
Let's calculate the median values of the channel and channel boundaries on the last 6 bars:
for(int i=0;i<6;i++)
  {
   TLUp_[i]=Tk1+i*RatePr;
   TLDn_[i]=Tk3+i*RatePr;
   Med_[i]=(TLUp_[i]+TLDn_[i])/2;
  }
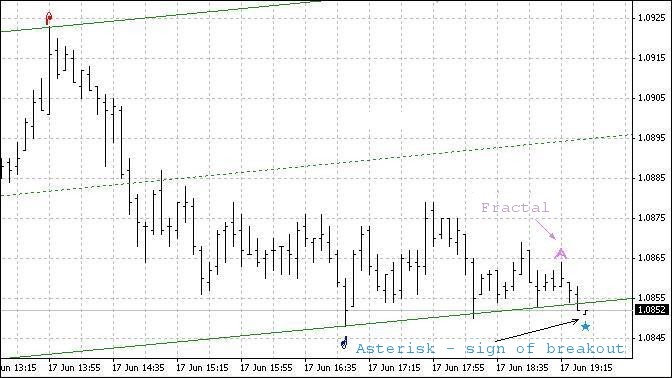
If the price has crossed the channel line, mark it with an asterisk and add a sound notification:
if(Bid>TLUp_[0])
  {
   bool TrUp=true; //bool TrDn=false;
   ObjectDelete("Cross1");  ObjectDelete("Cross2");
   ObjectCreate("Cross1",OBJ_ARROW,0,Tm1,High[1]+2*space);
   ObjectSet("Cross1",OBJPROP_COLOR,DeepPink);
   ObjectSet("Cross1",OBJPROP_ARROWCODE,171);
   PlaySound("alert.wav"); // The file must be located under terminal_directory\sounds
  }
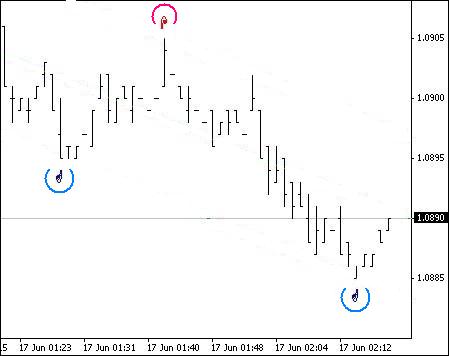
If there is a fully formed fractal on the last bars, mark it in the chart:
ObjectDelete("Fraktal"+(q-1));  //ObjectDelete("Frakt"+(w-1));
ObjectCreate("Fraktal"+q,OBJ_ARROW, 0, Time[2], High[2]+2*space+0.0002);
ObjectSet   ("Fraktal"+q, OBJPROP_COLOR, Orchid);
ObjectSet   ("Fraktal"+q, OBJPROP_ARROWCODE,217);
We have just considered certain peculiarities and program snippets related to creating the channel per se.
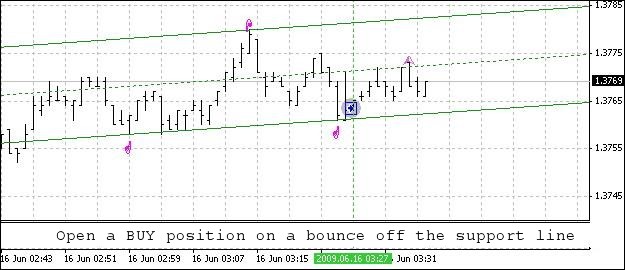
Let's now say a few words about the possibility of trading in this channel.
Assume, the channel is directed upwards and the current candlestick moved down close to or crossed the lower boundary of the channel. In this event, the possible price behavior can be as follows:
- the price will turn upwards before reaching the lower boundary;
- the price will reach the lower boundary and turn upwards;
- the price will cross the channel line and then turn upwards;
- having crossed the lower boundary, the price will continue moving down (downward breakout).
It should be noted here that we mean the minimum bar value when speaking of crossing the lower boundary by the bar.
On the face of it, the first three price movement patterns are suitable for opening a BUY position. Let's have a look at them. We should bear in mind that the channel in this Expert Advisor is created based on fully formed fractals. Therefore, there is a possibility that the channel may change its direction after the fractal has been fixed, i.e. on the last three bars and we need to take it into consideration.
Let's review the first pattern. Here, the bar following the bar that has the minimum value will be opened higher than the minimum value of the previous bar. And the minimum value of the third (counted from left to right) bar will also be higher than the minimum value of the first bar. So, bar 3 (counted from right to left, i.e. from the 0 bar) is the minimum value for the fractal formation. And if the upward direction of the channel has not changed, we can open a BUY position.
Now a few words regarding the change in the direction of the channel. If the channel has been plotted based on lower datum points, the channel direction will not change because the minimum fractal point will be above the lower channel line.
If the channel has been plotted based on higher datum points, the channel direction will remain the same. The question arising out of the first pattern is what amount of difference between the lower channel boundary and the minimum value of the fractal formed next to that boundary can be considered sufficient. This amount primarily depends on the size of the channel.
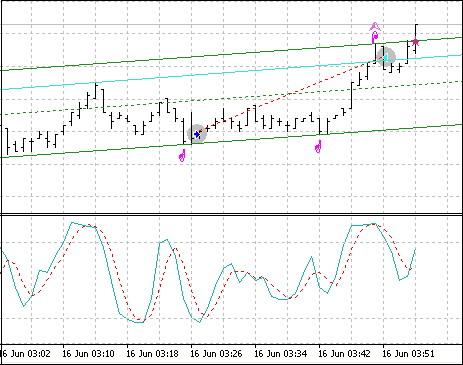
The third price movement pattern as a rule leads to the change in the slope of the channel and sometimes even results in the change of the channel direction as the fractal is formed below the lower channel boundary. If the channel was created based on minimum values of the first two datum points while the value of the formed fractal turned out to be lower than the first reference point and higher than the second reference point, the channel slope will be adjusted and the direction will remain upward.
Should the minimum bar value of the formed fractal be also lower than the second reference point, the channel direction will become downward. The same is true for SELL positions, only in the opposite way. Below are the examples of trading using the proposed Expert Advisor.
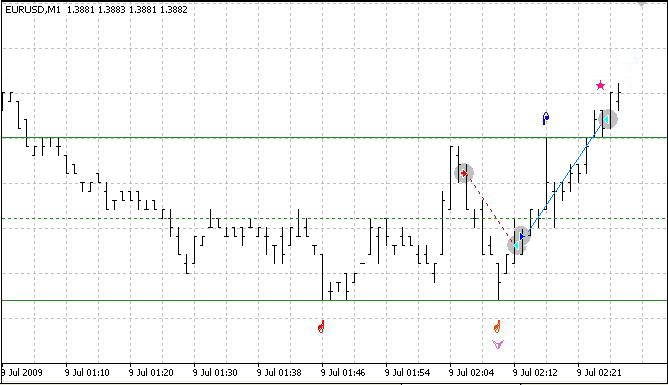
In the order opening and position tracking blocks, you can find an example of position opening and closing conditions tested in the demo mode. Testing result:
The full program code is provided below:
//+------------------------------------------------------------------+
//|                                             Expert_Ch_v83_2_.mq4 |
//|                                            2009, author - Genkov |
//|                                                     Genkov@bk.ru |
//+------------------------------------------------------------------+
#property copyright "2009, author - Genkov"
#property link      "Genkov@bk.ru"
//+------------------------------------------------------------------+
extern double SL_B=200;
extern double TP_B=50;
extern double SL_S=200;
extern double TP_S=50;
extern double Lots=1.0;
double TrailingStop=40;
int Magic,i;
extern int AllB=240;        // number of bars for calculations
int TestBar=0;              // index of the bar being tested
double RatePr=0;            // rate of price change - pips/bars
int NB1=-1,NB2=-1,NB3,NB5;  // numbers of bars of datum points
int Extrem=0;               // indices of the points of extremum:
/* Extrem = (0)  - fractal not found,
     Extrem = (1)  - upper fractal found, (any positive number)
     Extrem = (-1) - lower fractal found   (any negative number)
  */
double Pr1=0,Pr2=0,Pr3,Pr5,// prices of datum bars with fractals
Tk1,Tk2,Tk3,Tk4,Tk5; // prices of reference points for plotting the channel lines
double space;               // distance from the price to the "arrow"
double TLUp_[10],TLDn_[10],// values of channel boundaries
Med_[10];
int B_F=0;                  // number of bars for fractals in a period
datetime Tm1,Tm2,Tm3,Tm5;   // time of bars of reference points
string SH;                  // channel slope
bool FraktUp=false;         // flag of the upper fractal mark
bool FraktDn=false;         // flag of the lower fractal mark
int q,w;
//+------------------------------------------------------------------+

//+------------------------------------------------------------------+
void DelObj1()
  {
   ObjectDelete("Tr1");
   ObjectDelete("Tr2");
   ObjectDelete("Med");
  }
//+------------------------------------------------------------------+
void Op_Sell_Ch()
  {
   if(!OrderSend(Symbol(),OP_SELL,Lots,Bid,2,Ask+SL_S*Point,Bid-TP_S*Point," ",Magic,0,Red))
     { Print("  Error when opening a SELL order  # ",GetLastError()); }
   return(0);
  }
//+------------------------------------------------------------------+
void Op_Buy_Ch()
  {
   if(!OrderSend(Symbol(),OP_BUY,Lots,Ask,2,Bid-SL_B*Point,Ask+TP_B*Point," ",Magic,0,Blue))
     { Print("  Error when opening a SELL order  # ",GetLastError()); }
   return(0);
  }
//+------------------------------------------------------------------+
void Close_B_lot()
  {
   if(!OrderClose(OrderTicket(),OrderLots(),Bid,2,HotPink)) // closing 0.1 lot
     {
      Print(" Closed order #= ",OrderTicket(),"Error #= ",GetLastError());
      RefreshRates();
     }
  }
//+------------------------------------------------------------------+
void Close_S_lot()
  {
   if(!OrderClose(OrderTicket(),OrderLots(),Ask,2,Aqua)) // closing 0.1 lot
     {
      Print(" Closed order #= ",OrderTicket(),"Error #= ",GetLastError());
      RefreshRates();
     }
  }
// ===================================================================+
int start()
  {
   int StopLevel=MarketInfo(Symbol(),MODE_STOPLEVEL);
// number of bars for fractal search by periods
   switch(Period())
     {
      case 1:     B_F=12; space=0.0002; break;
      case 5:     B_F=48; space=0.0003; break;
      case 15:    B_F=24; space=0.0004; break;
      case 30:    B_F=24; space=0.0004; break;
      case 60:    B_F=12; space=0.0007; break;
      case 240:   B_F=15; space=0.0012; break;
      case 1440:  B_F=10; space=0.0030; break;
      case 10080: B_F=6;  space=0.0040; break;
     }
// ====================================================================================+
// create a channel:
//start counting from the third bar (counted as "0") to be able to "identify the fractal"
   TestBar=2;  // number of the bar being tested
   NB1=-1; NB2=-1; Extrem=0;   // assume that the numbers of bars and the extremum are not determined
   while(((NB1==-1) || (NB2==-1)) && (TestBar<AllB))
     {//w1
      // -------------------------------------------------------------------------------+
      //  If: - the Extrem value is smaller than (1)(two possible options are: "0" and "-1"),
      //  and the index of the smallest price value coincides with the index of bar under consideration
      // -------------------------------------------------------------------------------+
      if((Extrem<1) && (TestBar==iLowest(Symbol(),Period(),MODE_LOW,B_F*2+1,TestBar-B_F)))
        {//w2
         // if "0" when there was no extremum at that moment,
         if(Extrem==0)
           {//w3
            // assign: the value of (-1) to the identified point of extremum, thus indicating
            // that this is the lower extremum; the number to the determined bar (NB1) and the price value (Pr1).
            Extrem=-1; NB1=TestBar; Pr1=Low[NB1];
           }//-w3
         else  if(Extrem!=0) // the first point was found earlier
                             // otherwise the number and the price value will be assigned to point 2
           {//w4
            NB2=TestBar; Pr2=Low[NB2];
           }//-w4
         // for control purposes, the values can be printed - Print("   bar #= ",NB2," price value= ",Pr2);
        }//-w2
      // -------------------------------------------------------------------------------+
      //  If: - the Extrem value is greater than (-1)(possible options are: 0 and 1), and the index of the highest price
      //  value coincides with the number of the bar under consideration - (similar to the above)
      // -------------------------------------------------------------------------------+
      if((Extrem>-1) && (TestBar==iHighest(Symbol(),Period(),MODE_HIGH,B_F*2+1,TestBar-B_F)))
        {//w5
         // if Extrem==0
         if(Extrem==0)
           {//w6
            // store the bar number (NB1) and the price value (Pr1).
            Extrem=1; NB1=TestBar; Pr1=High[NB1];
           }//-w6
         else // otherwise the number and the price value will be assigned to point 2
           {//w7
            NB2=TestBar; Pr2=High[NB2];
           }//-w7
        }//-w5
      TestBar++;
     }//-w1
// -----------------------------------------------------------------------------------+
   if((NB1==-1) || (NB2==-1)) // no datum points found on the last AllB bars
     {
      DelObj1(); ObjectDelete("Cross1"); ObjectDelete("Cross2");  ObjectDelete("Rep1");
      ObjectDelete("Rep2"); ObjectDelete("Rep3"); ObjectDelete("Rep5");
      // Print(" === > no bars for the channel "); // for control purposes only (can be deleted)
      return(-1);
     }
// ---------------------------------
// Calculate the rate of price change.
   RatePr=(Pr2-Pr1)/(NB2-NB1);
// if the value is positive, we are dealing with a downward channel, otherwise - upward.
   if(RatePr>0) SH="downward"; else  SH="upward";
// determine the time of datum points for the channel lines
   Tm1=Time[0];    Tm2=Time[NB2+50];
// **************************************************************************************
   if(Extrem==1) // if a higher extremum has been found first
     {//1(Extrem=1)
      // with two datum points and the rate of price change available,
      // determine reference points of this line:
      // the first reference point is the projection of the datum point on the "0" bar
      double Tk1=Pr1-NB1*RatePr;
      // the second reference point is the projection on the left-hand side of the chart
      double Tk2=Tk1+(NB2+50)*RatePr;
      // Plot the opposite channel line parallel to the determined line.
      // Find the datum point for the opposite channel line:
      // Take the minimum price of the 2nd bar as the origin of search.
      Tk3=Low[2]-2*RatePr; // projection of the 2nd bar on the "0" bar
      for(i=3;i<=NB2;i++) // start searching from the 3rd bar
        {//2(1)Up
         if(Low[i]<Tk3+i*RatePr) // using the minimum value of the price projection on the "0" bar
           {//3(1)Up
            Tk3=Low[i]-i*RatePr; // third reference point (projection on the "0" bar)
            Pr5=Low[i];          // the third datum point for the lower channel line
            NB5=i;               // number of the bar of the third datum point
           }//-3(1)Up
        }//-2(1)Up
      // now take a look at the first two bars: "0" and "1"; their Min values may turn out to be lower than the 2nd bar
      // if we consider adjustment of the channel using these two bars, the channel will be
      // becoming wider following the downward price movement; if this is ignored, the downward price movement
      // can be considered as the channel line breakout (possible beginning of the trend!)
      // if(Low[0]<Tk3) {Tk3=Low[0]; Pr5=Low[0]; NB5=0;}
      // if(Low[1]<Tk3+RatePr) {Tk3=Tk3+RatePr; Pr5=Low[1]; NB5=1;}
      datetime TmR1=Time[NB1];    datetime TmR2=Time[NB2];   datetime TmR5=Time[NB5];
      // -------------------------------------------------------------------------------------
      // the following operators are intended for visual control of the program performance only (they can be deleted)
      // and display the channel slope value, speed rate, numbers and time of the datum points at Extrem=1
      string TNB1=TimeToStr(TmR1,TIME_DATE|TIME_MINUTES);
      string TNB2=TimeToStr(TmR2,TIME_DATE|TIME_MINUTES);
      string TNB5=TimeToStr(TmR5,TIME_DATE|TIME_MINUTES);
      //   Print(" channel- ",SH," ; speed = ",DoubleToStr(NormalizeDouble(RatePr,8),8),
      //         " pip / bar"," ; Extrem= ",Extrem);
      //   Print(" NB2= ",NB2," ; time= ",TNB2," ; NB5= ",NB5,
      //         " ; time= ",TNB5," ; NB1= ",NB1," ; time= ",TNB1);
      // --------------------------------------------------------------------------------------
      // for clarity of the program performance, mark the datum points on the channel lines in the chart
      ObjectDelete("Rep1"); ObjectDelete("Rep2"); ObjectDelete("Rep3"); ObjectDelete("Rep5");
      ObjectCreate("Rep1",OBJ_ARROW,0,TmR1,Pr1+2*space);
      ObjectSet("Rep1",OBJPROP_COLOR,Yellow);
      ObjectSet("Rep1",OBJPROP_ARROWCODE,72);
      ObjectCreate("Rep2",OBJ_ARROW,0,TmR2,Pr2+2*space);
      ObjectSet("Rep2",OBJPROP_COLOR,Yellow);
      ObjectSet("Rep2",OBJPROP_ARROWCODE,72);
      ObjectCreate("Rep5",OBJ_ARROW,0,TmR5,Pr5-space);
      ObjectSet("Rep5",OBJPROP_COLOR,Yellow);
      ObjectSet("Rep5",OBJPROP_ARROWCODE,71);
      ObjectDelete("Cross2");
      // -------------------------------------------------------------------------------------
      // calculate prices for coordinates of reference points on the lower channel boundary:
      double Tk3=Pr5-RatePr*NB5; // price of the lower channel boundary in the "0" point
      double Tk4=Tk3+RatePr*(NB2+50);// price of the lower channel boundary in the left-hand side of the chart
     }//- 1(Extrem=1)
// ******************************************************************************************
   else  if(Extrem==-1)// if a lower extremum has been found first
     {//1(Extrem= -1)
                                     // prices of reference points on the lower channel boundary:
      Tk3=Pr1-NB1*RatePr;      // in the "0" point
      Tk4=Tk3+(NB2+50)*RatePr; // in the left-hand side point
                               // Plot the opposite channel line parallel to the determined line.
      // Find the datum point for the opposite channel line.
      // Take the price of the 2nd bar as the origin of search.
      Tk1=High[2]-2*RatePr; // projection of the 2nd bar on the "0" bar
      for(i=3;i<=NB2;i++) // start searching from the 3rd bar
        {//2(-1)
         if(High[i]>Tk1+i*RatePr)
           {//3(-1)
            Tk1=High[i]-i*RatePr; // the third reference point (projection on the "0" bar)
            Pr3=High[i];          // the third datum point for the upper channel line
            NB3=i;                // number of the bar of the third datum point
           }//-3(-1)
         // now take a look at the first two bars: "0" and "1"
         // if(High[0]>Tk1) {Tk1=High[0]; Pr3=High[0]; NB3=0;}
         // if(High[1]>Tk1+RatePr) {Tk1=Tk1+RatePr; Pr3=High[1]; NB3=1;}
         TmR1=Time[NB1];    TmR2=Time[NB2];   datetime TmR3=Time[NB3];
        }//- 2(-1)
      // ---------------------------------------------------------------------------------
      // add the following operators to monitor the performance results
      //(they do not affect the program performance and can be deleted),
      // they display the channel (speed) slope value, speed rate, as well as numbers
      // and time of the datum points at Extrem = -1
      // TNB1=TimeToStr(TmR1,TIME_DATE|TIME_MINUTES);
      // TNB2=TimeToStr(TmR2,TIME_DATE|TIME_MINUTES);
      // string TNB3=TimeToStr(TmR3,TIME_DATE|TIME_MINUTES);
      // Print(" channel- ",SH," ; price speed rate= ",DoubleToStr(NormalizeDouble(RatePr,8),8),
      //       " pip / bar"," ; Extrem= ",Extrem);
      // Print(" ; NB2= ",NB2," ; time= ",TNB2," ; NB3= ",NB3,
      //       " ; time= ",TNB3," ; NB1= ",NB1," ; time= ",TNB1);
      // ----------------------------------------------------------------------------------
      // for clarity, mark the datum points on the channel lines in the chart
      ObjectDelete("Rep1"); ObjectDelete("Rep2");
      ObjectDelete("Rep3"); ObjectDelete("Rep5");
      ObjectCreate("Rep1",OBJ_ARROW,0,TmR1,Pr1-space);
      ObjectSet("Rep1",OBJPROP_COLOR,Yellow);
      ObjectSet("Rep1",OBJPROP_ARROWCODE,71);
      ObjectCreate("Rep2",OBJ_ARROW,0,TmR2,Pr2-space);
      ObjectSet("Rep2",OBJPROP_COLOR,Yellow);
      ObjectSet("Rep2",OBJPROP_ARROWCODE,71);
      ObjectCreate("Rep3",OBJ_ARROW,0,TmR3,Pr3+2*space);
      ObjectSet("Rep3",OBJPROP_COLOR,Yellow);
      ObjectSet("Rep3",OBJPROP_ARROWCODE,72);
      ObjectDelete("Cross1");
      // ---------------------------------------------------------------------------------
      // calculate prices of the reference points on the upper channel boundary:
      Tk1=Pr3-RatePr*NB3; // price of the upper channel boundary in the "0" point
      Tk2=Tk1+RatePr*(NB2+50);// price of the upper channel boundary in the left-hand side point
     }//-1(Extrem= -1)
// ---------------------------------======================================================
// calculate the median values of the channel and channel boundaries on the last 6 bars
   for(int i=0;i<6;i++)
     {
      TLUp_[i]=Tk1+i*RatePr;
      TLDn_[i]=Tk3+i*RatePr;
      Med_[i]=(TLUp_[i]+TLDn_[i])/2;
     }
// --------------------------------------------------------------------
//If the price has crossed the upper channel line, mark it with an asterisk and add a sound notification
   if(Bid>TLUp_[0])
     {
      bool TrUp=true; //bool TrDn=false;
      ObjectDelete("Cross1");  ObjectDelete("Cross2");
      ObjectCreate("Cross1",OBJ_ARROW,0,Tm1,High[1]+2*space);
      ObjectSet("Cross1",OBJPROP_COLOR,DeepPink);
      ObjectSet("Cross1",OBJPROP_ARROWCODE,171);
      PlaySound("alert.wav"); // The file must be located under terminal_directory\sounds
     }
//If the price has crossed the lower channel line, mark it with an asterisk and add a sound notification
   if(Bid<TLDn_[0])
     {
      ObjectDelete("Cross2");  ObjectDelete("Cross1");
      /// Print(" there was a crossover of the lower channel line ");
      ObjectCreate("Cross2",OBJ_ARROW,0,Tm1,Low[1]-space);
      ObjectSet("Cross2",OBJPROP_COLOR,DodgerBlue);
      ObjectSet("Cross2",OBJPROP_ARROWCODE,171);
      PlaySound("alert.wav"); // The file must be located under terminal_directory\sounds
     }
// -------------------------------------------------------------------------------------
// plot the channel boundaries in the chart, having deleted the existing ones beforehand
   DelObj1();
   ObjectCreate("Tr1",OBJ_TREND,0,Tm2,Tk2,Tm1,Tk1);
   ObjectSet("Tr1",OBJPROP_COLOR,Lime);
   ObjectSet("Tr1",OBJPROP_WIDTH,1); //2
   ObjectSet("Tr1",OBJPROP_STYLE,STYLE_SOLID);
   ObjectCreate("Tr2",OBJ_TREND,0,Tm2,Tk4,Tm1,Tk3);
   ObjectSet("Tr2",OBJPROP_COLOR,Lime);
   ObjectSet("Tr2",OBJPROP_WIDTH,1); //2
   ObjectSet("Tr2",OBJPROP_STYLE,STYLE_SOLID);
   ObjectCreate("Med",OBJ_TREND,0,Tm2,(Tk2+Tk4)/2,Tm1,(Tk1+Tk3)/2);
   ObjectSet("Med",OBJPROP_COLOR,Lime);
   ObjectSet("Med",OBJPROP_WIDTH,1);
   ObjectSet("Med",OBJPROP_STYLE,STYLE_DOT);
// ---- Block of marking fractals in the chart ---------------------------------
   if((High[2]>High[1] && Bid<High[2] && High[2]>High[3] && High[2]>High[4]) ||
      (High[2]==High[1] && Bid<High[1] && High[2]>High[3] && High[2]>High[4]))
     {
      double FraktalUp=High[2]; // upper fractal
      double FraktalDn=0;
      // if the fractal has formed, put a mark, and if this fractal caused
      // a new datum point - delete the mark for the crossover of the upper channel line by the price.
      if(High[2]>=TLUp_[i]) ObjectDelete("Cross1");
      ObjectDelete("Fraktal"+(q-1));  //ObjectDelete("Frakt"+(w-1));
      ObjectCreate("Fraktal"+q,OBJ_ARROW,0,Time[2],High[2]+2*space+0.0002);
      ObjectSet("Fraktal"+q,OBJPROP_COLOR,Orchid);
      ObjectSet("Fraktal"+q,OBJPROP_ARROWCODE,217);
      bool FraktUp=true; //bool FraktDn=false;// it will be useful when trading
      q++;
     }
   if((Low[2]<Low[1] && Bid>Low[2] && Low[2]<Low[3] && Low[2]<Low[4]) ||
      (Low[2]==Low[1] && Bid>Low[1] && Low[2]<Low[3] && Low[2]<Low[4]))
     {
      FraktalDn=Low[2]; // lower fractal
      FraktalUp=0;
      if(Low[2]>=TLUp_[i]) ObjectDelete("Cross2");
      ObjectDelete("Frakt"+(w-1)); //ObjectDelete("Fraktal"+(q-1));
      ObjectCreate("Frakt"+w,OBJ_ARROW,0,Time[2],Low[2]-2*space);
      ObjectSet("Frakt"+w,OBJPROP_COLOR,Orchid);
      ObjectSet("Frakt"+w,OBJPROP_ARROWCODE,218);
      FraktDn=true; FraktUp=false;
      w++;
     }
// ---------------------------------------------------------------+
// Block of position opening conditions.   This is just an example  +
// and it should not be deemed a recommendation for use!+
// ---------------------------------------------------------------+
   if(OrdersTotal()<1) // trade one position
     {
      // - 16- SELL ---
      if(Extrem==1 && // two upper datum points
         RatePr>0 && // channel directed downwards
         (Tk1-Tk3)>20*Point && // channel size > 20pip
         Bid<High[1] && // the price is lower than the previous bar
         (TLUp_[1]-High[1])<3*Point) // the first bar is within 3pip from the upper channel line
        {
         Print(" Open - 16-SELL === ");
         //   SL_S=50;
         //   if(SL_S<StopLevel) SL_S=StopLevel;
         //   TP_S=80;
         Op_Sell_Ch();
         return(0);
        }
      // - 18- BUY ---
      if(Extrem==-1 && // two lower datum points
         RatePr<0 && // channel directed upwards
         (Tk1-Tk3)>20*Point && // channel size > 20pip
         Bid>Low[1] && // the price is higher than the previous bar
         (Low[1]-TLDn_[1])<3*Point) // the 1st bar is within 3pip from the lower channel line
        {
         Print(" Open - 18-BUY === ");
         //    SL_B=50;
         //    if(SL_B<StopLevel) SL_B=StopLevel;
         //    TP_B=80;
         Op_Buy_Ch();
         return(0);
        }
     }
//------------------------------------------------------------------------+
// Tracking open SELL positions                                    |
//+=======================================================================+
   for(i=OrdersTotal()-1;i>=0;i--) // SELL order selection loop
     {//1-position selection loop
      if(!OrderSelect(i,SELECT_BY_POS,MODE_TRADES))
        {Print("Order selection error = ",GetLastError()); }
      if(OrderType()==OP_SELL) // if there is an open Sell order
        { //2-type_Sell
         if((FraktalDn<=TLDn_[2] ||
            Low[2]<=TLDn_[2]) &&
            (Bid>Low[1] && Low[1]<=TLDn_[1]) &&
            (OrderOpenPrice()-Bid)*Point>0) // not at a loss!
           {//5
            Print(" close by the lower channel line ");
            Close_S_lot();
            // and if the channel is directed upwards
            if(RatePr<0)
              {
               Print(" Open a Buy position ");
               Op_Buy_Ch();
              }
           }//-5
        }//-2 type_Sell
      //------------------------------------------------------------------------+
      // Tracking open BUY positions                   |
      //+=======================================================================+
      else
      if(OrderType()==OP_BUY) // if there is an open Buy order
        { //4-type_Buy
         if((FraktalUp>=TLUp_[2] ||
            High[2]>=TLUp_[2]) &&
            // If the channel is created based on the lower datum points and is directed upwards,
            // while the price has crossed the upper boundary,  and is about to move down,
            //bar "1" was higher than bar "0" and higher than bar "2" which was situated on the upper channel line,
            // this looks like the upper fractal formation and channel size increase.
            // At the same time, Stochastic is above 80.0
            // and it starts going down to cross the signal line.
            // So we should not expect bar "0" to get fully formed as it is highly likely
            // that the price will go down. Therefore close the BUY position.
            (Bid<High[1] && High[1]>=TLUp_[1]) &&
            (Ask-OrderOpenPrice())*Point>0) // not at a loss!
           {//5
            Print(" close by the upper channel line ");
            Close_B_lot();
            // and if the channel is directed downwards
            if(RatePr>0)
              {
               Print(" Open a Sell position ");
               Op_Sell_Ch();
              }
           }//-5
        }//-4-type_Buy
     }//-1 position selection loop
//----------------
   return(0);
  }
//+------------------------------------------------------------------+
Conclusion
I believe that the question regarding the possibility of trading in the channel should be answered in the affirmative. I am looking forward to any critical feedback to be able to further improve the Expert Advisor. And I am hopeful that my experience will be useful not only to novice traders.