How to Write an Indicator on the Basis of Another Indicator
Dmitry Fedoseev | 26 July, 2010
Introduction
In MQL5 besides creation a new custom indicator from a scratch as described in the "MQL5: Create Your Own Indicator" article, you can write one on the basis of another indicator, in-built in the client terminal or a custom one. There are two ways: first is to improve an indicator, add new calculations and plots (this variant applies only to the custom indicators that have open source code), second way is to use an indicator in-built in the terminal or to use an existing custom indicator via the iCustom() or IndicatorCreate() functions.
First Way. Adding a Plot
Let's consider this way of creation of an indicator in details on the example of improving the True_Strength_Index_ver3 indicator from the "Applying One Indicator to Another" article. Let's add a signal line with a possibility of choosing type and period of smoothing to the indicator. The whole process consists of 8 stages.
1. Making a Copy of File
Open the True_Strength_Index_ver3 indicator in MetaEditor and save it under a new name, for example, TSIs. The new file must be saved in the MQL5/Indicators directory of the terminal root folder.
2. Changing Properties of Indicator
Search the indicator_buffers and indicator_plots properties in the code of the indicator. The indicator_buffers property determines the total number of indicator buffers used in the indicator, the indicator_plots property - number of buffers displayed on a chart. Currently eight buffers are used in the indicator; one of them is displayed on a chart. We need to add another buffer that should be displayed on a chart. Increase the indicator_buffers and indicator_plots values by one.
#property indicator_buffers 8
#property indicator_plots 2
3. Determining Properties of Displaying of New Buffer
Set properties of displaying of the new buffer. Use the already prepared code from this indicator. Using mouse, copy all the code that determines the properties of displaying of the first line of the indicator.
//---- plot TSI
#property indicator_label1 "TSI"
#property indicator_type1 DRAW_LINE
#property indicator_color1 Blue
#property indicator_style1 STYLE_SOLID
#property indicator_width1 1
Insert it below the properties of the first line and modify it.
//---- plot TSI Signal
#property indicator_label2 "TSISignal" // Line name that is displayed in a pop up help when the mouse cursor is put over the line
#property indicator_type2 DRAW_LINE    // Type of buffer
#property indicator_color2 Red         // Color of the line
#property indicator_style2 STYLE_SOLID // Style
#property indicator_width2 1           // Thickness of the line
First of all, change the number of properties from 1 to 2 because it's the property for the second buffer. Change the indicator_label2 property to TSISignal - it is the name of the line that is shown in a pop up help when the mouse cursor is put over the line as well as the one displayed in the data window. The indicator_type2 property should be left without changes, the buffer should be displayed as a line. Change the indicator_color2 property to Red - new line will have the red color. The indicator_style2 property remains the same - the signal line is solid like the main one. The indicator_width2 property should be also remained the same - the new line will have 1 pixel thickness.
4. Declaring External Variables
The external variables that can be changed through the indicator (lines that start with the "input" word) are located below the properties of lines in the code. The signal line should also have its parameters - period and type of smoothing.
Declare an external variable of the int type with value 5 and name it "sp" (smoothing period), and a variable with the ENUM_MA_METHOD type named "sm" (smoothing method) that has value MODE_EMA (the signal line will have the smoothing period 5 and the exponential type of smoothing on default). Now section of the code that contains the external variables looks as following:
input int r=25;
input int s=13;
input int sp=5;
input ENUM_MA_METHOD sm=MODE_EMA;
5. Declaring an Array for a New Buffer
Let's declare an array that will be used by the indicator buffer. Search for the OnInit() function in the code and find where the calls of the SetIndexBuffer() function are located it to guide yourself through already existing arrays of indicator buffers in the indicator. In the True_Strength_Index_ver3 indicator those arrays are TSIBuffer, MTMBuffer, AbsMTMBuffer, EMA_MTMBuffer, EMA2_MTMBuffer, EMA_AbsMTMBuffer, EMA2_AbsMTMBuffer.
The SetIndexBuffer() function of the TSIBuffer array is called with the INDICATOR_DATA parameter, it means that the buffer is displayed on a chart. All the other arrays are called with the INDICATOR_CALCULATIONS parameter. It means that the arrays are auxiliary and are used for intermediate calculations.
New buffer should be displayed on a chart, so let's declare it after the declaration of the TSIBuffer array to keep the logic order and for easier orientation in the code in case of further improvement of the indicator.
Thus, firstly we declare two arrays for buffers that are displayed on a chart, then arrays for buffers that are used for intermediate calculations.
//--- indicator buffers
double TSIBuffer[];
double TSISigBuffer[]; // Array for new buffer of the signal line
double MTMBuffer[];
double AbsMTMBuffer[];
double EMA_MTMBuffer[];
double EMA2_MTMBuffer[];
double EMA_AbsMTMBuffer[];
double EMA2_AbsMTMBuffer[];
6. Associating an Array with a Buffer
Now is a pretty important step that requires a higher attention and care - association of an array with an indicator buffer. Association is performed using the SetIndexBuffer() function. First parameter in the function call is the array index; second one is the array name; third one - identifier that indicates the purpose of the buffer. Buffers are located in the "Colors" tab of the indicator properties window according to the index (the first parameter), in the same order they are drawn on a chart, first is the 0 buffer, then buffer 1 over it, etc.
It is not necessary for the SetIndexBuffer() function to be called sequentially for the buffers with indexes 0, 1, 2..., nevertheless, let's keep the order of calls of theSetIndexBuffer() functions. Execute the call of the TSISigBuffer array after calling the function for the TSIBuffer array. Buffer of the main line (the array TSIBuffer) has index 0, it means that the next buffer (the TSISigBuffer array) should have index 1.
Third parameter of calling the SetIndexBuffer() function for the TSISigBuffer array is the INDICATOR_DATA constant (the buffer is displayed on a chart).
SetIndexBuffer(0,TSIBuffer,INDICATOR_DATA);
SetIndexBuffer(1,TSISigBuffer,INDICATOR_DATA);
Re-index the rest of buffers for the SetIndexBuffer() function to be called with a sequentially increased value of the first parameter.
SetIndexBuffer(0,TSIBuffer,INDICATOR_DATA);
SetIndexBuffer(1,TSISigBuffer,INDICATOR_DATA);
SetIndexBuffer(2,MTMBuffer,INDICATOR_CALCULATIONS);
SetIndexBuffer(3,AbsMTMBuffer,INDICATOR_CALCULATIONS);
SetIndexBuffer(4,EMA_MTMBuffer,INDICATOR_CALCULATIONS);
SetIndexBuffer(5,EMA2_MTMBuffer,INDICATOR_CALCULATIONS);
SetIndexBuffer(6,EMA_AbsMTMBuffer,INDICATOR_CALCULATIONS);
SetIndexBuffer(7,EMA2_AbsMTMBuffer,INDICATOR_CALCULATIONS);
For this specific situation it is recommended to keep the sequence of calling the SetIndexBufer() function in accordance with the increasing indexes. Thus, in case of further improvements it will take less attention and labor.
Now we have eight buffers, two of them are displayed on a chart. Make sure that the same values are specified in the properties of the indicator_buffers and indicator_plots indicators (step 2).
7. Calculating Values of the Signal Line
The signal line represents a moving average drawn on the data of the main line of the indicator. We don't need to make any calculations for it; the client terminal delivery includes a library for the calculation of moving averages on an array of information (file MovingAverages.mqh). By the way, it is already included in the indicator code (line 14):
#include <MovingAverages.mqh>The only thing left to do is to use its features.
In the OnCalculate() function find a point where the calculations of the main line of the indicator are finished (the TSIBuffer array). Let's use the search function; select the name of the TSIBuffer array, for example, in the part of the code where it is declared (fig. 1). Then execute the "Main Menu" - "Edit" - "Find and replace" - "Find" command or use the Ctrl+F key combination.
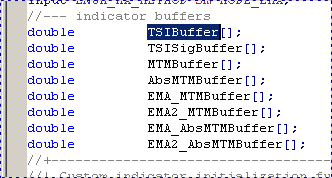
Fig. 1. Selected name of the array.
The "TSIBuffer" word will be already typed in the "Find what" field of the opened "Find" window. Select "Up" in the "Direction" section. Now, when the "Find" window is open, put the cursor right after the OnCalculate() function, press the "Find Next" button once and you will find the place where the calculations of the TSIBuffer array are over right away. Calculations are performed in the "for" loop. We will add the code for calculation of the signal line right after this loop (fig. 2).
. The cycle where the calculations are performed is marked with the red frame.")
Fig. 2. Last found location of calculation of the TSIBuffer value (red arrow). The cycle where the calculations are performed is marked with the red frame.
The functions for calculation of all main four types of moving averages are included in the MovingAverages.mqh library:
- for the simple one - SimpleMAOnBuffer(),
- for the exponential one - ExponentialMAOnBuffer(),
- for the linear weighted one - LinearWeightedMAOnBuffer(),
- for the smoothed one - SmoothedMAOnBuffer().
All these functions have the same set of parameters:
const int rates_total, const int prev_calculated, const int begin, const int period, const double& price[],double& buffer[]
The price[] parameter of the function determines an array with the initial data the calculation of a moving average will be performed on. The buffer parameter is the array that will store the values of moving average. The rates_total and prev_calculated parameters are the same as the rates_total and prev_calculated parameters of the onCalculate() function, they determine size of the price[] array and number of already processed elements of the array. The begin parameter is the index of an element of the array the significant data start from.
Considering the peculiarities of algorithms of calculation of the moving averages in the MovingAverages.mqh library (this features are of no pertinence to the topic of this article), we need a careful approach to setting of the begin parameter.
This parameter in any case mustn't be set to an earlier element of the array than the one the values of the source data start from (the TSIBuffer array). It is allowed to specify a later element if it doesn't lead to errors in calculations.
To determine an acceptable value of begin, pay attention to the parameters of the for cycle, where the values of the TSIBuffer array are calculated - the cycle starts from value of the start variable. We need to find out the value of the start variable that it had during the first calculation of the indicator (when the prev_calculated value is equal to 0). Value of the "start" variable is calculated right before the cycle, when prev_calculated=0; the calculation is performed using the following formula:
start=begin+r+s-1;Value of the begin variable that is passed to the function of calculation of moving averages must be equal to that value.
After the loop of calculation of the TSIBuffer array declare the begin2 variable and assign begin+r+s-1 value to it.
int begin2=begin+r+s-1;
To provide the possibility of using different functions of smoothing depending on the value of the external parameter "sm", use the switch operator. For each variant of value of the sm variable write the call of the corresponding function.
switch(sm)
  {
   case MODE_EMA:
      ExponentialMAOnBuffer(rates_total,prev_calculated,begin2,sp,TSIBuffer,TSISigBuffer);
      break;
   case MODE_LWMA:
      LinearWeightedMAOnBuffer(rates_total,prev_calculated,begin2,sp,TSIBuffer,TSISigBuffer);
      break;
   case MODE_SMA:
      SimpleMAOnBuffer(rates_total,prev_calculated,begin2,sp,TSIBuffer,TSISigBuffer);
      break;
   case MODE_SMMA:
      SmoothedMAOnBuffer(rates_total,prev_calculated,begin2,sp,TSIBuffer,TSISigBuffer);
      break;
  }
After that we can see the indicator with the signal line. Press the "Compile" button, open the client terminal and attach the indicator to a chart (fig. 3).
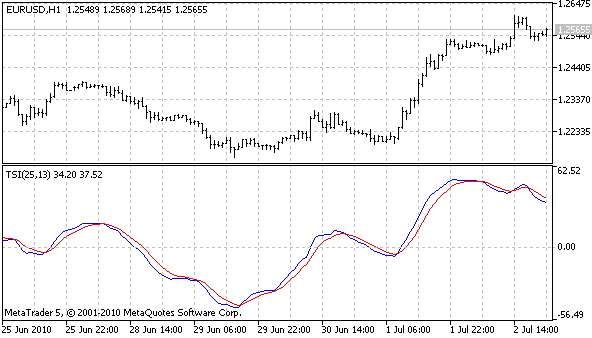
Fig. 3. Indicator TSIs, blue - main line, red - new, signal line.
8. Cutting Off the Beginning of Drawing of the Buffer
If you scroll a chart with the indicator to the left edge, you'll see that the indicator draws lines in the part for which values were not calculated. It doesn't look beautiful (fig. 4).
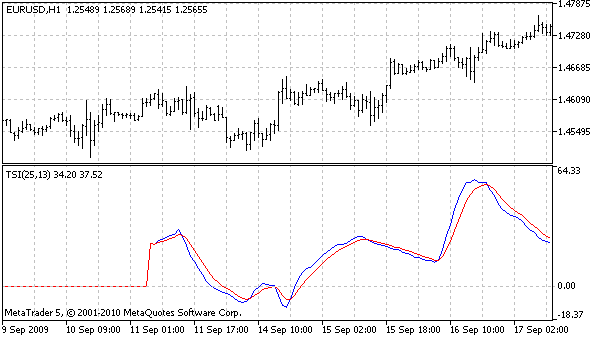
Fig. 4. Drawing of the indicator in the part where the calculation were not performed.
Using the PlotIndexSetInteger() function that is called with the PLOT_DRAW_BEGIN identifier, determine the number of first bars where the buffer is not drawn. The call of the function should be performed from within the OnInit() function of the indicator. Add the call of the function at the very end of OnInit(), but before the call of return(0), as a matter of course.
PlotIndexSetInteger(1,PLOT_DRAW_BEGIN,r+s+sp);
Press the "Compile" button again and get the correct beginning of drawing of the indicator (fig. 5).
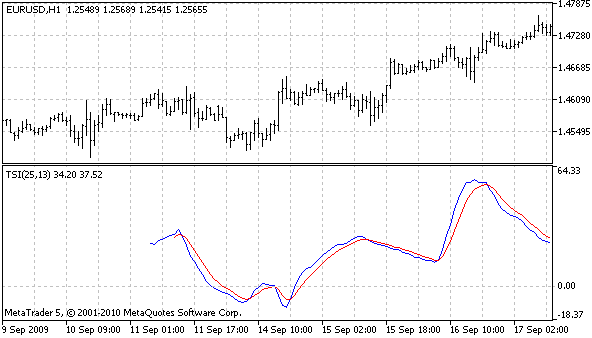
Fig. 5. Correct beginning of drawing of the indicator.
Second Way. Creating a New Indicator on the Basis of Existing One
We will consider this way using an example of creation of an indicator of convergence and divergence of the main and signal lines of the TSIs indicator. The indicator will be drawn as a histogram and will have two colors like the AO, AC indicators. If the value of indicator increases, the histogram will be colored in green; if it decreases, the histogram will be colored in red. As already mentioned above in the introduction, to refer to another indicator you can use the iCustom() or IndicatorCreate() function. At first, let's take a look into creating an indicator using the iCustom() function.
Creating Indicator Using the iCustom() Function
1. Creating New Indicator
Let's create a new indicator. To create a new indicator in MetaEditor you should execute the "Main Menu" - "File" - "New" - "Custom Indicator" command or press the "Ctrl+N" key combination. In the "Name" field of the appeared window specify name of the new indicator - TSIsCDiCust, then press the "Add" button. Add an external parameter, its name is not as important as determining of a part for external parameters in the code; further it will be easier to copy all the external parameters from the TSIs indicator (fig. 6).

Fig. 6. First step of creating a custom indicator in the wizard.
Press the "Next" button.
In the next window specify that the indicator will be drawn in a separate window. Do not define minimum and maximum. Press the "Add" button and a new buffer will appear in the list of indicator buffers; specify its name - TSIsCD (it will be displayed in a pop up help if you put the mouse cursor over the indicator line and in the data window) and its type - Color Histogram.
After that several examples of color will appear in the "Color" field. Specify the Green color for the first example, the Red color for the second one, and leave the others without changes. Add two more buffers named Tsi and TsiSignal, they will be used for receiving and storing values of the TSIs indicator (fig. 7).

Fig. 7. Second step of creating a custom indicator in the wizard.
Press the "Finish" button and the template of the new indicator will be opened in MetaEditor.
2. Editing Properties of the Indicator and the Indicator Buffers
At the step 1 we determined 3 buffers; however, the value of #property indicator_buffers is equal to 4. The thing is a colored histogram uses two buffers - one is displayed on a chart and is intended for values of an indicator; and the second one is intended for determining color of displaying of the first buffer. Leave the #property indicator_buffers value without changes. Change the #property indicator_plots value to 1 - only one buffer should be displayed on a chart.
The Tsi and TsiSignal buffers shouldn't be displayed on a chart, that is why delete all their properties (all the properties of indicator that end with 2 and 3).
//--- plot Tsi
#property indicator_label2 "Tsi"
#property indicator_type2 DRAW_LINE
#property indicator_color2 Red
#property indicator_style2 STYLE_SOLID
#property indicator_width2 1
//--- plot TsiSignal
#property indicator_label3 "TsiSignal"
#property indicator_type3 DRAW_LINE
#property indicator_color3 Red
#property indicator_style3 STYLE_SOLID
#property indicator_width3 1
In the OnInit() function find the calls of the SetIndexBuffer() function for these buffers (names of arrays are TsiBuffer and TsiSignalBuffer), change value of the third parameter from INDICATOR_DATA to INDICATOR_CALCULATIONS.
SetIndexBuffer(2,TsiBuffer,INDICATOR_CALCULATIONS);
SetIndexBuffer(3,TsiSignalBuffer,INDICATOR_CALCULATIONS);
Modify the indicator_color1 property - leave only first two colors.
#property indicator_color1 Green,Red3. Declaring External Parameters
Open the TSIs indicator in MetaEditor and copy all the external variables from it, replace the current external variable Input1 with these parameters.
//--- input parameters
input int r=25;
input int s=13;
input int sp=5;                 // Smoothing period
input ENUM_MA_METHOD sm=MODE_EMA; // Smoothing type
4. Declaring a Variable for the Indicator Handle and Calling the Indicator
In the common section of the indicator declare a variable of the int type and name it Handle. Call the iCustom() function at the very bottom of OnInit(). The function returns handle of the created indicator; we need it for receiving of values of the indicator. Assign the value returned by the function to the Handle variable.
First two parameters of the iCustom() function determine a symbol and timeframe which data will be used for calculation of the indicator. Let's specify a symbol and timeframe the indicator is attached to - _Symbol and PERIOD_CURRENT. Third parameter is name of a custom indicator; in this case it is TSIs. All the external parameters of the called indicator are listed further:
Handle=iCustom(_Symbol,PERIOD_CURRENT,"TSIs",r,s,sp,sm);
5. Preparing the OnCalculate() Function
Let's pass to the OnCalculate() function. The TSIs indicator is calculated on one buffer of data, so we will use the first form of the OnCalculate() function. Change the existing second form of the OnCalculate() function in the template to the first one.
int OnCalculate(const int rates_total,         // size of the price[] array
                const int prev_calculated,   // bars processed during the previous call
                const int begin,             // from where the significant data begin
                const double &price[]        // array for calculation
                )
  {
   return(rates_total);
  }
The further working on the indicator will be performed within this function.
6. Determining Limits of Calculation of the Indicator
Top priority and importance in development of any indicator is the determination of limits of range of processed bars. At the start of indicator we should perform calculation of the indicator for each bar, during its operation - for only one that is currently formed. You can detect the moment of start of the indicator through the value of the prev_calculated variable. If this value is equal to zero, then this is the first execution of the OnCalculate() function since the start of indicator.
At the first execution of the OnCalculate() function you should determine index of the first bar the calculations should be started from. Its value is determined by the number of bars that are needed for calculation of value of the indicator (indexing is performed from left to right).
The incline of the line of the indicator is determined by two bars, so we need another previous bar. Index of a bar, the significant data of the price[] array start from, is know - it is the value of the begin variable; so we start calculation of bars from the start=begin+1 bar.
Further, during working of the indicator, the index of a bar the calculation starts from is determined by the value of the prev_calculated variable - this variable contains the number of already processed bars. Thus, to find out the index of the last bar the calculations has been performed for, you should subtract 1 from prev_calculated.
The last of already processed bars will be taken into calculations again because it can be a forming bar. Limit of calculation is determined by the size of the price[] array - the rates_total variable. Index of the last bar the calculations are performed for is equal to rates_total-1 (it's is less than size of the array by one).
Since the indicator uses data of another indicator for its calculation, we should get this data. You can get data of another indicator using the CopyBuffer() function. In the first parameter of the function you should specify handle of an indicator, data of which should be copied (handle is obtained at the stage 4); in the second parameter specify an index of the copied buffer (necessary value can be determined through the "Color" tab of the properties of the copied indicator, the counting is started from zero).
Third parameter is the index of a bar the copying is started from; in this case, the indexing is performed from right to left so the rightmost bar is the zero one. Fourth parameter is the number of array elements to be copied. You should be careful with determining the number of copied elements as much as with determining the range of bars taken into calculation. It affects performance of the indicator. Index of a bar the calculation of the indicator starts from is determined preliminary, so the number of copied elements is calculated as rates_total-start. During the work process, when the indicator is calculated for the forming bar only, only one element of the array is copied.
If the CopyBuffer() functions return -1 at an attempt of copying information, it means that the data cannot be copied, so there is no point in performing calculations. This error should be handled. At the very beginning of the CopyBuffer() declare a static variable of the bool type and name it "error". If an error occurs during the process of calculation of the indicator, particularly the error of copying the indicator data, assign the value True to this variable and end the execution of the OnCalculate() function.
Recalculate the whole indicator again at the next tick if the error value says that there was an error during the previous execution of the OnCalculate() function. Thus, the beginning of the OnCalculate() function will look as following:
   static bool error=true;
   int start;
   if(prev_calculated==0) // First execution of the OnCalculate() function after the indicator start
     {
      error=true; // Set the value True for the indicator to be calculated for all bars
     }
   if(error) // If value of error=true, then it is the first execution of the function after
             // the start of the indicator, or there was an error of copying of data at the previous start
     {
      start=begin+1;
      error=false;
     }
   else
     {
      start=prev_calculated-1;
     }

   if(CopyBuffer(Handle,0,0,rates_total-start,TsiBuffer)==-1) // Copying data of main line of the indicator
     {
      error=true; // Failed to copy data, set the value True for the error variable to recalculate the whole
                 // indicator at the next call of OnCalculate()
      return(0);  // End working of the function
     }
   if(CopyBuffer(Handle,1,0,rates_total-start,TsiSignalBuffer)==-1) // Copy data of the signal line of the indicator
     {
      error=true; // Failed to copy data, set the value true for the error variable to recalculate the whole
                 // indicator at the next call of the OnCalculate() function
      return(0);  // End working of the function
     }
Limits of the indicator calculation are determined, make a loop of calculations in this range of bars.
for(int i=start;i<rates_total;i++)
  {

  }
Calculate the indicator value (the code is located inside the loop that has just been created).
TsiCDBuffer[i]=TsiBuffer[i]-TsiSignalBuffer[i];
Now the most interesting thing - coloring the buffer. Previously at the stage 1 we determined the use of a colored histogram for the indicator buffer. This type of drawing requires two buffers - one is for the indicator value and the other one is for the color. The list of colors is set in the indicator_color1 property. When value 0 is set for the buffer element, the indicator is displayed with the green color; when value 1 is set, the indicator is red (in accordance with their location in the indicator_color1 in the list; numbering starts from zero).
It is impossible to avoid a situation when the indicator values are equal at two adjacent bars; in this case, the indicator should be displayed with the previous color (because we have only two colors for up and down movements). Thus, at the beginning of calculations we will copy the value of the TsiCDColors buffer on the previous bar:
TsiCDColors[i]=TsiCDColors[i-1];When moving upwards color the indicator with the Green color:
if(TsiCDBuffer[i]>TsiCDBuffer[i-1])TsiCDColors[i]=0;
When moving down color the indicator with the Red color:
if(TsiCDBuffer[i]<TsiCDBuffer[i-1])TsiCDColors[i]=1;
This almost brings us to the end of working on the indicator; it is left to determine the beginning of indicator drawing.
7. Completing the Work on Indicator
Despite the begin variable is used for determining the calculation of the indicator, it doesn't mean that the indicator data starts from the bar that is identified with the begin variable. If algorithm of a custom indicator is not known, it is almost impossible to detect the number of bars that is necessary for indicator calculation. That is why this stage can be skipped or you can detect a value on the basis of experience. However, we know the algorithm of the TSIs indicator, so we can exactly detect the beginning of the indicator. Add the call of the PlotIndexSetInteger() function with the PLOT_DRAW_BEGIN identifier to the OnInit() function.
PlotIndexSetInteger(0,PLOT_DRAW_BEGIN,r+s+sp);
The TSIs indicator displays values accurate to two decimal places; set the same accuracy using the IndicatorSetInteger() function with the INDICATOR_DIGITS identifier:
IndicatorSetInteger(INDICATOR_DIGITS,2);
Compile the indicator and attach it to a chart (fig. 8).
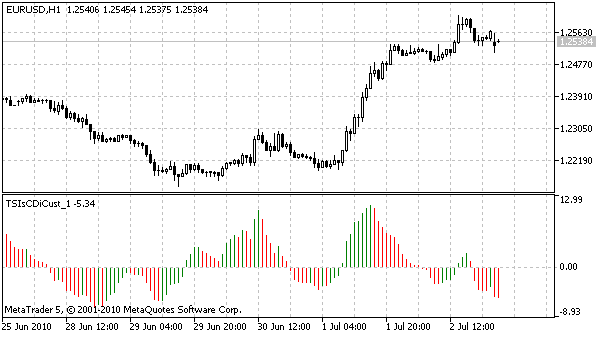
Fig. 8. Indicator TSIsCDiCust.
Creating an Indicator Using the IndicatorCreate() Function
The creation of an indicator using the IndicatorCreate() function is the same as creation of it using the iCustom() function, except for the step 4 - the IndicatorCreate() funciton is used instead of iCustom().
1. Save a copy of the TSIsCDiCust indicator under the TSIsCDiCreate name.
2. Find where the iCustom() function is called in the code. From now on the call of the IndicatorCreate() function will be performed instead of iCustom(). The same as in iCustom(), first two parameters of the function IndicatorCreate() determine a symbols and timeframe that will be used for calculation of the indicator. Third parameter is an identifier of the indicator type, for a custom indicator it is IND_CUSTOM. Parameters of the create indicator are passed to the function using the array of structures MqlParam.
The MqlParam contains four variables - three of them are variables of different types used for values: double_value, integer_value and string_value; and another one is type, it determines the type of used variable. The TSIs indicator has four external parameters. Since the indicator is a custom one, first element of the array determines name of the custom indicator, thus, the array should contain five elements. Declare an array of structures (the code is located where the iCustom() was called):
MqlParam Params[5];
Fill the array with values:
   Params[0].type=TYPE_STRING;
   Params[0].string_value="TSIs"; // Specify name of the called custom indicator in the first parameter

   Params[1].type=TYPE_INT;
   Params[1].integer_value=r;

   Params[2].type=TYPE_INT;
   Params[2].integer_value=s;

   Params[3].type=TYPE_INT;
   Params[3].integer_value=sp;

   Params[4].type=TYPE_INT;
   Params[4].integer_value=sm;
We already dealt with first three parameters passed to the IndicatorCreate() function. Size of the array of parameters is passed through the fourth parameter; the last one is the array with parameters itself:
Handle=IndicatorCreate(_Symbol,PERIOD_CURRENT,IND_CUSTOM,5,Params);
It is left to press the "Compile" button and check the indicator in the client terminal.
Conclusion
Let's briefly repeat the main ideas you should pay attention to while creating a custom indicator on the basis of another indicator.
When improving an indicator, you should correctly specify the number of buffers and the number of buffers to be drawn (the indicator_buffers, indicator_plots properties ); you should determine the properties of new buffers (the indicator_label, indicator_type, indicator_color, indicator_style, indicator_width properties). When calling the SetIndexBufer() function for the new buffers, you should specify the correct value of the third parameter (INDICATOR_DATA or INDICATOR_CALCULATIONS); and correctly specify the values of the first parameter (index of buffer); perform the re-indexation of buffers if needed.
When creating a new indicator using another custom indicator, you should correctly pass parameters to the iCustom() function; and fill the structure of parameters when using the IndicatorCreate() function. Here you should also watch the correct specification of parameters when calling the SetIndexBuffer() function; and the most important thing is not to forget to perform the call of the SetIndexBuffer() function for new buffers.
Everytime you work with indicators, you should pay attention to determining a range of calculation of bars - use the values of the prev_calculated, rates_total, begin variables. MetaEditor will help you to deal with the other errors that can appear during programming (error messages that appear during compilation are displayed at the "Errors" tab).