How to create a custom indicator (Heiken Ashi) using MQL5
Mohamed Abdelmaaboud | 24 April, 2023
Introduction
We all need to read charts and any tool that can be helpful in this task will be very welcomed. Among tools that can be helpful in reading charts are indicators that are calculated based on prices, volume, another technical indicator or a combination of them, while there are many ideas that exist in the trading world. We have a lot of ready-made indicators built-in in the trading terminal and if we need to add some features to be suitable for our trading style, we can find some challenges because it may not be changeable in addition to that we may not find this indicator as a built-in in the trading terminal.
In this article, I will share with you a method to overcome this challenge by benefiting from the iCustom function and creating your custom indicator following your terms and based on your preferences. We will also see an example, as we will create a custom Heiken Ashi technical indicator and we will use this custom indicator in trading system examples. We will cover that through the following topics:
- Custom Indicator and Heiken Ashi Definition
- Simple Heiken Ashi Indicator
- EA based on Custom Heiken Ashi Indicator
- Heiken Ashi - EMA System
- Conclusion
After understanding what I share in the previous topics you should be able to create your custom indicator that will assist in reading charts and that you can use in your trading system. We will use the MQL5 (MetaQuotes Language) which is built into the MetaTrader 5 trading platform to write codes of indicators that will be created and EAs. If you do not know how to download and use them you can read the topic Writing MQL5 code in MetaEditor from a previous article, it can be helpful in that.
Custom Indicator and Heiken Ashi definition
In this part, we will learn in more detail about the custom indicator and the Heiken Ashi indicator. As I mentioned in the introduction in the previous section, the custom indicator is the technical analysis tool that can be created by the user using the MQL5 programming language. It can be used in MetaTrader 5 to analyze and understand the market movement and can assist in taking informed investment decisions. There are many useful built-in technical indicators but sometimes we need to analyze and understand how the market is acting based on some additional and specific mathematical, statistical or technical concepts, and these concepts do not exist in the built-in indicator or there is no indicator can do the task. So, in such cases we have to create the indicator ourselves — and this is one of the features of the MetaTrader 5 platform as it helps us to create our own analytical or trading tools to meet our specific preferences and objectives.
Let us consider the required steps to start creating your custom indicator:
Open the MetaEditor IDE and choose the 'Indicators' folder in the Navigator
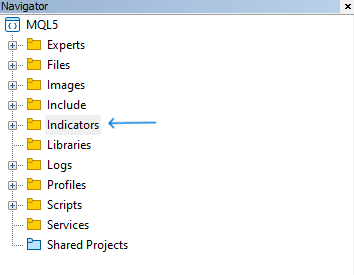
Click the 'New' button to create a new program as shown in the below picture

After that, the following window will be opened, in which you should choose the type of program to be created. Here we choose 'Custom Indicator'
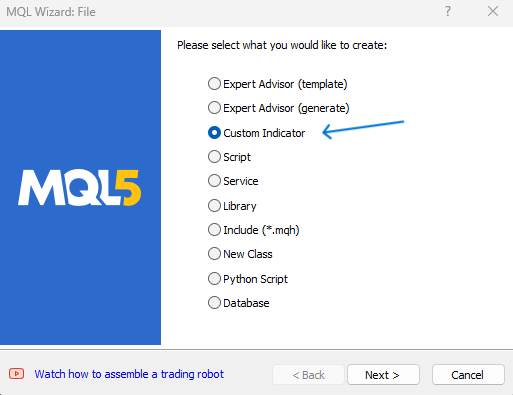
After clicking 'Next', the following window with the indicator details will be opened. Specify here the name for the custom indicator and then click 'Next'
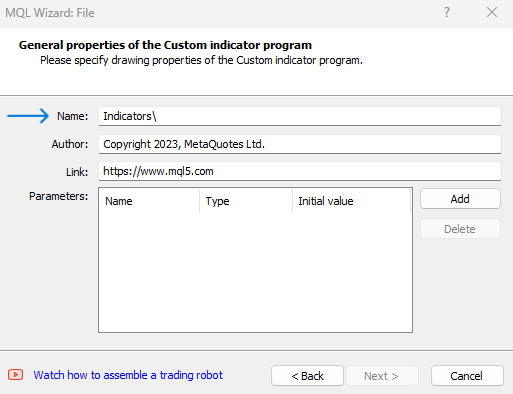
In the next windows, we proceed with determining more indicator details
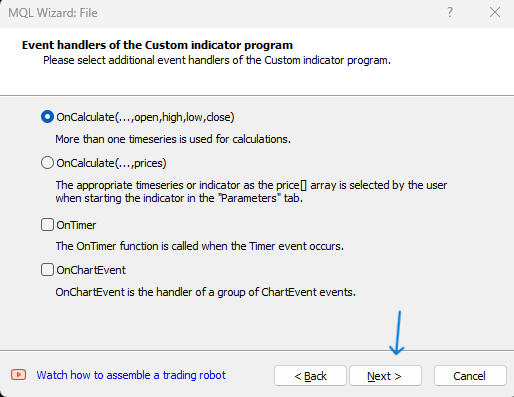
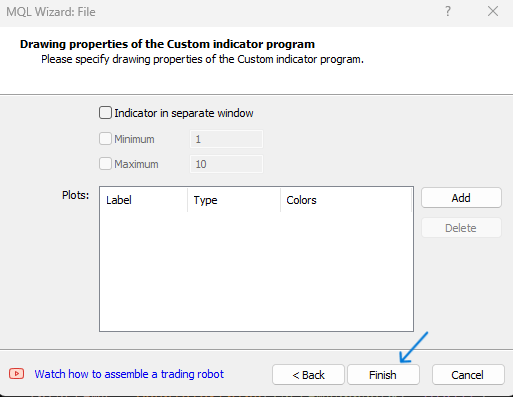
Once we complete setting the preferences and clicking 'Next' then 'Finish', the editor window will open, where we will write the code of the indicator.
We will look at how to develop a custom indicator using Heiken Ashi as an example. So, we need to learn more about the Heiken Ashi technical indicator. It is a candlesticks-type charting method that can be used to present and analyze the market movement and it can be used in conjunction with other tools to get effective and better insights, based on which we can take informed trading decisions after finding good potential trading ideas and opportunities.
The Heiken Ashi charts are similar to the normal candlestick technical charts but the calculation to plot these candles is different. Namely, there are two methods that differ. As we know, the normal candlesticks chart calculates prices based on actual open, high, low, and close prices in a specific period, but the Heiken Ashi takes into consideration the prices of the previous similar prices (open, high, low, and close) when calculating its candles.
Here is how the relevant values for Heiken Ashi are calculated:
- Open = (open of previous candle + close of the previous candle) / 2
- Close = (open + close + high + low of the current candle) / 4
- High = the highest value from the high, open, or close of the current period
- Low = the lowest value from the low, open, or close of the current period
Based on the calculation, the indicator constructs bull and bear candlesticks, and the colors of these candlesticks indicate the relevant direction of the market: if it is bullish or bearish. Below is an example that shows the traditional Japanese candlesticks and Heiken Ashi, so see the difference from a visual perspective.
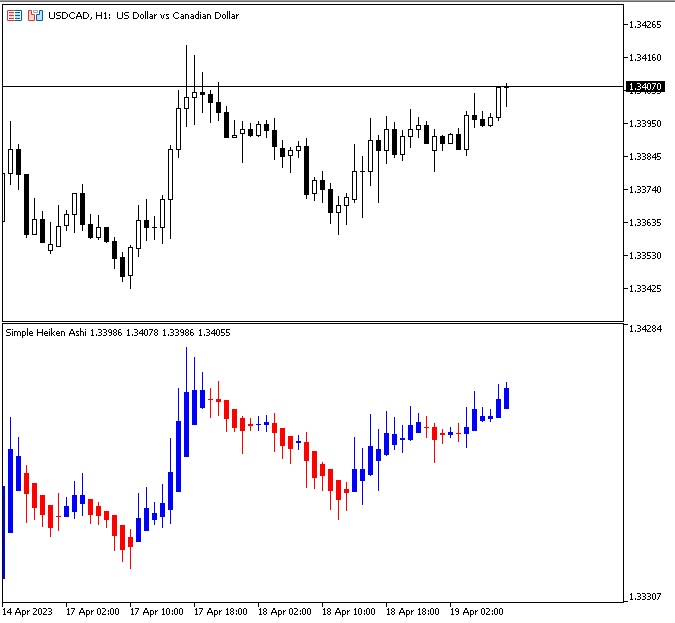
In the previous chart screenshot, the upper part shows the traditional candlesticks, while in the lower part there is the Heiken Ashi Indicator that appears as blue and red candlestick which define the market direction. The aim of this indicator as per its calculation is to filter and eliminate some of the noise in the market movement by smoothing data to avoid false signals.
Simple Heiken Ashi Indicator
In this part, we will create a simple Heiken Ashi indicator to be used in the MetaTrader 5. The indicator should continuously check prices (open, high, low, and close) and perform the mathematical computations to generate the haOpen, haHigh, haLow, and haClose values. Based on the calculations, the indicator should plot the values on the chart as candlesticks in different colors: blue if the candlestick direction is candle and red if it is bearish. The candlesticks should be displayed in a separate window below the traditional chart as a sub-window.
Let us view all the steps we need to complete to create this custom indicator.
Determining the indicator settings by specifying additional parameters via #property and identifier values, as follows:
- (indicator_separate_window) to show the indicator in a separate window.
- (indicator_buffers) to determine the number of buffers for the indicator calculation.
- (indicator_plots) to determine the number of graphic series in the indicator. Graphic series are drawing styles that can be used when creating a custom indicator.
- (indicator_typeN) to determine the type of graphical plotting from the values of (ENUM_DRAW_TYPE), N is the number of graphic series that we determined in the last parameter and it starts from 1.
- (indicator_colorN) to determine the color of N, N is also the number of graphic series that we determined before and it starts from 1.
- (indicator_widthN) to determine the thickness of N or graphic series also.
- (indicator_labelN) to set a label for N of the determined graphic series.
#property indicator_separate_window
#property indicator_buffers 5
#property indicator_plots   1
#property indicator_type1   DRAW_COLOR_CANDLES
#property indicator_color1  clrBlue, clrRed
#property indicator_width1  2
#property indicator_label1  "Heiken Ashi Open;Heiken Ashi High;Heiken Ashi Low;Heiken Ashi Close"
Create five arrays for five buffers of the indicator (haOpen, haHigh, haLow, haClose, haColor) with double type.
double haOpen[];
double haHigh[];
double haLow[];
double haClose[];
double haColor[];
Inside the OnInit(), this function is used to initialize a running indicator.
int OnInit()
Sorting indicator buffers with a one-dimensional dynamic array of the double type by using the (SetIndexBuffer) function. Its parameters are:
- index: the number of the indicator buffer starting from 0 and this number must be less than the value that is declared in determined parameter of (indicator_buffers).
- buffer[]: the array that is declared in our custom indicator.
- data_type: the data type that we need to store in the indicator array.
   SetIndexBuffer(0,haOpen,INDICATOR_DATA);
   SetIndexBuffer(1,haHigh,INDICATOR_DATA);
   SetIndexBuffer(2,haLow,INDICATOR_DATA);
   SetIndexBuffer(3,haClose,INDICATOR_DATA);
   SetIndexBuffer(4,haColor,INDICATOR_COLOR_INDEX);
Setting the value of the corresponding indicator property by using the (IndicatorSetInteger) function with the variant of calling in which we specify the property identifier. Its parameters are:
- prop_id: the identifier of the property that can be one of the (ENUM_CUSTOMIND_PROPERTY_INTEGER), we will specify (INDICATOR_DIGITS).
- prop_value: the value of the property, we will specify (_Digits).
IndicatorSetInteger(INDICATOR_DIGITS,_Digits);
Setting the value of the corresponding string type property with the variant of calling in which we also specify the property identifier. Its parameters are:
- prop_id: the identifier of the property that can be one of the (ENUM_CUSTOMIND_PROPERTY_STRING), we will specify (INDICATOR_SHORTNAME) to use a short name for the indicator.
- prop_value: the value of the property, we will specify ("Simple Heiken Ashi").
IndicatorSetString(INDICATOR_SHORTNAME,"Simple Heiken Ashi");
Setting the value of the corresponding double type property of the corresponding indicator by using the (PlotIndexSetDouble) function. Its parameters are:
- plot_index: the index of the graphical plotting, we will specify 0.
- prop_id: one of the (ENUM_PLOT_PROPERTY_DOUBLE) values, it will be (PLOT_EMPTY_VALUE) for no drawing.
- prop_value: the value of the property.
PlotIndexSetDouble(0,PLOT_EMPTY_VALUE,0.0);
Then return (INIT_SUCCEEDED) as a part of the OnInit() function to terminate it by returning successful initialization.
return(INIT_SUCCEEDED);
Inside the OnCalculate function that is called in the indicator for processing price data changes with the type of calculations based on the current timeframe time series.
int OnCalculate(const int rates_total,
                const int prev_calculated,
                const datetime &time[],
                const double &open[],
                const double &high[],
                const double &low[],
                const double &close[],
                const long &tick_volume[],
                const long &volume[],
                const int &spread[])
Creating an integer 'start' variable, we will assign its value later:
int start; Using the 'if' statement to return indexes values (low, high, open, and close) and start value=1 if the prev_calculated is equal to 0 or return start value assigned to (prev_calculated-1):
   if(prev_calculated==0)
     {
      haLow[0]=low[0];
      haHigh[0]=high[0];
      haOpen[0]=open[0];
      haClose[0]=close[0];
      start=1;
     }
   else
      start=prev_calculated-1;
Using the 'for' function for the main loop for the calculation, the 'for' operator consists of three expressions and executable operators.
The three expressions will be:
- i=start: for the starting position.
- i<rates_total && !IsStopped(): for the conditions to finish the loop. IsStopped() checks the forced shutdown of the indicator.
- i++: add 1 to be the new i.
The operations that we need to execute every time during the loop:
Calculation for the double four variables
- haOpenVal: for the Heiken Ashi open value.
- haCloseVal: for the Heiken Ashi close value.
- haHighVal: for the Heiken Ashi high value.
- haLowVal: for the Heiken Ashi low value.
Assigning calculated values in the previous step is the same as the following
- haLow[i]=haLowVal
- haHigh[i]=haHighVal
- haOpen[i]=haOpenVal
- haClose[i]=haCloseVal
Checking if the open of Heiken Ashi value is lower than the close value, we need the indicator to draw a blue color candle or if not we need it to draw a red candlestick.
   for(int i=start; i<rates_total && !IsStopped(); i++)
     {
      double haOpenVal =(haOpen[i-1]+haClose[i-1])/2;
      double haCloseVal=(open[i]+high[i]+low[i]+close[i])/4;
      double haHighVal =MathMax(high[i],MathMax(haOpenVal,haCloseVal));
      double haLowVal  =MathMin(low[i],MathMin(haOpenVal,haCloseVal));

      haLow[i]=haLowVal;
      haHigh[i]=haHighVal;
      haOpen[i]=haOpenVal;
      haClose[i]=haCloseVal;

      //--- set candle color
      if(haOpenVal<haCloseVal)
         haColor[i]=0.0;
      else
         haColor[i]=1.0;
     }
Terminate the function by returning (rates_total) as a prev_calculated for the next call.
return(rates_total); Then we compile the code to make sure that there are no errors. The following is for the full code in one block:
//+------------------------------------------------------------------+
//|                                             simpleHeikenAshi.mq5 |
//|                                  Copyright 2023, MetaQuotes Ltd. |
//|                                             https://www.mql5.com |
//+------------------------------------------------------------------+
#property copyright "Copyright 2023, MetaQuotes Ltd."
#property link      "https://www.mql5.com"
#property version   "1.00"
#property indicator_separate_window
#property indicator_buffers 5
#property indicator_plots   1
#property indicator_type1   DRAW_COLOR_CANDLES
#property indicator_color1  clrBlue, clrRed
#property indicator_width1  2
#property indicator_label1  "Heiken Ashi Open;Heiken Ashi High;Heiken Ashi Low;Heiken Ashi Close"
double haOpen[];
double haHigh[];
double haLow[];
double haClose[];
double haColor[];
int OnInit()
  {
   SetIndexBuffer(0,haOpen,INDICATOR_DATA);
   SetIndexBuffer(1,haHigh,INDICATOR_DATA);
   SetIndexBuffer(2,haLow,INDICATOR_DATA);
   SetIndexBuffer(3,haClose,INDICATOR_DATA);
   SetIndexBuffer(4,haColor,INDICATOR_COLOR_INDEX);
   IndicatorSetInteger(INDICATOR_DIGITS,_Digits);
   IndicatorSetString(INDICATOR_SHORTNAME,"Simple Heiken Ashi");
   PlotIndexSetDouble(0,PLOT_EMPTY_VALUE,0.0);
   return(INIT_SUCCEEDED);
  }
int OnCalculate(const int rates_total,
                const int prev_calculated,
                const datetime &time[],
                const double &open[],
                const double &high[],
                const double &low[],
                const double &close[],
                const long &tick_volume[],
                const long &volume[],
                const int &spread[])
  {
   int start;
   if(prev_calculated==0)
     {
      haLow[0]=low[0];
      haHigh[0]=high[0];
      haOpen[0]=open[0];
      haClose[0]=close[0];
      start=1;
     }
   else
      start=prev_calculated-1;
   for(int i=start; i<rates_total && !IsStopped(); i++)
     {
      double haOpenVal =(haOpen[i-1]+haClose[i-1])/2;
      double haCloseVal=(open[i]+high[i]+low[i]+close[i])/4;
      double haHighVal =MathMax(high[i],MathMax(haOpenVal,haCloseVal));
      double haLowVal  =MathMin(low[i],MathMin(haOpenVal,haCloseVal));

      haLow[i]=haLowVal;
      haHigh[i]=haHighVal;
      haOpen[i]=haOpenVal;
      haClose[i]=haCloseVal;
      if(haOpenVal<haCloseVal)
         haColor[i]=0.0;
      else
         haColor[i]=1.0;
     }
   return(rates_total);
  }
After compiling without errors, the indicator should become available in the 'Indicators' folder in the Navigator window, as in the following picture.
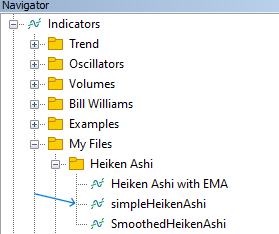
Then double-click to execute it on the desired chart, the common window of the indicator information will appear after that:
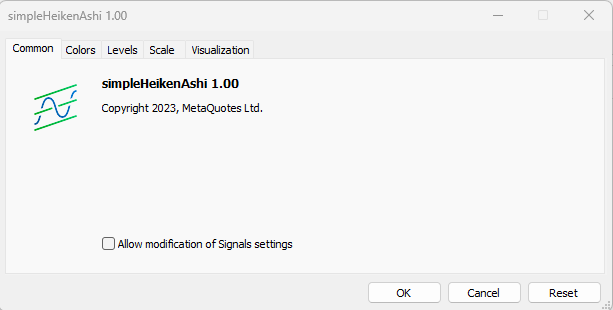
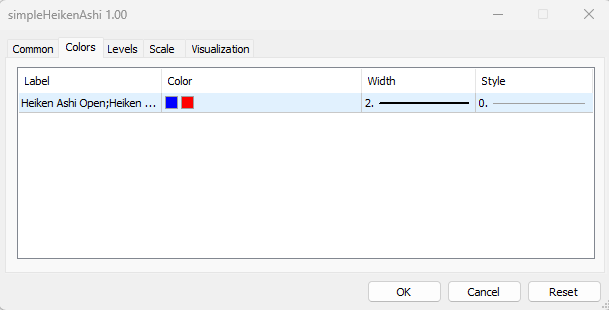
The Colors tab shows the default settings: blue color for up movement and red color down. If needed, you can edit these values to set your preferred colors. This tab looks as follows:
After we press OK, the indicator will be attached to the chart and will appear as in the below picture:
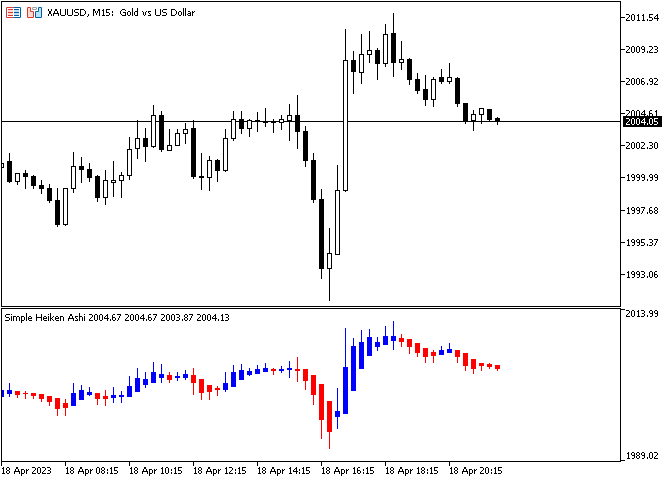
As you can see in the previous chart, we have the Simple Heiken Ashi indicator inserted into the chart in a separate sub-window. It has blue and red candlesticks as per the direction of these candles (bulls and bears). Now, we have a custom indicator that we have created in our MetaTrader 5 and we can use this custom indicator in any trading system. We will see in the upcoming topics how we can do that easily.
EA based on Custom Heiken Ashi Indicator
In this part, we will learn how to use any custom indicator in our trading system EA. We will create a simple Heiken Ashi System that can show us prices of the indicator (Open, High, Low, and Close) since we already know that they differ from actual prices as per the indicator's calculation.
The way to do that is to choose to create a new Expert Advisor. So, below is the following full code:
//+------------------------------------------------------------------+
//|                                             heikenAshiSystem.mq5 |
//|                                  Copyright 2023, MetaQuotes Ltd. |
//|                                             https://www.mql5.com |
//+------------------------------------------------------------------+
#property copyright "Copyright 2023, MetaQuotes Ltd."
#property link      "https://www.mql5.com"
#property version   "1.00"
int heikenAshi;
int OnInit()
  {
   heikenAshi=iCustom(_Symbol,_Period,"My Files\\Heiken Ashi\\simpleHeikenAshi");
   return(INIT_SUCCEEDED);
  }
void OnDeinit(const int reason)
  {
   Print("Heiken Ashi System Removed");
  }
void OnTick()
  {
   double heikenAshiOpen[], heikenAshiHigh[], heikenAshiLow[], heikenAshiClose[];
   CopyBuffer(heikenAshi,0,0,1,heikenAshiOpen);
   CopyBuffer(heikenAshi,1,0,1,heikenAshiHigh);
   CopyBuffer(heikenAshi,2,0,1,heikenAshiLow);
   CopyBuffer(heikenAshi,3,0,1,heikenAshiClose);
   Comment("heikenAshiOpen ",DoubleToString(heikenAshiOpen[0],_Digits),
           "\n heikenAshiHigh ",DoubleToString(heikenAshiHigh[0],_Digits),
           "\n heikenAshiLow ",DoubleToString(heikenAshiLow[0],_Digits),
           "\n heikenAshiClose ",DoubleToString(heikenAshiClose[0],_Digits));
  }
Differences in this code:
The type of the program is an Expert Advisor. So, the construction of this program will be different as it consists of three parts and they as follow:
- int OnInit(): it is used to initialize a running of the EA with its recommended type that returns an integer value.
- void OnDeinit: it is used to deinitialize a running of the EA that returns no value.
- void OnTick(): it is used to handle a new quote every tick and it returns no value.
Outside the scope of the previous functions and before them we created an integer variable (heikenAshi)
int heikenAshi; Inside the scope of the OnInit(), we assigned the value of the iCustom function to the 'heikenAshi' variable. The iCustom function returns the handle of the custom indicator which will be the Simple Heiken Ashi here but you can use any custom indicator in your Indicators folder. Its parameters are:
- symbol: the symbol name, we used (_Symbol) for the current symbol.
- period: the time frame, we used the (_Period) for the current time frame.
- name: the name of the custom indicator with its path in the Indicators folder of your MetaTrader 5 and here we used "My Files\\Heiken Ashi\\simpleHeikenAshi".
Then we terminated the function by returning (INIT_SUCCEEDED) for successful initialization.
int OnInit()
  {
   heikenAshi=iCustom(_Symbol,_Period,"My Files\\Heiken Ashi\\simpleHeikenAshi");
   return(INIT_SUCCEEDED);
  }
Inside the scope of the OnDeinit() function, we used the print function to inform that the EA is removed in the expert
void OnDeinit(const int reason)
  {
   Print("Heiken Ashi System Removed");
  }
Inside the scope of the OnTick() function, we used the following to complete our code:
Creating four double-type variables for the Heiken Ashi prices (Open, High, Low, and Close)
double heikenAshiOpen[], heikenAshiHigh[], heikenAshiLow[], heikenAshiClose[]; Getting data of buffers of the custom indicator by using the CopyBuffer function. Its parameters are:
- indicator_handle: the indicator handle, we used (heikenAshi).
- buffer_num: the indicator buffer number, we used (0 for open, 1 for high, 2 for low, and 3 for close).
- start_pos: the first element position to copy, we used 0 for the current element.
- count: the amount of data to copy, we used 1 and we do not need here more than that.
- buffer[]: the array to copy, we used (heikenAshiOpen for Open, heikenAshiHigh for high, heikenAshiLow for low, and heikenAshiClose for close).
Getting a comment on the chart with the current Heiken Ashi prices (Open, High, Low, and Close) by using the comment function:
   Comment("heikenAshiOpen ",DoubleToString(heikenAshiOpen[0],_Digits),
           "\n heikenAshiHigh ",DoubleToString(heikenAshiHigh[0],_Digits),
           "\n heikenAshiLow ",DoubleToString(heikenAshiLow[0],_Digits),
           "\n heikenAshiClose ",DoubleToString(heikenAshiClose[0],_Digits));
After compiling this code without any errors and executing it we can find the EA attached to the chart. We can receive the signal the same in the following testing example:
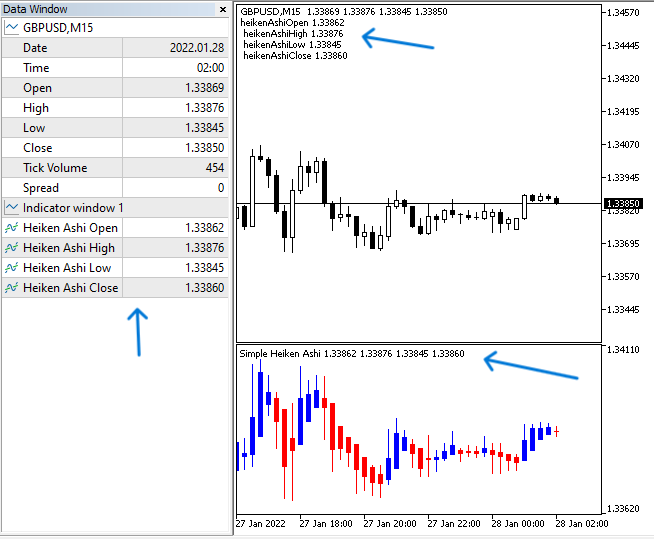
As we can see in the previous chart we have the indicator prices appear as a comment in the top left corner of the chart.
Heiken Ashi - EMA System
In this topic, we will combine another technical tool to see if the result will be better or not. The idea that we need to apply is to filter signals of the custom indicator by using the exponential moving average with prices. There are many methods to do that, we can create another Custom indicator for the EMA if we want to add more features to the EMA then we can use it in the EA as iCustom the same as we did to take your desired signals. We can also create a smoothed indicator by smoothing the indicator's values and then taking our signals. We can use the built-in iMA function in our EA to get our signals from it and we will use this method here for the sake of simplicity.
What we need to do is to let the EA continuously check values of the current 2 EMA (Fast and Slow) and Previous fast EMA and Heiken Ash close to determine the positions of every value. If the previous heikenAshiClose is greater than the previous fastEMAarray and the current fastEMA is greater than the current slowEMA value, the EA should return a buy signal and these values as a comment on the chart. If the previous heikenAshiClose is lower than the previous fastEMAarray and the current fastEMA is lower than the current slowEMA value, the EA should return a sell signal and these values as a comment on the chart.
The following is the full code to create this EA:
//+------------------------------------------------------------------+
//|                                          heikenAsh-EMASystem.mq5 |
//|                                  Copyright 2023, MetaQuotes Ltd. |
//|                                             https://www.mql5.com |
//+------------------------------------------------------------------+
#property copyright "Copyright 2023, MetaQuotes Ltd."
#property link      "https://www.mql5.com"
#property version   "1.00"
input int fastEMASmoothing=9; // Fast EMA Period
input int slowEMASmoothing=18; // Slow EMA Period
int heikenAshi;
double fastEMAarray[], slowEMAarray[];
int OnInit()
  {
   heikenAshi=iCustom(_Symbol,_Period,"My Files\\Heiken Ashi\\simpleHeikenAshi");
   return(INIT_SUCCEEDED);
  }
void OnDeinit(const int reason)
  {
   Print("Heiken Ashi-EMA System Removed");
  }
void OnTick()
  {
   double heikenAshiOpen[], heikenAshiHigh[], heikenAshiLow[], heikenAshiClose[];
   CopyBuffer(heikenAshi,0,0,3,heikenAshiOpen);
   CopyBuffer(heikenAshi,1,0,3,heikenAshiHigh);
   CopyBuffer(heikenAshi,2,0,3,heikenAshiLow);
   CopyBuffer(heikenAshi,3,0,3,heikenAshiClose);
   int fastEMA = iMA(_Symbol,_Period,fastEMASmoothing,0,MODE_SMA,PRICE_CLOSE);
   int slowEMA = iMA(_Symbol,_Period,slowEMASmoothing,0,MODE_SMA,PRICE_CLOSE);
   ArraySetAsSeries(fastEMAarray,true);
   ArraySetAsSeries(slowEMAarray,true);
   CopyBuffer(fastEMA,0,0,3,fastEMAarray);
   CopyBuffer(slowEMA,0,0,3,slowEMAarray);
   if(heikenAshiClose[1]>fastEMAarray[1])
     {
      if(fastEMAarray[0]>slowEMAarray[0])
        {
         Comment("Buy Signal",
                 "\nfastEMA ",DoubleToString(fastEMAarray[0],_Digits),
                 "\nslowEMA ",DoubleToString(slowEMAarray[0],_Digits),
                 "\nprevFastEMA ",DoubleToString(fastEMAarray[1],_Digits),
                 "\nprevHeikenAshiClose ",DoubleToString(heikenAshiClose[0],_Digits));
        }
     }
   if(heikenAshiClose[1]<fastEMAarray[1])
     {
      if(fastEMAarray[0]<slowEMAarray[0])
        {
         Comment("Sell Signal",
                 "\nfastEMA ",DoubleToString(fastEMAarray[0],_Digits),
                 "\nslowEMA ",DoubleToString(slowEMAarray[0],_Digits),
                 "\nprevFastEMA ",DoubleToString(fastEMAarray[1],_Digits),
                 "\nheikenAshiClose ",DoubleToString(heikenAshiClose[0],_Digits));
        }
     }
  }
Differences in this code are:
Creating user inputs to set the fast EMA period and slow EMA period as per user preferences.
input int fastEMASmoothing=9; // Fast EMA Period
input int slowEMASmoothing=18; // Slow EMA Period
Creating two arrays for fastEMA, and slowEMA.
double fastEMAarray[], slowEMAarray[]; Setting the amount of data to copy to 3 in the CopyBuffer to get the previous closing values of the Heiken Ashi indicator
   CopyBuffer(heikenAshi,0,0,3,heikenAshiOpen);
   CopyBuffer(heikenAshi,1,0,3,heikenAshiHigh);
   CopyBuffer(heikenAshi,2,0,3,heikenAshiLow);
   CopyBuffer(heikenAshi,3,0,3,heikenAshiClose);
Defining the fast and slow EMA by using the built-in function of iMA that returns the handle of the moving average indicator. Its parameters are:
- symbol: the symbol name, we used (_Symbol) for the current one.
- period: the time, we used (_Period) for the current one.
- ma_period: the period that needed to smooth the average, we used (fastEMASmoothing and slowEMASmoothing) inputs.
- ma_shift: the shift of the indicator, we used 0.
- ma_method: the type of the moving average, we used MODE_SMA for the simple moving average.
- applied_price: the needed price type to be used in the calculation, we used the PRICE_CLOSE.
   int fastEMA = iMA(_Symbol,_Period,fastEMASmoothing,0,MODE_SMA,PRICE_CLOSE);
   int slowEMA = iMA(_Symbol,_Period,slowEMASmoothing,0,MODE_SMA,PRICE_CLOSE);
Using the ArraySetAsSeries function to set the AS_SERIES flag. Its parameters are:
- array[]: the array, we used (fastEMAarray and slowEMA).
- flag: the array indexing direction, we used true.
   ArraySetAsSeries(fastEMAarray,true);
   ArraySetAsSeries(slowEMAarray,true);
Getting the data of the buffer of the EMA indicator by using the CopyBuffer function.
   CopyBuffer(fastEMA,0,0,3,fastEMAarray);
   CopyBuffer(slowEMA,0,0,3,slowEMAarray);
Conditions to return signals by using the 'if' statement:
In case of buy signal
If the previous heikenAshiClose > the previous fastEMAarray and the current fastEMAarray > the current slowEMAarray, the EA must return a buy signal and the following values:
- fastEMA
- slowEMA
- prevFastEMA
- prevHeikenAshiClose
   if(heikenAshiClose[1]>fastEMAarray[1])
     {
      if(fastEMAarray[0]>slowEMAarray[0])
        {
         Comment("Buy Signal",
                 "\nfastEMA ",DoubleToString(fastEMAarray[0],_Digits),
                 "\nslowEMA ",DoubleToString(slowEMAarray[0],_Digits),
                 "\nprevFastEMA ",DoubleToString(fastEMAarray[1],_Digits),
                 "\nprevHeikenAshiClose ",DoubleToString(heikenAshiClose[0],_Digits));
        }
In case of sell signal
If the previous heikenAshiClose < the previous fastEMAarray and the current fastEMAarray < the current slowEMAarray, the EA must return a sell signal and price values of:
- fastEMA
- slowEMA
- prevFastEMA
- prevHeikenAshiClose
   if(heikenAshiClose[1]<fastEMAarray[1])
     {
      if(fastEMAarray[0]<slowEMAarray[0])
        {
         Comment("Sell Signal",
                 "\nfastEMA ",DoubleToString(fastEMAarray[0],_Digits),
                 "\nslowEMA ",DoubleToString(slowEMAarray[0],_Digits),
                 "\nprevFastEMA ",DoubleToString(fastEMAarray[1],_Digits),
                 "\nheikenAshiClose ",DoubleToString(heikenAshiClose[0],_Digits));
        }
     }
After compiling this code with errors and executing it we can get our signals as shown in the following testing examples.
In the case of buy signal:
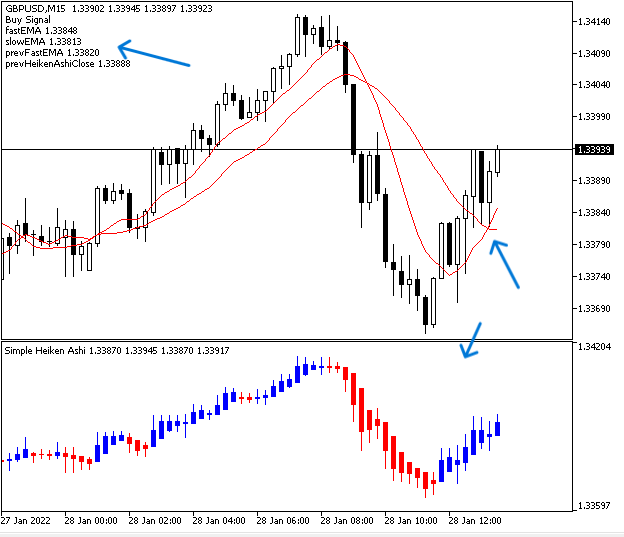
As we can see in the previous chart we have the following signal as a comment in the top left corner:
- Buy Signal
- fastEMA
- prevFastEMA
- prevHeikenAshiClose
In the case of sell signal:
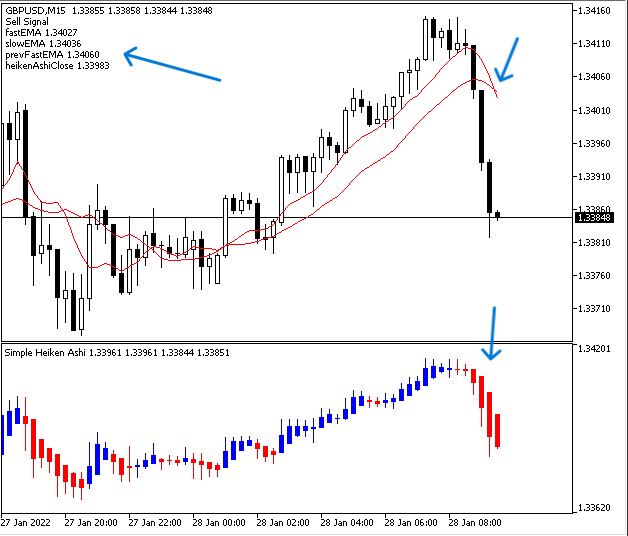
We have the following values as a signal on the chart:
- Sell Signal
- fastEMA
- prevFastEMA
- prevHeikenAshiClose
Conclusion
If you have understood everything that we discussed in this article, it is supposed that you are able to create your own Custom Heiken Ashi indicator or even add some more features as per your preferences. This will be very useful to read charts and take effective decisions based on your understanding. In addition to that you will be able to use this created custom indicator in your trading systems as Expert Advisors because we mentioned and used it in two trading systems as examples.
- Heiken Ashi System
- Heiken Ashi-EMA System
I hope that you found this article useful for you and you got good insights about the topic of it or any related topic. I hope also that you tried to apply what you learned in the article as it will be very useful in your programming learning journey as practicing is a very important factor in effective education processes. Please note that you must test anything you learned in this article or in other resources before using it in your real account as it may be harmful if it is not suitable for you. The main objective of this article is educational only, so you have to be careful.
If you found this article useful and you want to read more articles you can read more for me through my other authored articles. I hope you will find them useful too.