Category Theory in MQL5 (Part 5): Equalizers
Stephen Njuki | 4 April, 2023
Introduction
This is the fifth article in our series on the implementation of category theory in MQL5. In the previous article, we explored how the concepts of spans, experiments, and compositions in could be utilized in setting exit trading strategies. In this article, we will explore the implementation of equalizers in MQL5, using the foundations we established in the previous article, to possibly improve the shared example on exiting trades. We will explore how equalizers are used in category theory to compare and relate different morphisms, and how this can be applied to trading strategies to optimize performance. A possible guide on how these ideas can be harnessed further for more accurate results will be shared at the end.
Equalizers
In category theory, an equalizer is defined as a domain in a category that represents the "common behaviour" of a pair (or more) of parallel morphisms between 2 domains. More precisely, given two parallel morphisms (f, g): A --> B, the equalizer of f and g is an domain E in the category that satisfies the following conditions:
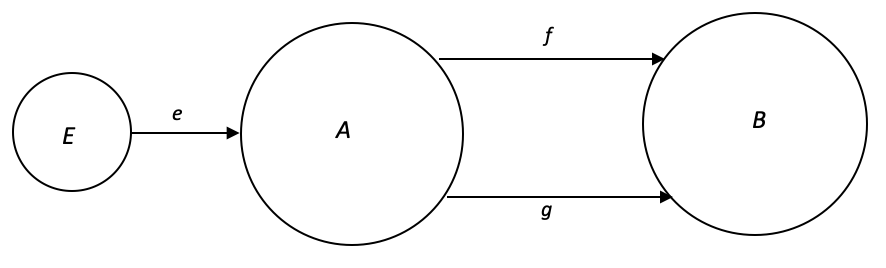
- There exists a morphism e: E --> A such that f . e = g . e.
- For any other domain X (not indicated above) with morphism h: X --> A such that f . h = g . h, there exists a unique morphism u: X --> E such that h = e . u.
Intuitively, the equalizer is the "optimum-sized" sub-domain of A that maps to both A and B via the pair of morphisms f and g by capturing the "common behaviour" of f and g in the sense that only the elements of A that map to similar elements in B are included in E. This means that any other domain, similar to E, that maps to both A and B via f and g can be factored-through E (composed) via a unique morphism.
Equivalence relations do satisfy at least one of the three properties; reflexivity, symmetry, and transitivity. These definitions act as classifiers of equivalence. They attempt to answer the questions. In which way are domains equivalent? Or how would their relation be described? Let's try to illustrate them from the perspective of traders. (The notation x R y means x has a relation R with y).
1. A relation R on a set A is reflexive if and only if for every element a in A, a R a, that is, every element is related to itself.
Examples:
- The volatility smile presents a reflexive equivalence relation in forex trading because it is symmetrical around the at-the-money (ATM) strike price, which is equal to the forward rate of the currency pair. For example, if the ATM strike price for the USD/EUR currency pair is 1.10, then the volatility smile is symmetric around the 1.10 strike price. So, we have strike-price R spot-price.
- There are not a lot of meaningful examples to share for reflexive relations but one additional obvious one we can look at is exchange rates. Every currency is related to itself through its exchange rate, which is always equal to 1. For example, the exchange rate of the USD to USD is always 1. This implies USD-rate R USD -rate.
2. A relation R on a set A is symmetric if and only if for every pair of elements, a and b in A, if a R b, then b R a. In other words, if a is related to b, then b is related to a.
Illustration:
- Two currency pairs are symmetrically equivalent if they represent the same exchange rate, but are in opposite directions. For instance, the EUR/USD and USD/EUR pairs are symmetrically equivalent, as both represent the exchange rate between the Euro and the US Dollar, but one is quoted in Euro, while the other in USD. So here we have EUR/USD R USD/EUR.
- Long and short positions are symmetrically equivalent concepts. A long position involves buying a currency with the expectation that its value will rise, while a short position involves selling a currency with the expectation that its value will fall. These two positions are symmetrically equivalent because they represent opposite perspectives on the same currency exchange rate.
3. A relation R on a set A is transitive if and only if for every triple of elements: a, b, and c in A, if a R b and b R c, then a R c. Said differently, if a is related to b and b is related to c, then a is related to c transitively.
Demo:
- In forex trading, interest rate parity is a theory that suggests that the exchange rate between two currencies should reflect the difference in interest rates between the two countries. If currency A has a higher interest rate than currency B, and currency B has a higher interest rate than currency C, then currency A should have a higher interest rate than currency C. This is an example of transitive equivalence.
- In forex trading, Fibonacci trading involves using mathematical ratios to identify potential support and resistance levels in currency prices. If a currency pair retraces 38.2% of its previous move, and then retraces 50% of that retracement, then the currency pair is likely to continue retracing to the 61.8% level. This is an example of transitive equivalence.
Equalizers are groundbreaking because they provide a powerful tool for analyzing and optimizing complex systems. They allow for the comparison of different securities, trading strategies, and portfolios, and can be used to ensure compliance with regulatory requirements. The use of equalizers in securities trading could change trading in the industry, allowing traders and investors to make more informed decisions and manage risk more effectively.
Simplest demonstration of this, for our article, will be an indicator that makes forecast. From our definition above we'll have not one but two morphisms from it. The first of these we can call our hypothesis and the second test-results. Let’s take our indicator as the ATR and the forecast to be price-range change. This means our domain A will be ATR values, (which we could normalize to be changes in ATR) while the codomain will be changes in price-bar high minus low.
The hypothesis, the first of the two morphs, simply maps indicator values to what they should be, according to theory and academic understanding of how the indicator works. In our case since we are using the ATR and we are looking to have it make forecasts to changes in range, our hypothesis could be along the lines of, ‘a negative change in ATR morphs to a negative change in bar range and conversely a positive change in ATR would morph to a positive change in price-range’. As you can see this is isomorphic.
The values of both ATR change and price-range change are typically in points and this means they need to be normalized. If we were to use percentages then it becomes easier to do the morphing since say a 20% drop in ATR can easily be morphed to a 20% fall in price-range. If for brevity we have these percentages based on last bar indicator values where:
![]()
![]()
with
Dv as domain values
An new ATR
Ao old ATR
Ao’ the maximum between the old ATR and a point*
Cv codomain values
Rn new price-range
Ro old price-range
Ro’ the maximum between the old price-range and a point*,
*maximum comparison simply avoids zero divide.
our formulae will be as indicated above. However even with that necessary step, we would still need to normalize the two domains further by having the percentages grouped in percentiles, or bands. So, for instance the table below shows a possible setup we will use in our case, in achieving this.
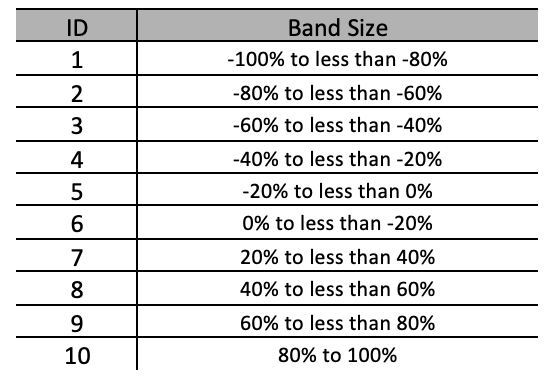
We’ll have 10 bands each approximately 20% wide. This now means we can with more clarity map elements of the domain to the codomain. So, for instance rather than trying to grapple with domain data that could say include values like 12.7%, 28.5%, -74.8% versus a codomain with similar floating-point data we now have discrete bands in either domain that can easily be paired.
So, to formalize the first morphism, the hypothesis changes in ATR are with some lag (one bar in our case) positively correlated to changes in price bar range. Since our two domain data points are normalized it simply means that our hypothesis morphism will be isomorphic as mentioned above. -100% to -80% in the domain will map to -100% to -80% in the codomain, likewise -80 to -60% will map to -80 to -60%, and so on.
For the second morphism, we will base the mapping on the sample count on a training data set. So, if we run tests from 01-01-2021 to 01-01-2022 on say, EURGBP and we come up with a cross table log of the number of times each band for ATR change has resulted in changes in each of the similar bands for price-range change. These tests are based on the 5-minute timeframe and the indicator lag for comparison is a single bar. This means any ATR indicator reading is compared to the next 5 minute-bar price-range changes.
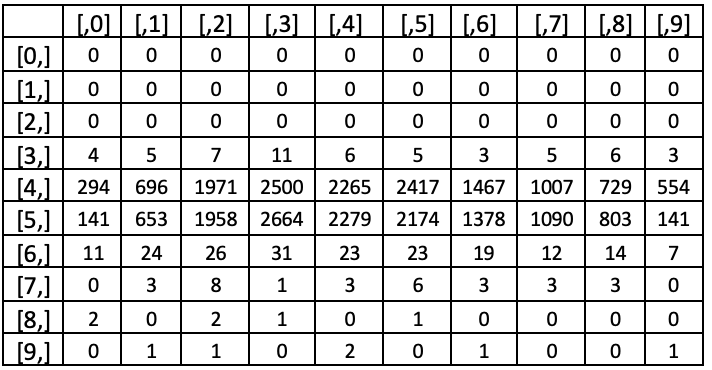
In our cross table above the column headers [,0],[,1], and so on represent the rows in our band size table above -100% to -80%, -80% to -60%, and so on respectively. The rows also follow a similar pairing. Looking at the test results, it is clear most ATR percentage changes are less than 20% in magnitude. This implies a more meaningful test run could provide more divisions (band sizes) in that range and fewer in ranges outside it. This therefore means the band sizes for a more 'evenly distributed' samples would not be of the same size. If we however stick with our selected band sizes, we'll determine the highest column value for each row (across all columns) and this would indicate it as the highest probability price-range change for the respective ATR change.
So those would be our two morphisms whose equivalence would best be described as symmetric.
The homomorphism print for the hypothesis would log as shown below:
2023.03.31 17:55:58.318        ct_5 (EURUSD.ln,M5) (-100% to -80%)|----->(-100% to -80%)

2023.03.31 17:55:58.318        ct_5 (EURUSD.ln,M5) (-80% to -60%)|----->(-80% to -60%)

2023.03.31 17:55:58.318        ct_5 (EURUSD.ln,M5) (-60% to -40%)|----->(-60% to -40%)

2023.03.31 17:55:58.318        ct_5 (EURUSD.ln,M5) (-40% to -20%)|----->(-40% to -20%)

2023.03.31 17:55:58.318        ct_5 (EURUSD.ln,M5) (-20% to 0%)|----->(-20% to 0%)

2023.03.31 17:55:58.318        ct_5 (EURUSD.ln,M5) (0% to 20%)|----->(0% to 20%)

2023.03.31 17:55:58.318        ct_5 (EURUSD.ln,M5) (20% to 40%)|----->(20% to 40%)

2023.03.31 17:55:58.318        ct_5 (EURUSD.ln,M5) (40% to 60%)|----->(40% to 60%)

2023.03.31 17:55:58.318        ct_5 (EURUSD.ln,M5) (60% to 80%)|----->(60% to 80%)

2023.03.31 17:55:58.318        ct_5 (EURUSD.ln,M5) (80% to 100%)|----->(80% to 100%)
While that for the test run would log this:
2023.03.31 17:55:58.318        ct_5 (EURUSD.ln,M5) (-100% to -80%)|----->(-100% to -80%)

2023.03.31 17:55:58.318        ct_5 (EURUSD.ln,M5) (-80% to -60%)|----->(-100% to -80%)

2023.03.31 17:55:58.318        ct_5 (EURUSD.ln,M5) (-60% to -40%)|----->(-100% to -80%)

2023.03.31 17:55:58.318        ct_5 (EURUSD.ln,M5) (-40% to -20%)|----->(-40% to -20%)

2023.03.31 17:55:58.318        ct_5 (EURUSD.ln,M5) (-20% to 0%)|----->(-40% to -20%)

2023.03.31 17:55:58.318        ct_5 (EURUSD.ln,M5) (0% to 20%)|----->(-40% to -20%)

2023.03.31 17:55:58.318        ct_5 (EURUSD.ln,M5) (20% to 40%)|----->(-40% to -20%)

2023.03.31 17:55:58.318        ct_5 (EURUSD.ln,M5) (40% to 60%)|----->(-60% to -40%)

2023.03.31 17:55:58.318        ct_5 (EURUSD.ln,M5) (60% to 80%)|----->(-100% to -80%)

2023.03.31 17:55:58.318        ct_5 (EURUSD.ln,M5) (80% to 100%)|----->(-20% to 0%)
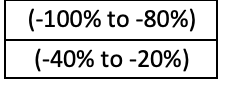
Now based on these two morphisms we can determine within the domain (percentage changes in ATR) which percentage bands are matched by both morphisms to the same percentage bands in the codomain (percentage changes in price-range change). This subset of the ATR changes, will be our equalizer for both the hypothesis morphism and the test-run morphism as per the definitions shared above. These bands are shown below.
The main application of the equalizer of these two morphisms, would be as in the previous article, via the universal property. The two morphisms so far are based on a hypothesis and historical data. They cannot be that reliable, per se, on forward looking data. So, before we can use our price-range forecasting system on live or forward data to make decisions, we need to define our anchor morphism, aka the universal-property, which by definition will be between any new data point and our equalizer. We can define this universal-property morphism as a simple inclusion check, or as a complex linear or even quadratic based relation.
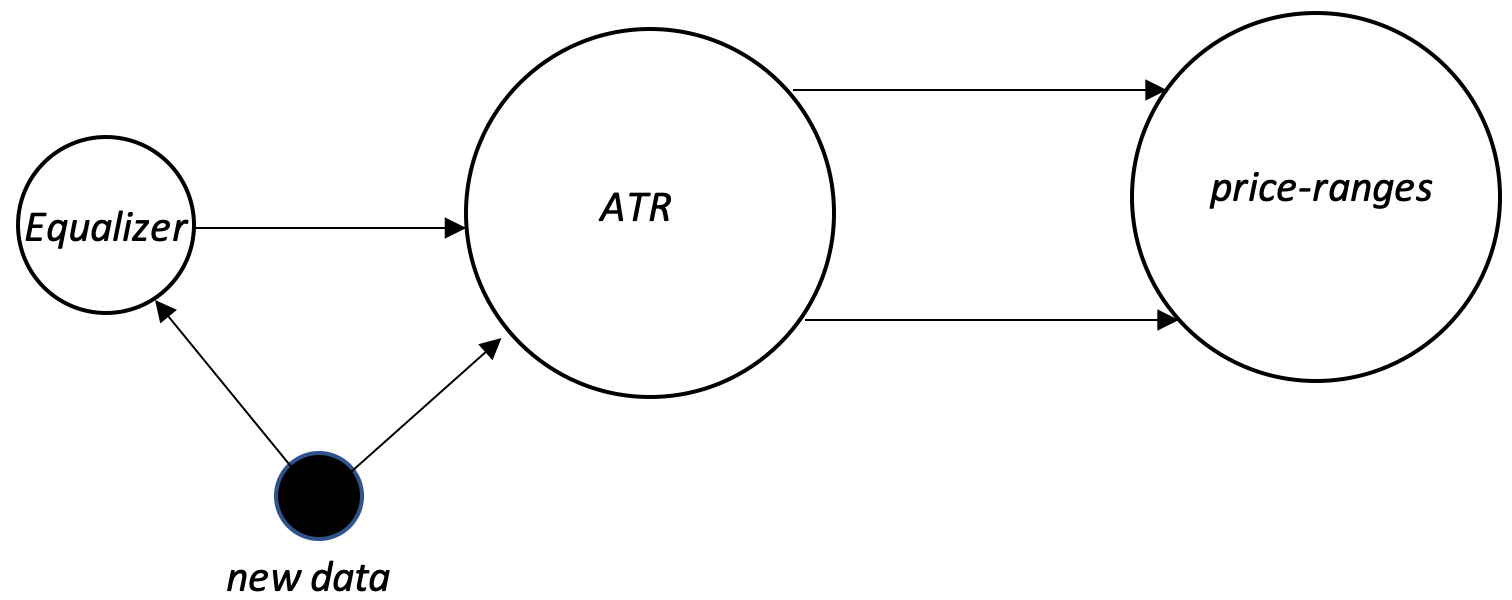
So if we are to consider the simple relation first, this is how our system would process new ATR percentage change data when making forecasts to changes in price-range change. For any new data point (ATR change) we would compare it to our equalizer domain and establish if it is a subset of that domain. If it is a subset then an isomorphic morphism between it and its equal in the equalizer is inferred by the universal-property rule. This equalizer is in turn a subset of our ATR change domain from which the two morphisms, hypothesis and test-results, originate to 'agree' in the price-bar change domain. With this we can easily read off what price-bar change is forecast by this new data point.
If our data point is not a subset of the equalizer it means it cannot be relied on to make a forecast in price-range change so we ‘do nothing’ and wait for the next indicator data point.
Alternatively we could have the test-results morphism and the universal-property morphism both take on a slightly more complex relation, like a quadratic function, that incorporates ATR changes and new-data as exponents respectively. Such changes are bound to guide towards more accurate forecasts but care should be exercised to avoid over-fitting and testing should be over extensive periods and preferably on your broker's real-tick data.
Conclusion
In conclusion, we have seen how equalizers in category theory can be used to estimate volatility changes based on the ATR indicator. Through the use of equalizers, we were able to compare and relate different morphisms, and develop a method for studying volatility trends over a sampled period.
By applying the universal property though, we were able to draw insights from our sample data and make estimates on volatility shifts, for out of sample data. This could lead to more informed trading decisions not just in exiting positions as demonstrated here, but on other aspects of trading systems in general.