Non-linear indicators
Aleksej Poljakov | 18 January, 2023
Introduction
Non-linear methods are widely used to handle financial time series. In particular, there are quite a few indicators in the MetaTrader trading platform that use non-linear approaches. All of them are actively used in trading.
Non-linear indicators may be needed when certain characteristics of a signal are more important than general information. In addition, non-linear indicators can cope with situations, in which linear indicators are powerless.
Creating a non-linear indicator is a relatively easy task. An ordinary linear indicator can be described by the following equation:
where w[i] are weight coefficients of the indicator. Now we will make this indicator non-linear. To do this, I will use price logarithms instead of the prices themselves. After calculating the sum, I will find its exponent:
This approach seems simple. However, the indicator calculations undergo significant changes. All multiplications are converted to exponentiation, while additions are replaced by multiplications. For example, the arithmetic mean (SMA) is replaced with the geometric mean.
In addition, the use of logarithms is a direct indication that positive numbers are used in the calculations. This price conversion can be used in any linear indicator. You can easily do it yourself. At the same time, all requirements for coefficients remain the same as for linear indicators. Let's take the indicator template from this article and convert it into the logarithmic version.
However, non-linear indicators can also be built using the transformation of the time series itself. In this article, I will consider such indicators. It can be said that the article is devoted to the ArraySort function. It will be the basis for new indicators.
Measures of central tendency
The central trend is some typical value for some data set. The most common measures of central tendency are the arithmetic mean, median and mode. The arithmetic mean is a linear measure and is implemented in a simple moving average. The median and mode are non-linear.
The median divides the dataset into two halves. The first half contains values less than the median, while the second half contains values greater than the median. Let's see how the median is calculated. Suppose that we have the following series of values: 1, 6, 9, 3, 3, 7, 8. Let's sort these numbers in ascending order: 1, 3, 3, 6, 7, 8, 9. Then the median will be the number in the center of this series. In our example, this number is 6. In the case of an even amount of data, the median is half the sum of the numbers closest to the center. For example, in case of the series 1, 3, 3, 6, 7, 8, the median is (3 + 6)/2 = 4.5. The main feature of the median is that it is very robust to spikes.
The mode is the value that occurs most frequently in the data sample. For example, in the sample 1, 6, 9, 3, 3, 7, 8, the most common number is 3. It will be the mode of the series. However, when analyzing prices, each value can occur only once. Then, in order to calculate the mode, we can use the Pearson empirical equation:
Mode = 3*Median – 2*Mean.
According to the equation, the mode is an unstable indicator (the coefficients go beyond the boundaries of the interval -1…+1). But it can be useful as an addition to other indicators.
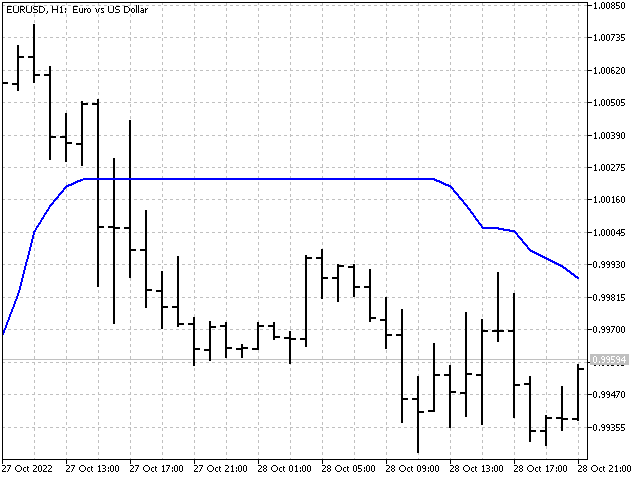
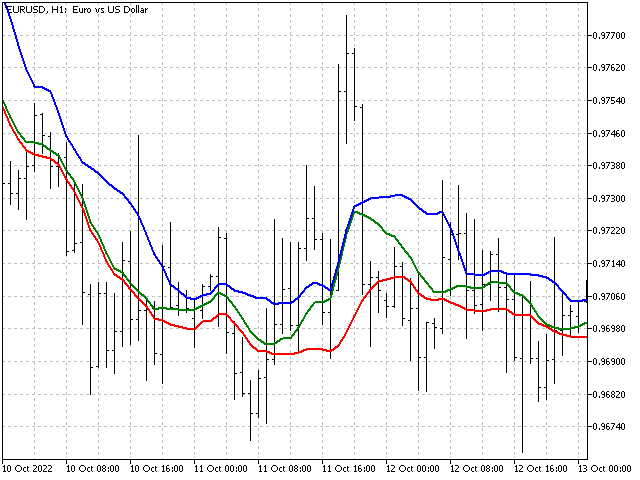
Another central measure can be considered the middle of the range. To calculate it, we need to find the half-sum of the maximum and minimum values of the time series. Although mid-range is sensitive to spikes and not very reliable, it is used in some indicators.
This is what all four measures of the central tendency look like on the chart.

Bayesian smoothing
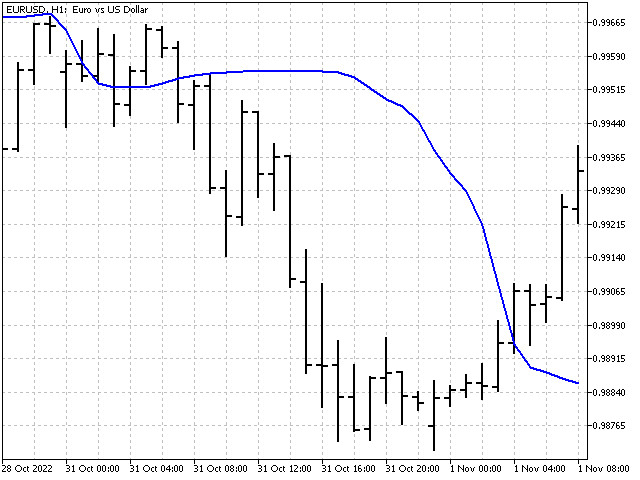
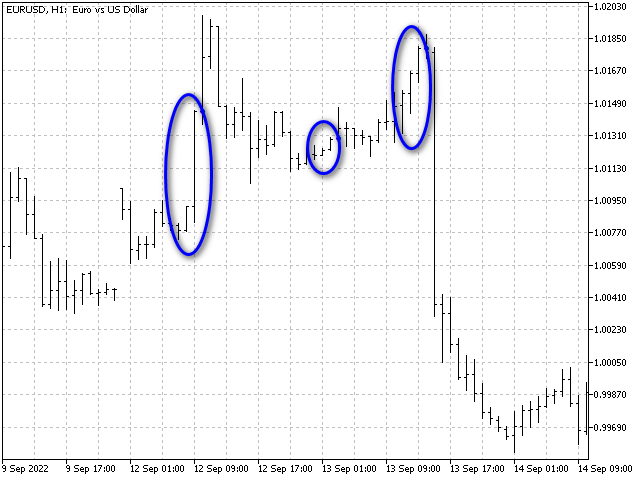
If we look at the median graph, we can find areas where the median does not change its value for quite a long time. The longer the period of the median, the more significant such areas. For example, this is how the graph of the median with the period of 51 looks like.
What if we try to make the median more sensitive to price changes? For example, we can take half the sum of the median and the simple average, and combine the stability of the median and the moving average. This option is possible. But I suggest going a little different way and using Bayesian smoothing.
First, we need to calculate the sum of all prices:
sum = price[1] + … + price[n].
Next, we need to select a value, relative to which the smoothing will occur. Then the Bayesian mean can be calculated using the following equation:
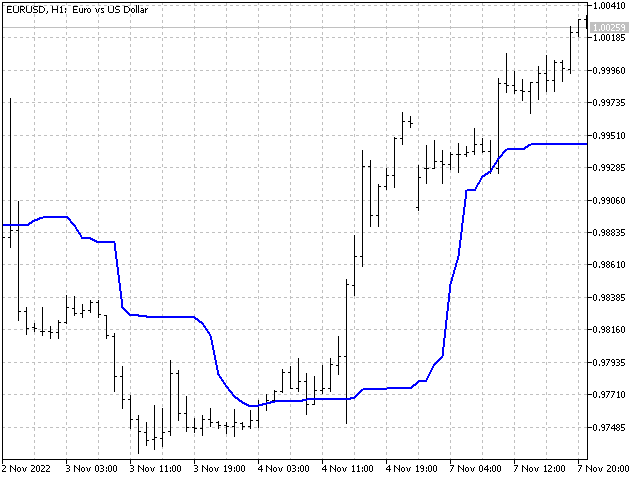
Here p is a parameter allowing us to set the strength of influence of the selected value. Its value should be at least one. For example, I have chosen the following values: median, middle of the range, maximum and minimum.
Bayesian smoothing can also be applied to multiple values. In that case, its equation will look like this:
In the indicator, this option is presented on the maximum and minimum values. Here's what they look like on the chart.
Applying the Bayesian smoothing shows how linear and non-linear methods can be combined in one indicator.
Median of medians
Let's remember how we can get a triangular window function. Take a simple moving average with a period of 3 as a basis. Now we need to find the values of three moving averages shifted by one bar:
Now all that remains is to find the average of these three values:
Now let's apply the same principle to the medians. First, find the values of three medians:
Then the indicator value will be equal to the median of these medians:
This is how it will look on the chart.
Pseudo median
The algorithm for calculating the pseudo median is a bit like the previous one. The only difference is that at each step we are looking not for the median of the subsequence, but for its maximum and minimum.
Now we need to take the minimum value from the found highs and the maximum value from the lows. Their mean will be the pseudo median.
The pseudo median can serve as a substitute for both the median and the middle of the range.
You cannot spoil the indicator by non-linearity
Trend strength. Let's take an indicator with a noticeable focus on trend, for example, a linear weighted average. The indicator values are calculated as follows (suppose that the indicator period is 5):
Next, we will take these prices and create two new sequences from them. In the first one (let's designate it as p[]), the prices are to be sorted in ascending order (lowest to highest). While for the second sequence (P[]), sort prices in descending order. Now let's apply LWMA weights to these sequences.
We have received two new values. They show what the value of the indicator would be if the prices formed strictly accurate up and down trends.
Now we can visually assess the strength of the trend - the closer the indicator comes to the lower or upper border, the stronger the bullish or bearish trend. In addition, the difference between the upper and lower lines can hint at the market volatility. The farther they are apart from each other, the higher the volatility.
Relative Strength Index. RSI was developed by J. Welles Wilder and was published in the Commodities magazine in June 1978. To calculate this indicator, two auxiliary variables U and D are used. They are needed to separate the price movement up and down.
After calculating the U and D values, exponential smoothing is applied to their values. In this case, the indicator value is:
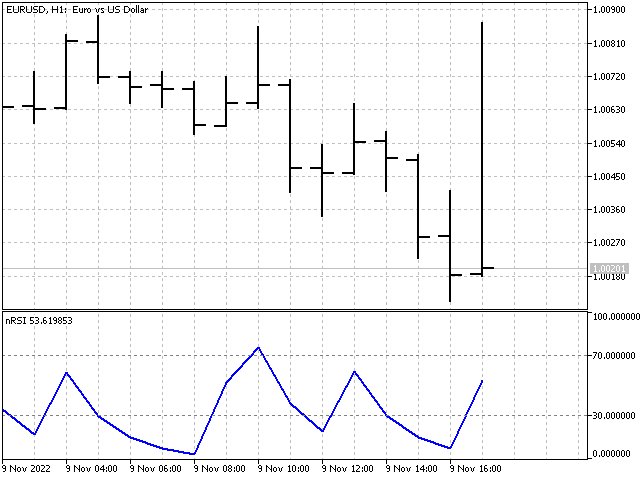
This is an excellent time proved indicator. It is already non-linear. Either the price difference or zero is sent to the indicator input. Let's try to change one non-linearity to another - instead of the difference in prices, we will use the probability of their occurrence. Intuition tells us that large deviations are less common than small ones. A small test shows that intuition does not deceive us.
Instead of the price difference, we will use the following value:
where n shows how many times this difference has occurred in history, while N stands for the total number of observations. In this case, the indicator equation will be as follows:
The indicator itself will look as follows.
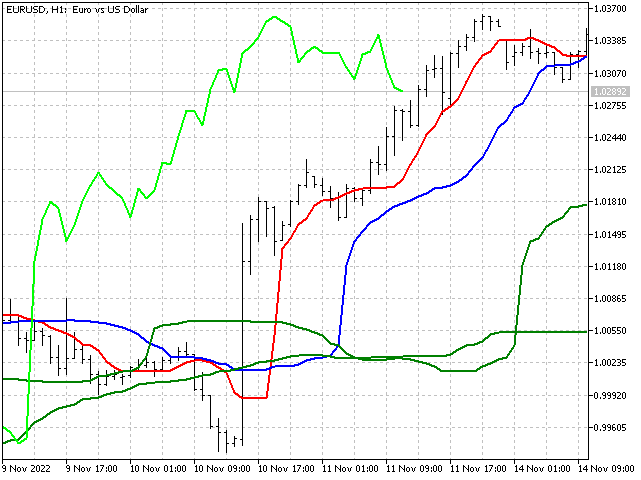
Ichimoku Kinko Hyo. This indicator was developed by Japanese analyst Goichi Hosoda. Ichimoku combines several approaches to market analysis. This indicator uses the middle of the ranges to plot the Tenkan, Kijun and Senkou B lines. Let's try to replace them with a more stable indicator - the median. We will calculate the Senkou A line using a weighted median. These replacements should not affect the essence of the indicator, while making it more stable. This is how the lines of the modified version of the Ichimoku indicator look like. You can paint the clouds youselves.
Candle patterns
There is one interesting direction in technical analysis, which is based on the study of the Japanese candlesticks and their combinations. Quite a lot of articles are devoted to it. For example, "Analyzing candlestick patterns".
I will go a slightly different way and use ordinal statistics to identify candlestick patterns. Let's see what our actions will look like in practice.
First of all, we need to set the order of prices that will be used for analysis. Then we will record the price values at the points we have chosen. After that, we will save the indices showing the price sequence order.
| Price | Value | Index |
|---|---|---|
| Open[0] | 1.03248 | 0 |
| Low[1] | 1.03133 | 1 |
| High[1] | 1.03204 | 2 |
| Open[1] | 1.03204 | 3 |
| Low[2] | 1.03191 | 4 |
| High[2] | 1.03256 | 5 |
| Open[2] | 1.03248 | 6 |
| Low[3] | 1.03217 | 7 |
| High[3] | 1.03296 | 8 |
| Open[3] | 1.03292 | 9 |
Now we need to sort the price values in ascending order.
| 1.03133 | 1 |
| 1.03191 | 4 |
| 1.03204 | 3 |
| 1.03204 | 2 |
| 1.03217 | 7 |
| 1.03248 | 6 |
| 1.03248 | 0 |
| 1.03256 | 5 |
| 1.03292 | 9 |
| 1.03296 | 8 |
Next, we need to resolve possible ambiguities when prices match. To do this, move the index with a smaller value closer to the beginning of the array. In our example, the (3, 2) and (6, 0) index pairs are swapped.
After that, analyze the index sequence. For the convenience of analysis, convert the indices into a single number - 8956073241. This number will be the final characteristic of the pattern. If you use more than ten values for analysis, then you need to use the appropriate base of the number system when assembling a single number.
In the code, the algorithm might look like this.
   int array[10][2];//array for writing values and indices

   /*fill the array*/
   array[0][0]=(int)MathRound(iOpen(_Symbol,PERIOD_CURRENT,1)/_Point);
   array[0][1]=0;
   for(int j=0; j<3; j++)
     {
      array[3*j+1][0]=(int)MathRound(iLow(_Symbol,PERIOD_CURRENT,j)/_Point);
      array[3*j+1][1]=3*j+1;
      array[3*j+2][0]=(int)MathRound(iHigh(_Symbol,PERIOD_CURRENT,j)/_Point);
      array[3*j+2][1]=3*j+2;
      array[3*j+3][0]=(int)MathRound(iOpen(_Symbol,PERIOD_CURRENT,j)/_Point);
      array[3*j+3][1]=3*j+3;
     }

   ArraySort(array);

   /*eliminate possible ambiguities when prices match*/
   for(int j=1; j<10; j++)
      if(array[j-1][0]==array[j][0] && array[j-1][1]>array[j][1])
        {
         int v=array[j-1][1];
         array[j-1][1]=array[j][1];
         array[j][1]=v;
         j=1;
        }

   /*gather the number*/
   ulong number=0;
   for(int j=0; j<10; j++)
      number=number+array[j][1]*(ulong)MathRound(MathPow(10,j));//10 - number system base
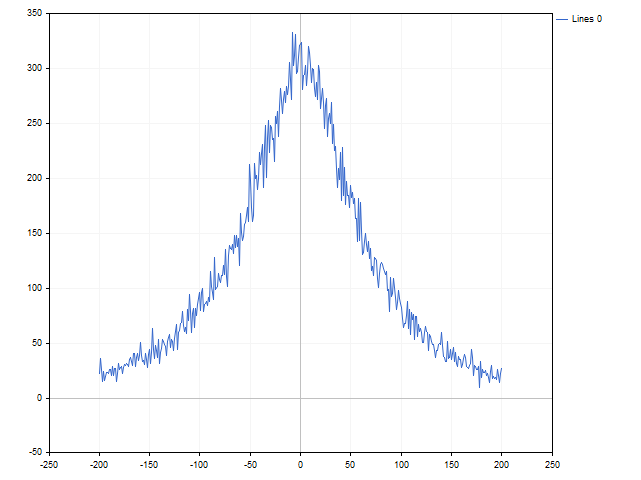
Using the script, we can estimate the number of patterns and how many times they occurred in history.
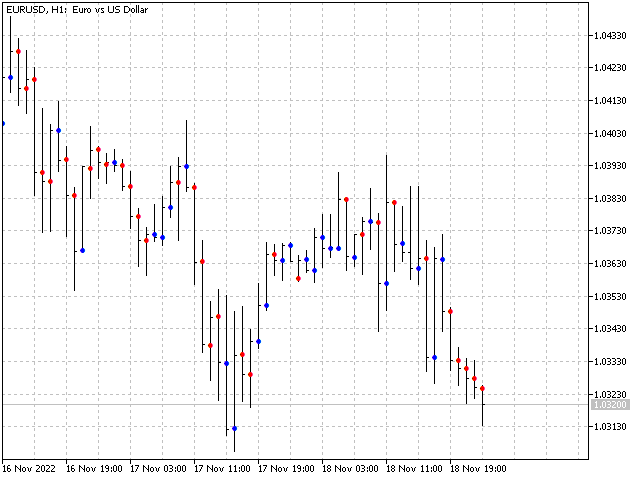
The only drawback of this algorithm is its insensitivity to scaling. If we stretch or squeeze the candles vertically, the pattern will not change. For example, these three situations were recognized as identical.
But this shortcoming will not prevent us from making an indicator based on this algorithm. Let the indicator be a bit predictive. For each pattern, we will accumulate the sums of high-open and open-low differences for the bar following this pattern. When the pattern appears again, the indicator will evaluate which amount is larger and make a forecast. As a result, we will get the following picture.
Along and across
The algorithm we have obtained above can also be used when creating trading systems. Let's look at two simple examples.
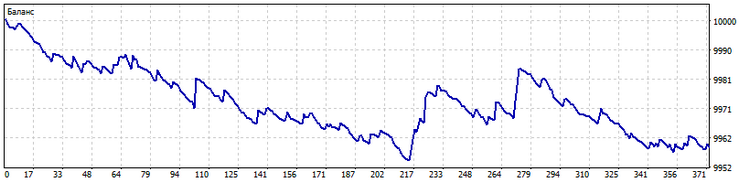
Along. Most often, trading system signals are based on the current values of indicators. What will happen if we use a certain number of its previous values to generate a signal to open a position? For example, we can take the last ten indicator values and apply the pattern building algorithm to them. Then the resulting pattern will indicate the change in the indicator values over time. For example, I used the last ten open prices to find the pattern. I also increased the forecast horizon to five bars ahead. This is how the trading of this EA looks like.
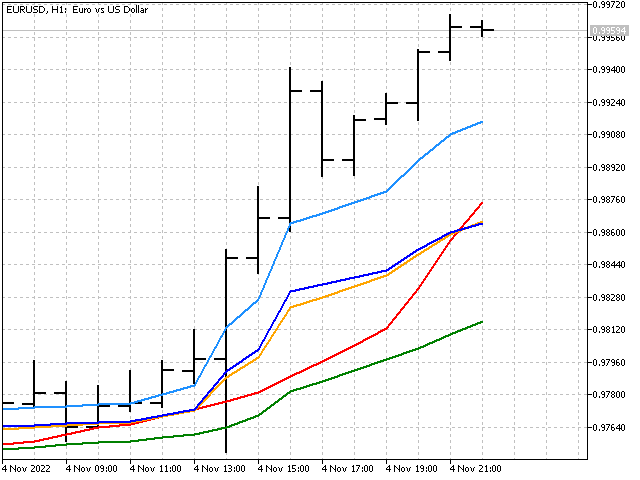
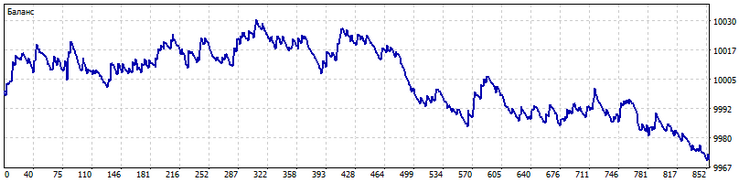
Across. The pattern calculation algorithm can also be used for a group of indicators. In this case, the pattern will indicate the order, in which the indicators are located relative to each other. This order will determine the signals of the trading system. As an example, I took ten moving averages with the periods of 2*n + 1 (n = 0…9). This is what trading looks like in this case.
In both cases, we need to control the number of patterns the algorithm recognizes. Their number should not be very small. Then the trading system may not distinguish different situations from each other. Also, the number of patterns cannot be large, otherwise too many trading situations will be recognized as unique, and the trading system will simply not respond to them. In addition, in the second case, it is necessary to use indicators that differ as much as possible from each other. For example, the use of only simple moving averages even with small differences in their periods is a clear mistake of the developer. But, we still praise him for his efforts.
Conclusion
Non-linear methods of processing market information can be used both in indicators and in trading strategies. They have been used before, so they can (and should) be used now. Non-linear indicators can help you take a fresh look at the price movement. The use of non-linear approaches in trading systems will help to get qualitatively different signals.
Programs used in the article.
| Name | Type | Brief description |
|---|---|---|
| Base LogIndicator | indicator | The indicator based on the logarithmic transformation of prices. InpCoefficient - indicator weights, you can enter any numbers. Their sum should not be equal to zero. |
| MMMM | indicator | The indicator showing central tendency measures. iMode - tendency selection. iPeriod - indicator period (not less than 2). |
| Bayesian Moving Average | indicator | Indicator that implements Bayesian smoothing. iMode - tendency selection for smoothing. iPeriod - indicator period. Parameter - smoothing parameter. |
| Median Median | indicator | The indicator that displays the median of medians. Non-linear analogue of the triangular window function. iPeriod - indicator period. |
| Pseudomedian | indicator | In some cases, a pseudo median can be a good replacement for the median and the middle of the range. iPeriod - indicator period. |
| Strength Trend | indicator | The indicator that shows how strong the trend component is in the price sample. iPeriod - indicator period. |
| nRSI | indicator | The indicator based on the probabilities of price increment. iMode - smoothing method selection. iPeriod - indicator period. |
| nIchimoku Kinko Hyo | indicator | Example of modernizing the conventional Ichimoku indicator. PeriodS, PeriodM, PeriodL - short, medium and long indicator periods. |
| Script Pattern | script | The script that collects statistics on price patterns. The final results are saved to a file in the Files folder. |
| Pattern | indicator | The indicator that calculates patterns. Based on historical data, it makes a forecast about the predominant price movement on the opening bar. Least - minimum number of pattern observations in history. The forecast will be displayed only for those patterns that have been observed Least times are more. |
| EA Along Across | EA | Trading EA using price patterns. Mode - pattern direction selection. Least - number of pattern observations in history. Percent - percentage of dominance of one direction of price movement over another affecting the number of opened positions. The value of this parameter should be selected within the range of 51 - 99. |