Learn how to design a trading system by VIDYA
Mohamed Abdelmaaboud | 31 August, 2022
Introduction
Here is a new article from our series which is for beginners to learn about a new technical tool and how to design a trading system based on simple strategies. It is the Variable Index Dynamic Average (VIDYA) indicator. This indicator is one of the trend-following indicators that can be used in our trading and the concept of this term means that this indicator follows the trend. So, it is a lagging indicator and it means that it moves after the price movement. We will cover this indicator through the following topics:
If you want to develop your programming skills, you can apply what you learn by yourself to deepen your understanding because practicing is a very important step in any learning process. We will use the MQL5 (MetaQuotes Language 5) which is built-in in the MetaTrader 5 trading terminal, if you do not know how you can download and use them, you can read the topic of Writing MQL5 code in MetaEditor from a previous article.
Disclaimer: All information provided 'as is' only for educational purposes and is not prepared for trading purposes or advice. The information does not guarantee any kind of result. If you choose to use these materials on any of your trading accounts, you will do that at your own risk and you will be the only responsible.
VIDYA definition
The Variable Index Dynamic Average (VIDYA) is a trend-following indicator developed by Tushar Chande. It looks like the exponential moving average but it will be dynamically adjusted based on relative price volatility. The volatility is measured by the Chande Momentum Oscillator (CMO) in this indicator by measuring the ratio between the sum of positive and negative movements the same as we will see when we will learn how to calculate it. (CMO) is used to smooth the exponential moving average. So, the same as what we will see we can find the settings of this indicator as parameters are the CMO period and the EMA period. It can be used the same as any moving average to get trend type if it is an uptrend or downtrend. if you want to learn more about the trend types and how you can identify them you can read the topic of trend definition from a previous article. Or you can use it to generate buying or selling signals and we will see through the topic of VIDYA strategy some simple strategies based on that.
Now, we need to learn how we can calculate the VIDYA indicator to understand more about the main concept behind it. The following steps are how to calculate it manually.
- Calculate the EMA:
EMA(i) = Price(i) * F + EMA(i-1)*(1-F)
Where:
EMA(i) = Current EMA
Price(i) = Current price
F (Smoothing factor) = 2/(EMA of period+1)
EMA(i-1) = Previous EMA value
- Calculate the Variable Index Dynamic Average (VIDYA) value:
VIDYA(i) = Price(i) * F * ABS(CMO(i)) + VIDYA(i-1) * (1 - F* ABS(CMO(i)))
Where:
VIDYA(i) = Current VIDYA
ABS(CMO(i)) = The absolute current value of Chande Momentum Oscillator
VIDYA(i-1) = Previous VIDYA value
- Calculate the Chande Momentum Oscillator (CMO):
CMO(i) = (UpSum(i) - DnSum(i))/(UpSum(i) + DnSum(i))
Where:
UpSum(i) = The current value of sum of positive movements during the period
DnSum(i) = The current value of sum of negative movements during the period
After that, we can get the VIDYA indicator. Nowadays, we do not need to calculate it manually but we can simply choose it to be inserted into the chart from the available indicators in the MetaTrader 5 trading platform. Here is how to insert it.
Insert --> Indicators --> Trend --> Variable Index Dynamic Average
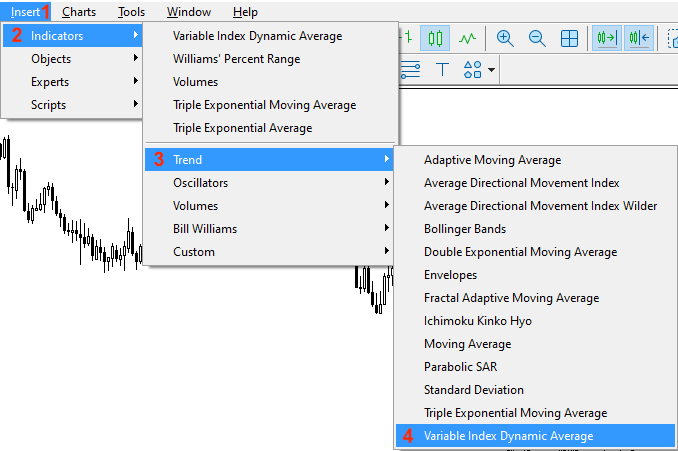
This will open the following window with the indicator parameters:
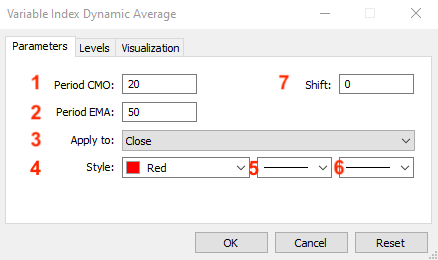
1 - the Chande Momentum Oscillator (CMO) period
2 - the period of the exponential moving average (EMA) period
3 - the price type
4 - the color of the VIDYA line
5 - the VIDYA line style
6 - the VIDYA line thickness
After determining all previous parameters and pressing "OK", we will find the indicator attached to the chart as follows:
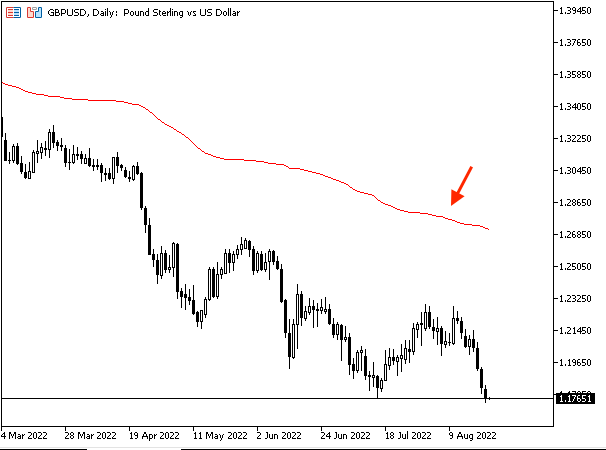
As we can see in the previous chart, the indicator is inserted into the chart and it is a line above or below prices based on its value and the price movements. When we see the VIDYA line above the price, it means that there is a bearish control and vice versa, when the VIDYA line is below the price, it means that there is a bullish control.
VIDYA strategy
In this topic, we will learn how to use the VIDYA indicator through simple strategies based on the main concept of this indicator. It is better to combine this indicator with other technical tools or indicators to get more reliable and effective results. Because it will give you more insights from many perspectives and this is one of the features of the technical analysis.
We need to get a signal with the trend type if it is up or down based on comparing the current close and the current VIDYA with its default settings (9,12). We need to set a signal with an uptrend if the current close is above the VIDYA. In the other case, we need to get a signal with a downtrend if the current close is below the VIDYA.
Current close > VIDYA --> uptrend
Current close < VIDYA --> downtrend
We need to get buy or sell signals based on comparing the same values of the previous strategy. We need to get a buy signal if the current close is above the VIDYA. Vice versa, if the current close is below the current VIDYA, we need to get a sell signal.
Current close > VIDYA --> Buy signal
Current close < VIDYA --> Sell signal
We need to get buy or sell signals based on comparing the VIDYA with its setting (9, 12) and the VIDYA with its setting (20, 50). We need to get a buy signal when the VIDYA (9, 12) becomes greater than the VIDYA (20, 50). In the other scenario, if the current VIDYA (9, 12) is lower than the current VIDYA (20, 50), it will be a sell signal.
VIDYA (9, 12) > VIDYA (20, 50) --> Buy signal
VIDYA (9, 12) < VIDYA (20, 50) --> Sell signal
Through the previous three simple strategies, we learned how to use the VIDYA indicator based on the main concept behind it.
VIDYA strategy blueprint
In this topic, we will design a step-by-step blueprint to help us to create our trading system for each mentioned strategy smoothly.
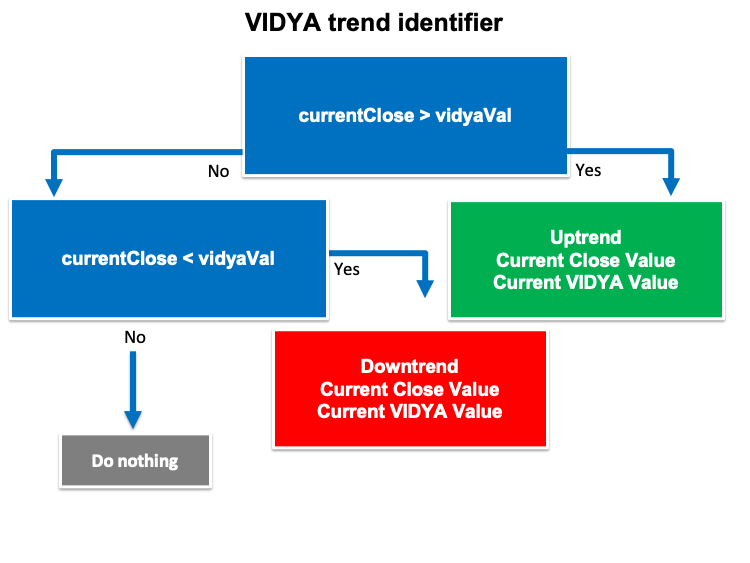
According to this strategy, we need to create a trading system that can be used to generate signals with trend type. We need the trading system to check two values which are current close and current VIDYA value to determine what is the trend type. If the current close value is greater than the VIDYA value, it will be a signal that the trend is up.
So, we need the trading system to return a comment on the chart with the following values:
- Uptrend
- Current close value
- Current VIDYA value
The other scenario, if the current close value is lower than the current VIDYA value, it will be a signal that the trend is down.
So, we need the trading system to return a comment on the chart with the following values:
- Downtrend
- Current close value
- Current VIDYA value
The following is the blueprint of this strategy:
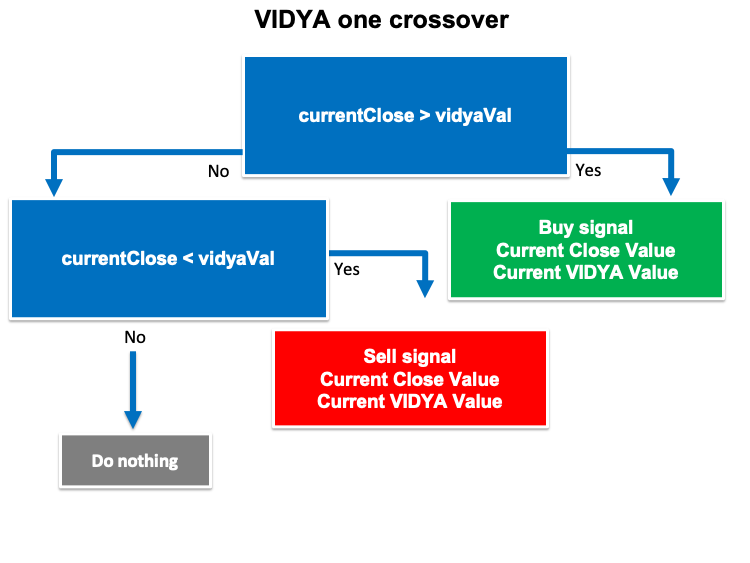
According to this strategy, We need to create a trading system that can be used to alert us if we have buy or sell signal. In this strategy we will use the same values of the VIDYA trend identifier but to get different signals. We need the trading system to check two values and they are the current close and the current VIDYA value, if the current close is greater than the VIDYA value, it will be a buy signal.
So, we need the trading system to return the following values:
- Buy signal
- Current close value
- Current VIDYA value
Vice versa, if the current close is lower than the VIDYA, it will be a sell signal.
So, we need the trading system to return a comment on the chart with the following values:
- Sell signal
- Current close value
- Current VIDYA value
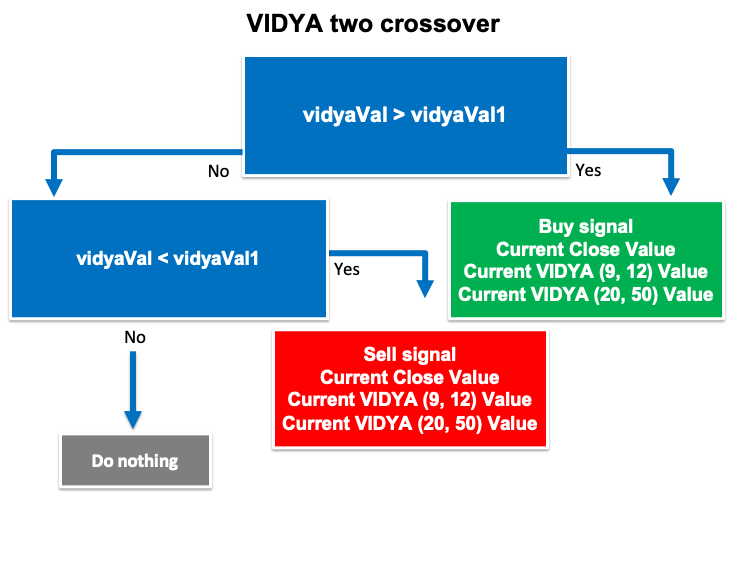
According to this strategy, we need to create a trading system that can be used to generate signals of buy and sell. We need to check two values and they are Current (9, 12) VIDYA and current VIDYA (20, 50) continuously. If the current (9, 12) value is greater than the current (20, 50), it will be a buy signal.
So, we need the trading system to return the following values:
- Buy signal
- Current close value
- Current VIDYA (9, 12) value
- Current VIDYA (20, 50) value
In the other scenario, if the current (9, 12) VIDYA value is lower than the current (20, 50) VIDYA value, it will be a sell signal.
So, we need the trading system to return the following values:
- Sell signal
- Current close value
- Current VIDYA (9, 12) value
- Current VIDYA (20, 50) value
The following is the blueprint of this strategy:
Now, we designed a simple step-by-step blueprint for each mentioned strategy to help to create our automated trading system and we are ready to go through the most interesting topic of VIDYA trading system to create a trading system for each strategy.
VIDYA trading system
This simple trading system will help us to see the current value of VIDYA indicator continuously because we will see this value as a comment on the chart.
The following steps are for how to create a trading system to do what we need.
We will create an array for the "vidyaArray" by using the double function which is one of the real types or floating-point types that represents value with a fractions.
double vidyaArray[]; We will sort the created "vidyaArray" array by using the "ArraySetAsSeries" function to return a boolean value.
ArraySetAsSeries(vidyaArray,true);
We will create an integer variable for "vidyaDef" to be equal to the definition of the VIDYA indicator by using the "iVIDyA" function to return the handle of the indicator.
Parameters are:
- symbol: we will use (_Symbol) to be applied to the current symbol
- period: we will use (_Period) to be applied to the current period or timeframe
- cmo_period: to determine the period of Chande Momentum, we will determine 9
- ema_period: to determine the exponential moving average smoothing period, we will determine 12
- ma_shift: to determine the horizontal shift on the chart if we need, we will determine 0
- applied_price: to determine the price type, we will use the closing price
int vidyaDef = iVIDyA(_Symbol,_Period,9,12,0,PRICE_CLOSE);
We will fill the created array by using the "CopyBuffer" function to get the data from the VIDYA indicator.
Parameters of this function:
- indicator_handle: to determine the indicator handle and we will use (vidyaDef)
- buffer_num: to determine the indicator buffer number and we will use (0)
- start_pos: to determine the start position and we will use (0)
- count: to determine the amount to copy and we will use (3)
- buffer[]: to determine the target array to copy and we will use (vidyaArray)
CopyBuffer(vidyaDef,0,0,3,vidyaArray);
We will get the "vidyaVal" after creating a variable by using the "NormalizeDouble" function to return the double type value.
Parameters of this function:
- value: we will use (vidyaArray[0]) as a normalized number
- digits: we will use (6) as a number of digits after the decimal point
double vidyaVal = NormalizeDouble(vidyaArray[0],6);
We will use a comment function to generate a comment on the chart with the current VIDYA value:
Comment("VIDYA Value is ",vidyaVal);
So, we can find the full code of this trading system the same as the following:
//+------------------------------------------------------------------+
//|                                                 Simple VIDYA.mq5 |
//|                                  Copyright 2022, MetaQuotes Ltd. |
//|                                             https://www.mql5.com |
//+------------------------------------------------------------------+
#property copyright "Copyright 2022, MetaQuotes Ltd."
#property link      "https://www.mql5.com"
#property version   "1.00"
//+------------------------------------------------------------------+
void OnTick()
  {
   double vidyaArray[];

   ArraySetAsSeries(vidyaArray,true);

   int vidyaDef = iVIDyA(_Symbol,_Period,9,12,0,PRICE_CLOSE);

   CopyBuffer(vidyaDef,0,0,3,vidyaArray);

   double vidyaVal = NormalizeDouble(vidyaArray[0],6);

   Comment("VIDYA Value is ",vidyaVal);

  }
//+------------------------------------------------------------------+
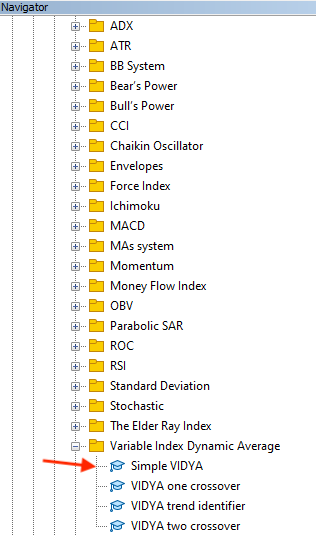
After compiling this code, we will find the expert of this trading system in the navigator the same as the following:
After dragging and dropping it on the chart, we will find the window of this trading system the same as the following:
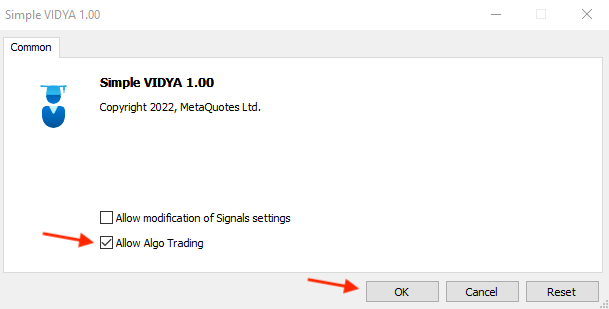
By pressing "OK", we will find the expert is attached the same as the following:
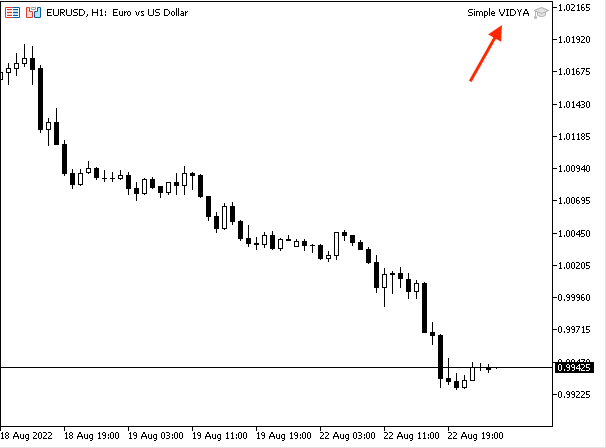
As we can see on the previous chart we have the expert attached the same as we can see in the top right corner. Then we can find the desired signal appears the same as the following:
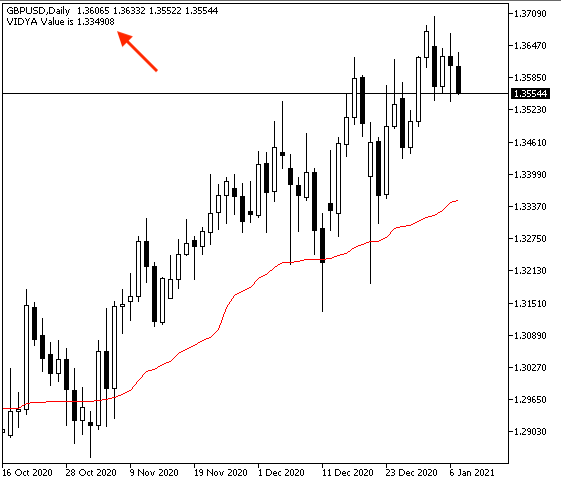
As we can see on the previous chart that we have the comment on the top left corner with the current VIDYA value. If we need to make sure that we have the same value as the value of the built-in VIDYA indicator, we can after attaching the expert we can insert the built-in indicator with the same settings as the expert the same as the following:
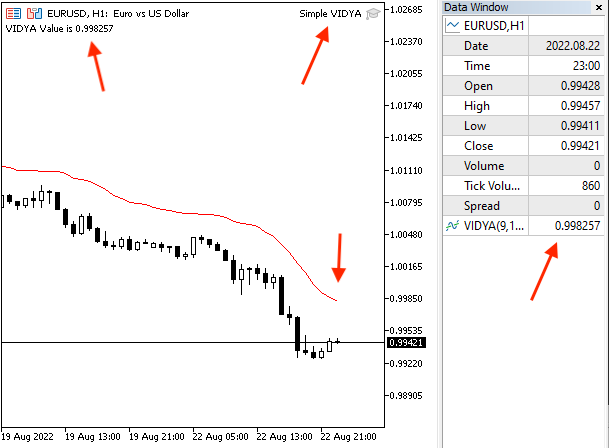
As we can see on the previous chart that we have the expert is attached to the chart as we can see on the top right corner and we have the current value of this expert on the top left corner on the chart and the built-in indicator is attached to the price chart and its value as we can see in right data window. Clearly, we can find both values are the same.
If we need to create a trading system for this strategy, we can find the following full code of this strategy:
//+------------------------------------------------------------------+
//|                                       VIDYA trend identifier.mq5 |
//|                                  Copyright 2022, MetaQuotes Ltd. |
//|                                             https://www.mql5.com |
//+------------------------------------------------------------------+
#property copyright "Copyright 2022, MetaQuotes Ltd."
#property link      "https://www.mql5.com"
#property version   "1.00"
//+------------------------------------------------------------------+
void OnTick()
  {
   MqlRates priceArray[];
   double vidyaArray[];

   int Data=CopyRates(_Symbol,_Period,0,3,priceArray);
   ArraySetAsSeries(vidyaArray,true);

   int vidyaDef = iVIDyA(_Symbol,_Period,9,12,0,PRICE_CLOSE);

   CopyBuffer(vidyaDef,0,0,3,vidyaArray);

   double currentClose=NormalizeDouble(priceArray[2].close,6);
   double vidyaVal = NormalizeDouble(vidyaArray[0],6);

   if(currentClose>vidyaVal)
     {
      Comment("Uptrend","\n",
              "Current Close Value is ",currentClose,"\n",
              "Current VIDYA Value is ",vidyaVal);
     }

   if(currentClose<vidyaVal)
     {
      Comment("Downtrend","\n",
              "Current Close Value is ",currentClose,"\n",
              "Current VIDYA Value is ",vidyaVal);
     }


  }
//+------------------------------------------------------------------+
Differences in this code:
Creating two arrays for prices by using the "MqlRates" function and for VIDYA by using the "double" as we mentioned before.
   MqlRates priceArray[];
   double vidyaArray[];
Sorting these created arrays, For the priceArray, we will use the "CopyRates" function to get historical data of "MqlRates". Its parameters are:
- symbol name: we will use (_Symbol)
- timeframe: we will use (_Period)
- start time: we will use (0)
- stop time: we will use (3)
- rates array: we will use (priceArray)
For the vidyaArray we will use using the "ArraySetAsSeries" function the same as we mentioned before.
   int Data=CopyRates(_Symbol,_Period,0,3,priceArray);
   ArraySetAsSeries(vidyaArray,true);
Defining the current price close and the current VIDYA values.
   double currentClose=NormalizeDouble(priceArray[2].close,6);
   double vidyaVal = NormalizeDouble(vidyaArray[0],6);
Conditions of this strategy:
1. In case of uptrend
   if(currentClose>vidyaVal)
     {
      Comment("Uptrend","\n",
              "Current Close Value is ",currentClose,"\n",
              "Current VIDYA Value is ",vidyaVal);
     }
2. In case of downtrend
   if(currentClose<vidyaVal)
     {
      Comment("Downtrend","\n",
              "Current Close Value is ",currentClose,"\n",
              "Current VIDYA Value is ",vidyaVal);
     }
After compiling this code and inserting it into the desired chart, it will be the same as the following:
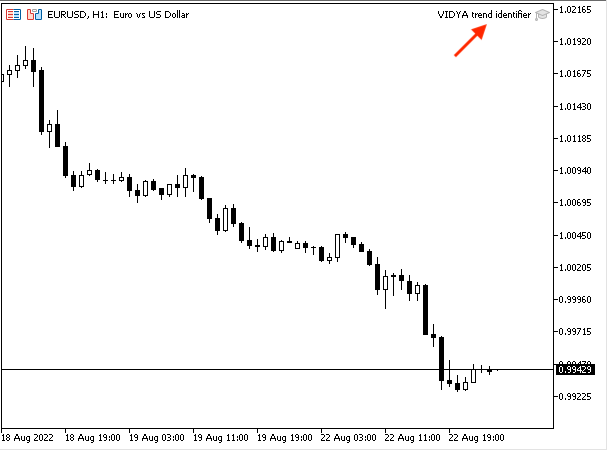
As we can see that the expert VIDYA trend identifier is attached as we can see on the top right corner of the previous chart. Now, we can start receiving signals from it. Some examples of these signals obtained during testing are shown below.
1. In case of uptrend
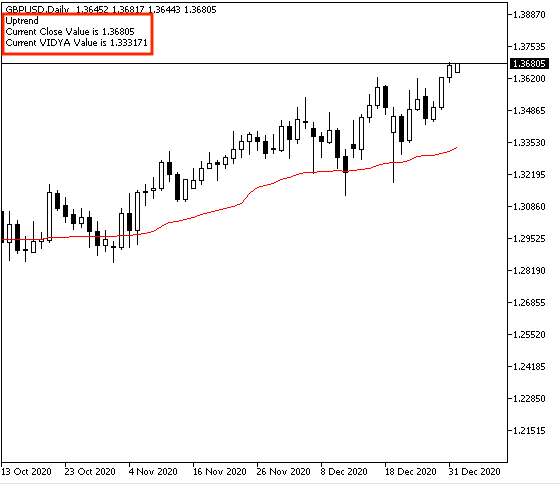
As we can see on the previous chart in the top left corner, we can find the following values:
- Uptrend
- Current close value
- Current VIDYA value
2. In case of downtrend
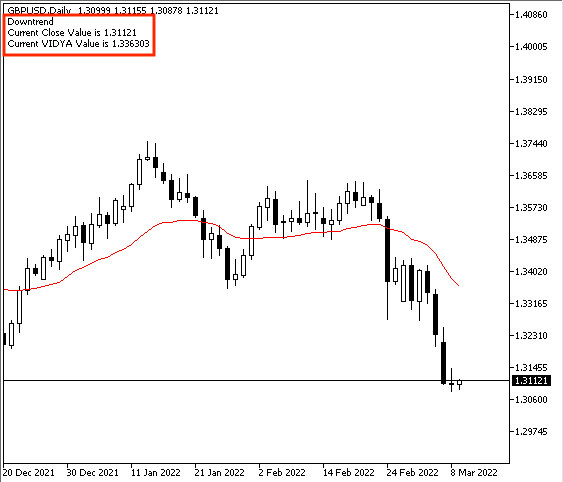
Based on the previous chart, we can find the following values:
- Downtrend
- Current close value
- Current VIDYA value
The following is for the full code to create a trading system for this strategy:
//+------------------------------------------------------------------+
//|                                          VIDYA one crossover.mq5 |
//|                                  Copyright 2022, MetaQuotes Ltd. |
//|                                             https://www.mql5.com |
//+------------------------------------------------------------------+
#property copyright "Copyright 2022, MetaQuotes Ltd."
#property link      "https://www.mql5.com"
#property version   "1.00"
//+------------------------------------------------------------------+
void OnTick()
  {
   MqlRates priceArray[];
   double vidyaArray[];

   int Data=CopyRates(_Symbol,_Period,0,3,priceArray);
   ArraySetAsSeries(vidyaArray,true);

   int vidyaDef = iVIDyA(_Symbol,_Period,9,12,0,PRICE_CLOSE);

   CopyBuffer(vidyaDef,0,0,3,vidyaArray);

   double currentClose=NormalizeDouble(priceArray[2].close,6);
   double vidyaVal = NormalizeDouble(vidyaArray[0],6);

   if(currentClose>vidyaVal)
     {
      Comment("Buy signal","\n",
              "Current Close Value is ",currentClose,"\n",
              "Current VIDYA Value is ",vidyaVal);
     }

   if(currentClose<vidyaVal)
     {
      Comment("Sell signal","\n",
              "Current Close Value is ",currentClose,"\n",
              "Current VIDYA Value is ",vidyaVal);
     }


  }
//+------------------------------------------------------------------+
Differences in this code:
Comment based on this strategy.
1. In case of buy signal
   if(currentClose>vidyaVal)
     {
      Comment("Buy signal","\n",
              "Current Close Value is ",currentClose,"\n",
              "Current VIDYA Value is ",vidyaVal);
     }
2. In case of sell signal
   if(currentClose<vidyaVal)
     {
      Comment("Sell signal","\n",
              "Current Close Value is ",currentClose,"\n",
              "Current VIDYA Value is ",vidyaVal);
     }
After compiling this code and inserting it into the desired chart as follows:
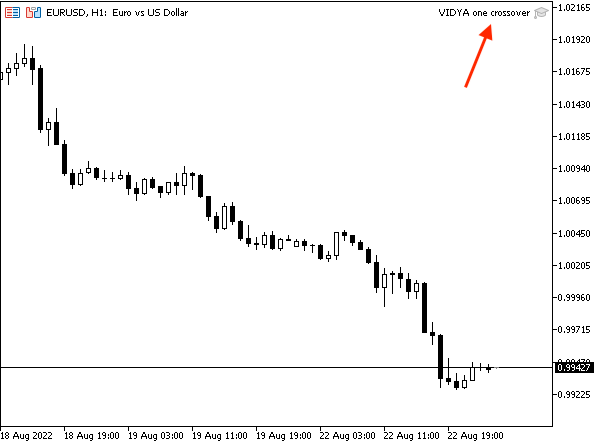
As we can see on the previous chart in the top right corner the expert is attached to the chart. After that, we will get signals of buy and sell based on this strategy. Examples from the system testing are shown below.
1. In case of buy signal
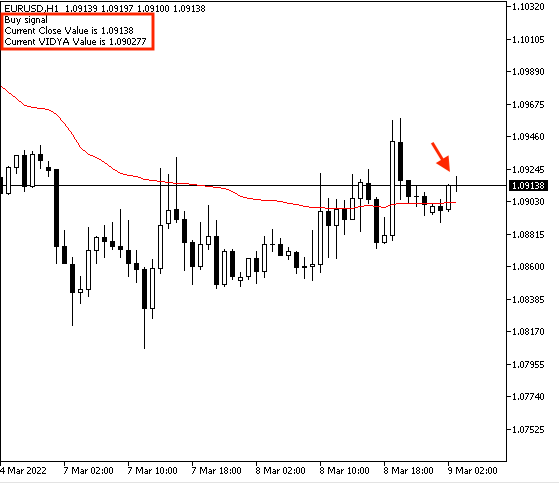
As we can see on the previous chart in the top left corner, we can find the following values based on the VIDYA one crossover:
- Buy signal
- Current close value
- Current VIDYA value
2. In case of sell signal
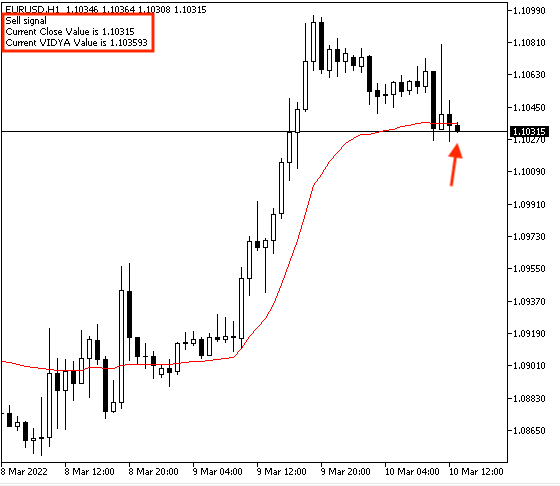
As we can see on the previous chart in the top left corner, we can find the following values:
- Sell signal
- Current close value
- Current VIDYA value
The following is the full code of this VIDYA two crossover strategy to create a trading system for it.
//+------------------------------------------------------------------+
//|                                          VIDYA two crossover.mq5 |
//|                                  Copyright 2022, MetaQuotes Ltd. |
//|                                             https://www.mql5.com |
//+------------------------------------------------------------------+
#property copyright "Copyright 2022, MetaQuotes Ltd."
#property link      "https://www.mql5.com"
#property version   "1.00"
//+------------------------------------------------------------------+
void OnTick()
  {
   MqlRates priceArray[];
   double vidyaArray[];
   double vidyaArray1[];

   int Data=CopyRates(_Symbol,_Period,0,3,priceArray);
   ArraySetAsSeries(vidyaArray,true);
   ArraySetAsSeries(vidyaArray1,true);

   int vidyaDef = iVIDyA(_Symbol,_Period,9,12,0,PRICE_CLOSE);
   int vidyaDef1 = iVIDyA(_Symbol,_Period,20,50,0,PRICE_CLOSE);

   CopyBuffer(vidyaDef,0,0,3,vidyaArray);
   CopyBuffer(vidyaDef1,0,0,3,vidyaArray1);

   double currentClose=NormalizeDouble(priceArray[2].close,6);
   double vidyaVal = NormalizeDouble(vidyaArray[0],6);
   double vidyaVal1 = NormalizeDouble(vidyaArray1[0],6);

   if(vidyaVal>vidyaVal1)
     {
      Comment("Buy signal","\n",
              "Current Close Value is ",currentClose,"\n",
              "Current VIDYA (9,12) Value is ",vidyaVal,"\n",
              "Current VIDYA (20,50) Value is ",vidyaVal1);
     }

   if(vidyaVal<vidyaVal1)
     {
      Comment("Sell signal","\n",
              "Current Close Value is ",currentClose,"\n",
              "Current VIDYA (9,12) Value is ",vidyaVal,"\n",
              "Current VIDYA (20,50) Value is ",vidyaVal1);
     }


  }
//+------------------------------------------------------------------+
Differences in this code:
Creating three arrays for price, vidyaArray, vidyaArray1
   MqlRates priceArray[];
   double vidyaArray[];
   double vidyaArray1[];
Sorting these created arrays
   int Data=CopyRates(_Symbol,_Period,0,3,priceArray);
   ArraySetAsSeries(vidyaArray,true);
   ArraySetAsSeries(vidyaArray1,true);
Defining "vidyaDef" and "vidyaDef1"
   int vidyaDef = iVIDyA(_Symbol,_Period,9,12,0,PRICE_CLOSE);
   int vidyaDef1 = iVIDyA(_Symbol,_Period,20,50,0,PRICE_CLOSE);
Filling arrays of "vidyaArray" and " vidyaArray1"
   CopyBuffer(vidyaDef,0,0,3,vidyaArray);
   CopyBuffer(vidyaDef1,0,0,3,vidyaArray1);
Defining values of currentClose, "vidyaVal", and "vidyaVal1"
   double currentClose=NormalizeDouble(priceArray[2].close,6);
   double vidyaVal = NormalizeDouble(vidyaArray[0],6);
   double vidyaVal1 = NormalizeDouble(vidyaArray1[0],6);
Conditions of signals based on this strategy:
1. In case of buy signal
   if(vidyaVal>vidyaVal1)
     {
      Comment("Buy signal","\n",
              "Current Close Value is ",currentClose,"\n",
              "Current VIDYA (9,12) Value is ",vidyaVal,"\n",
              "Current VIDYA (20,50) Value is ",vidyaVal1);
     }
2. In case of sell signal
   if(vidyaVal<vidyaVal1)
     {
      Comment("Sell signal","\n",
              "Current Close Value is ",currentClose,"\n",
              "Current VIDYA (9,12) Value is ",vidyaVal,"\n",
              "Current VIDYA (20,50) Value is ",vidyaVal1);
     }
After compiling this code and inserting it into the desired chart, it will be the same as the following:
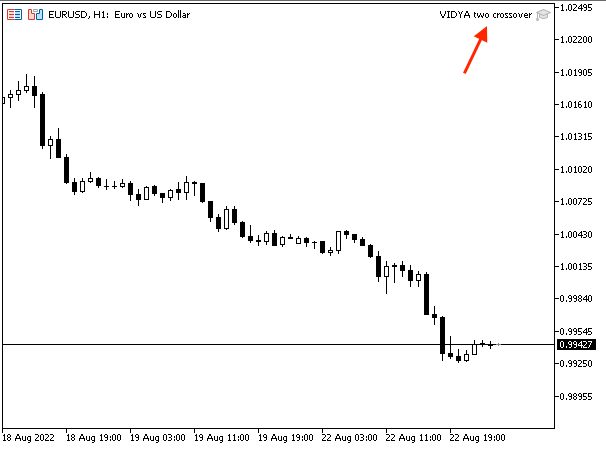
As we can see on the previous chart in the top right corner we have the expert attached to the chart. Now, we can see buy and sell signals based on this strategy. Some examples from the system testing are shown below.
In case of buy signal:
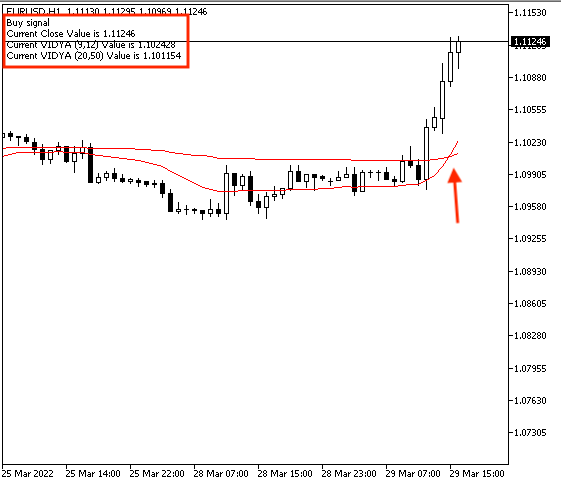
As we can see on the previous chart in the top left corner we have the following values after the crossover:
- Buy signal
- Current close value
- Current (9,12) VIDYA value
- Current (20,50) VIDYA value
In case of sell signal:
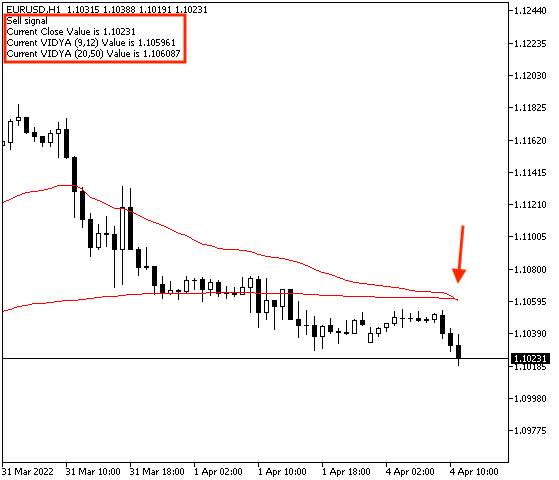
In the other scenario, as we can see on the previous chart in the top left corner we have the following values after the crossover:
- Sell signal
- Current close value
- Current (9,12) VIDYA value
- Current (20,50) VIDYA value
Conclusion
Now and after all the mentioned topics, it will be considered that you know now, what is the Variable Index Dynamic Average (VIDYA) in detail as we covered more topics through this article which are able to clarify that. We identified what is the Variable Index Dynamic Average (VIDYA) indicator, what it measures, how we can calculate it manually to understand the main concept behind it, and how we insert it into the chart and read it. We learned all of that through the topic of VIDYA definition. Then, we learned how we can use it through simple strategies based on the main concept behind the indicator as we learned the following strategies through the topic of VIDYA strategy:
- VIDYA trend identifier strategy: to get signals with the trend type if there is an uptrend or a downtrend.
- VIDYA One crossover strategy: to get signals of buying or selling signals based on the crossover between prices and the VIDYA line.
- VIDYA two crossover strategy: to get signals of buy or sell signals based on the crossover between VIDYA with settings of (9,12) and VIDYA with settings (20, 50).
I hope that you tried to write codes for the designed trading system by yourself to develop your programming skills as a beginner as this practicing is a very important step that you need to deepen your understanding and improve your skills not only in programming but in any learning process for any topic. I will not forget again to confirm that you must test any strategy before using it on your real account with real money as the main concept of this article is for educational purposes only and you may find that you need to optimize or change them or you can find that they are not suitable for your trading style as there is no suitable strategy for everyone.
I hope that you found this article useful for you and gave you good insights into the topic of the article or any related topic. If you like to read more similar articles to learn about the most popular technical indicator, how to use them, and how to design a trading system for them, you can read my previous articles in this series for beginners to learn more about them as you can find articles about designing a trading system by RSI, MACD, Stochastic, Moving Averages, Bollinger bands, Envelopes...and others after learning and understanding in more details about these technical indicators.