Learn how to design a trading system by Standard Deviation
Mohamed Abdelmaaboud | 18 July, 2022
Introduction
Welcome to a new article in our series in which we learn through this series how we can create a trading system by the most popular technical indicators. We will learn in this new article a new tool in detail that can be used to enhance our trading and we will learn how to create a trading system based on the basic concept behind it. This new indicator is the Standard Deviation indicator. We will cover this indicator in detail through the following topics:
- Standard Deviation definition
- Standard Deviation strategy
- Standard Deviation strategy blueprint
- Standard Deviation trading system
- Conclusion
Through the Standard Deviation definition topic, we will learn in more detail what is Standard Deviation, what it measures, and how we can calculate it manually to learn the basic concept behind it, then we will apply that to an example to calculate the standard deviation value. We will move after that to the next topic which is the Standard deviation strategy to learn how we can use the Standard Deviation indicator through simple strategies based on the basic concept of the indicator. Then, we will move to the next topic which is the Standard Deviation strategy blueprint to design a blueprint to help us to create a trading system for each strategy as this blueprint will be a step-by-step blueprint to organize ideas to create this trading system smoothly. After that, we will move to the most interesting topic in this article which is the Standard Deviation trading system to create a trading system for each mentioned strategy to be used in the MetaTrader 5 to generate signals automatically.
We will use MetaTrader 5 and MetaEditor to write MQL5 (MetaQuates Language) codes to create our trading system, if you do not know how you can download and use MetaEditor, you can read the Writing MQL5 code in MetaEditor topic from a previous article to learn more about that.
I advise you to apply what you learn by yourself to deepen your understanding and get more insights about the topic or any related topics to get the most benefit from the article information. In addition to that, you have to test any strategy by yourself before using it on your real account to make sure that it will be useful for you as there is nothing suitable for every person.
Disclaimer: All information provided 'as is' only for educational purposes and is not prepared for trading purposes or advice. The information does not guarantee any kind of result. If you choose to use these materials on any of your trading accounts, you will do that at your own risk and you will be the only responsible.
Let us start our topics to learn our new tool.
Standard Deviation definition
In this topic, we will learn what is the Standard Deviation indicator in more detail by defining it, learning what it measures, and how we can calculate it manually to learn the basic concept behind it. Then, we will apply this calculation to an example.
Standard Deviation is a term in statistics. this statistical term measures the dispersion around the mean or the average. But what is dispersion, Simply, it is the difference between any actual value and the mean or the average. the higher dispersion, the higher the Standard Deviation. The lower dispersion, the lower the Standard Deviation. The Standard deviation indicator measures the volatility.
Now, we need to learn how we can calculate the Standard Deviation. We can do that easily through the following steps:
1- Calculate the average or the mean of the desired period.
2- Calculate the deviation by subtracting each closing price from its average.
3- Square each calculated deviation.
4- Sum the squared deviation then divide it by the observation number.
5- Calculate the Standard deviation which is equal to the square root of the result of step four.
The following is an example to apply this calculation to deepen our understanding. If we have the following data of an instrument.
| # | Closing price |
|---|---|
| 1 | 1.05535 |
| 2 | 1.05829 |
| 3 | 1.0518 |
| 4 | 1.04411 |
| 5 | 1.04827 |
| 6 | 1.04261 |
| 7 | 1.04221 |
| 8 | 1.02656 |
| 9 | 1.01810 |
| 10 | 1.01587 |
| 11 | 1.01831 |
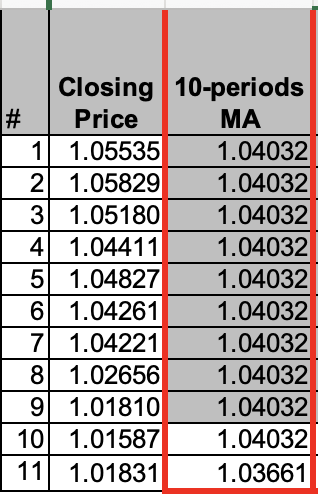
Step one: we will calculate the 10-period moving average, and we will consider that all MA till the tenth one is the same moving average. So, the following is the result after calculating that.
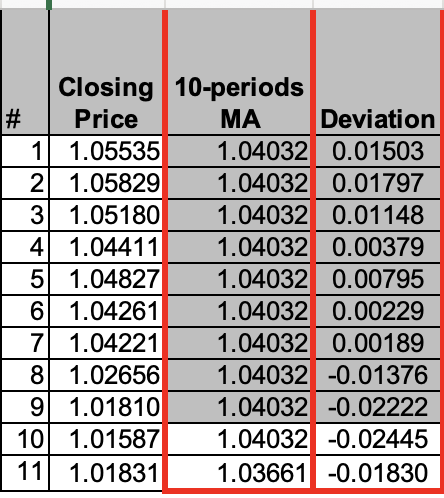
Step two: Calculate the deviation. The following is for the result after calculation.
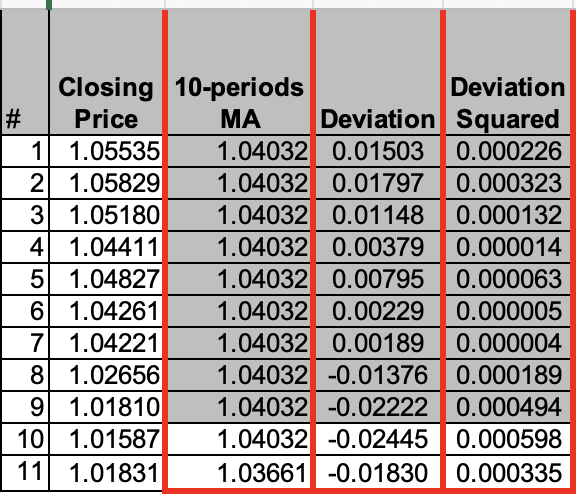
Step three: Calculate Deviation squared.
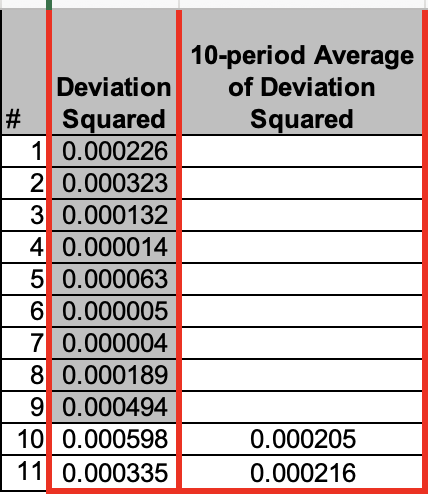
Step four: Calculate 10-period average of deviation squared.
Step five: Calculate the Standard deviation = Square root of result of step four.
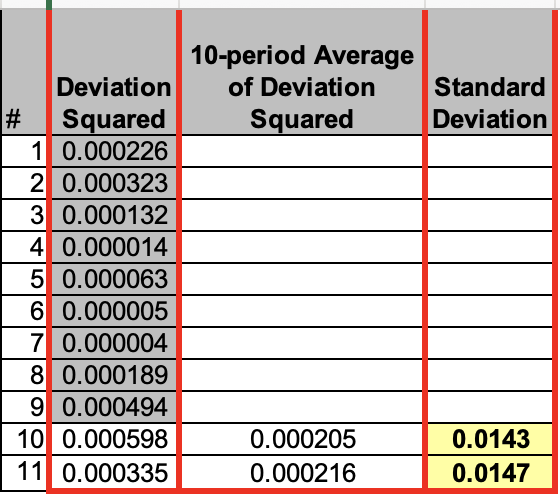
By the previous steps the same as we can find, we calculated the Standard Deviation value. Nowadays, we are very lucky as we do not need to calculate it manually as it is a built-in indicator in the MetaTrader 5 trading platform. All we need to do is to select it from the available indicators in the trading platform. The following is for how can do that.
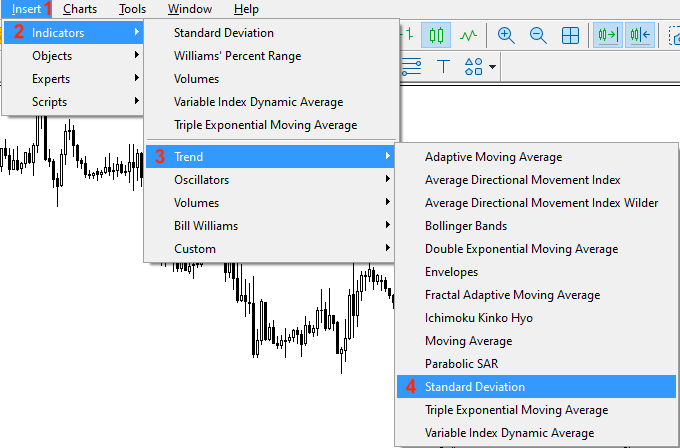
While opening the MetaTrader 5 trading platform we will press Insert tab --> Indicators --> Trend --> Standard Deviation.
After that, we will find the following window for the indicator's parameters.
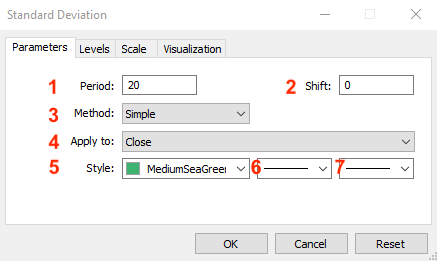
1- To determine the period that we will use.
2- To determine the amount of horizontal shift for the indicator's line if we want to do that.
3- To select the type of moving average.
4- To select the types of price that we will use in calculation.
5- To determine the color of the indicator's line.
6- To determine the style of line.
7- To determine the thickness of line.
After determining the desired parameters, we can find the indicator inserted on the chart the same as the following.
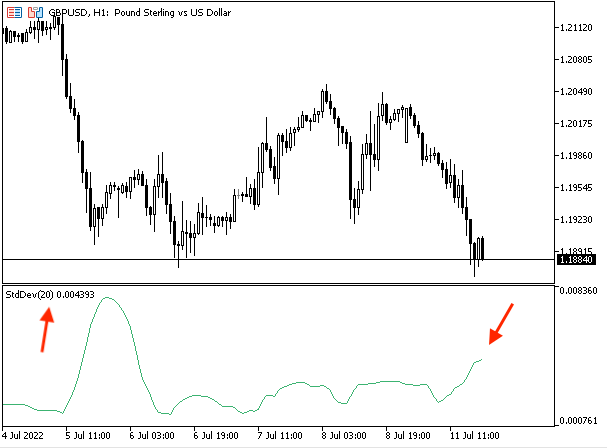
As we can see in the previous picture, the Standard Deviation is inserted and we can find it in the lower window as an oscillation line based on the Standard Deviation value.
Through this topic, we learn in more detail about the Standard Deviation indicator as we learned what is it, what it measures, and how we can calculate it manually to understand the basic concept behind it and apply this calculation to an example.
Standard Deviation strategy
In this topic and after learning about the Standard Deviation indicator in detail and learning its main concept, we will learn how to use this Standard Deviation indicator based on the basic concept behind it. We will learn how to use the Standard Deviation indicator through three simple strategies. The first one, Simple Std Dev - Volatility, will be used to know if there is volatility or not. For the second one, Simple Std Dev - Std and MA, we will use it accompanied by the moving average to get buy or sell signals. The third one, Simple Std Dev - Std, AVG, and MA, will be used accompanied by the moving average after seeing high volatility to get buy or sell signals.
- Strategy one: Simple Std Dev - Volatility:
Based on this strategy, we need to measure the volatility based on the comparison between the current Std Dev and the average of the five previous Std values. If the current Std Dev is greater than the Std Dev 5-periods average, this will be a high volatility signal. If the current Std is lower than the Std Dev 5- period average, this will be low volatility.
Current Std > Std AVG --> high volatility
Current Std < Std AVG --> low volatility
- Strategy two: Simple Std Dev - Std and MA:
Based on this strategy, we need to get buy and sell signals based on specific conditions. If the current Std Dev is greater than the previous Std Dev and the Ask value is greater than the moving average, this will be a buy signal. If the current Std Dev is greater than the previous Std Dev and the Bid value is lower than the moving average, this will be a sell signal.
Current Std > Prev. Std and Ask > MA --> Buy signal
Current Std > Prev. Std and Bid < MA --> Sell signal
- Strategy three: Simple Std Dev - Std, Std AVG, and MA:
Based on this strategy, we need to get buy and sell signals based on other conditions. If the current Std Dev is greater than Std Dev Avg and Ask is greater than the moving average, this will be a buy signal. If the current Std Dev is greater than Std Dev Avg and Bid is lower than the moving average, this will be a sell signal.
Current Std > Std Avg and Ask > MA --> Buy signal
Current Std > Std Avg and Bid < Ma --> Sell signal
Through the previous strategy, we learned how to use the Standard Deviation indicator through three simple strategies to measure the volatility and to get buy and sell signals based on two different sets of conditions. You can also, try to merge other technical indicators to get more insights into more than one perspective of the financial instrument based on your trading plan and strategy.
Standard Deviation strategy blueprint
In this topic, we will learn how to design a step-by-step blueprint for each strategy to help us to create a trading system based on each mentioned strategy. In my opinion, this step is very important as it will help us to organize our ideas in a way that helps us to create our trading system smoothly and easily. So, now I will present a blueprint that can be helpful to inform the computer what we need to do exactly.
- Strategy one: Simple Std Dev - Volatility:
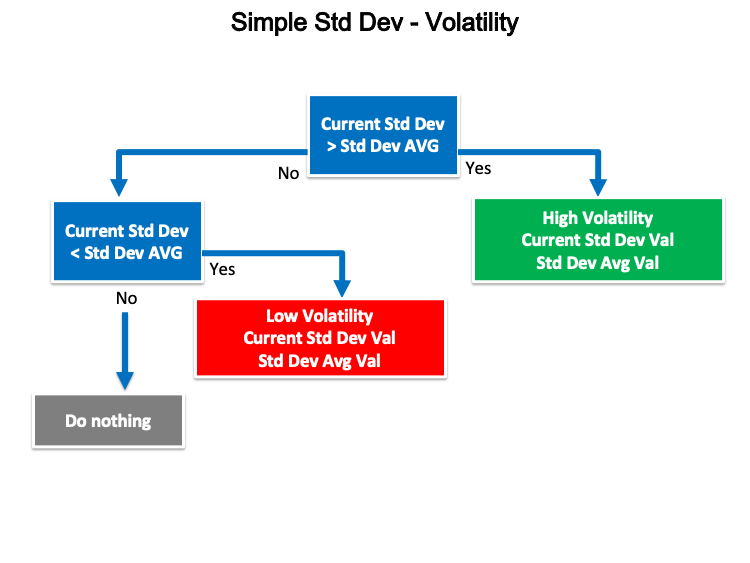
According to this strategy, we need the trading system to check two values and perform a comparison between them continuously. These two values are the current Std Dev and Std Dev Average of the previous five values. After that, we need the trading system to decide which one is bigger than the other. If the current Std Dev is greater than the average, we need to see a comment on the chart with,
- High Volatility.
- Current Std Dev value.
- Std Dev 5-period average value.
If the current Std Dev is lower than the average, we need to see a comment on the chart with,
- Low Volatility.
- Current Std Dev value.
- Std Dev 5-period average value.
- Strategy two: Simple Std Dev - Std and MA:
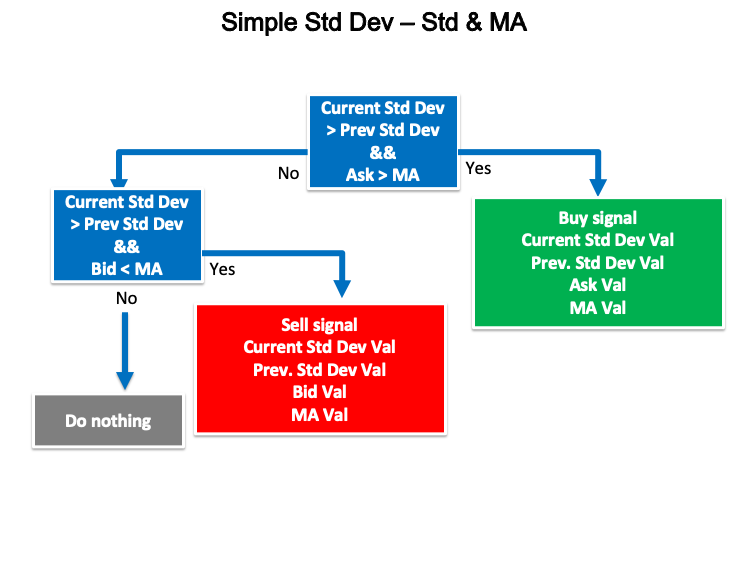
According to this strategy, we need the trading system to check four values and perform a comparison continuously. These four values are current Std Dev, previous Std Dev, Ask, and the moving average value. After checking these values, we need the trading system to decide and appear a suitable signal based on that.
If the current Std Dev is greater than the previous Std Dev and the Ask value is greater than the moving average, we need the trading system to generate a comment on the chart with the following values:
- Buy signal.
- Current Std Dev value.
- Previous Std Dev value.
- Ask value.
- Moving average value.
If the current Std Dev is greater than the previous Std Dev and the Bid value is lower than the moving average, we need the trading system to generate a comment on the chart with the following values:
- Sell signal.
- Current Std Dev value.
- Previous Std Dev value.
- Bid value.
- Moving average value.
- Strategy three: Simple Std Dev - Std, Avg, and MA:
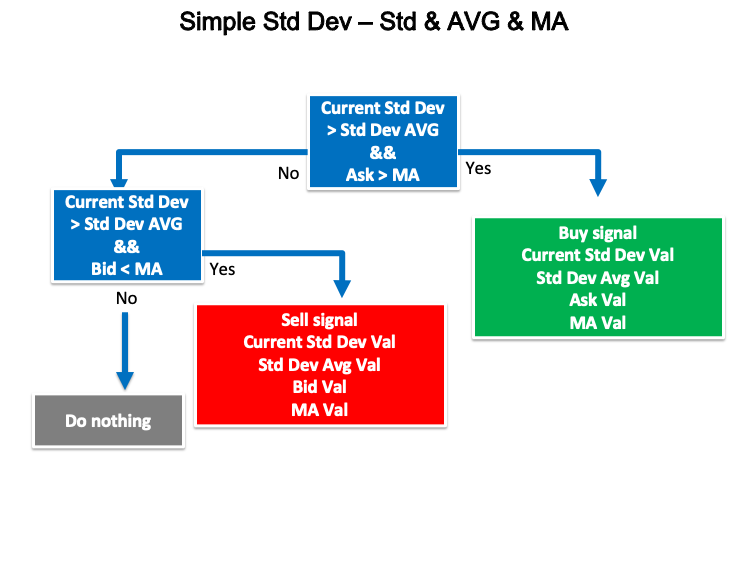
According to this strategy, we need the trading system to check four values continuously to decide what signal we need to see based on a comparison between these values. These values are current Std Dev, Std Dev Avg, Ask, and the moving average.
If the current Std value is greater than Std Dev Avg and the Ask is greater than the moving average, we need the trading system to generate a signal as a comment on the chart with the following values:
- Buy signal.
- Current Std Dev value.
- Std Dev average value.
- Ask value.
- Moving average value.
If the current Std Dev is greater than the Std Dev average and the Bid is lower than the moving average, we need the trading system to generate a signal as a comment on the chart with the following values:
- Sell signal.
- Current Std Dev value.
- Std Dev average value.
- Bid value.
- Moving average value.
Now, we learned to design a step-by-step blueprint for each strategy to help us to create a trading system for them through organized steps.
Standard Deviation trading system
In this topic, we learn how to design a trading system for each mentioned strategy by MQL5 to be applied on MetaTrader 5. First, we will design a simple trading system for the standard Deviation which can generate a comment on the desired chart with the standard deviation value to use this trading system as a base to design a trading system for each strategy.
- Creating an array of Std Dev by using the "double" function which represents fractional values. double is one of the floating-point types which is one of the data types.
double StdDevArray[]; - Sorting this array from current data and we will do that by using the "ArraySetAsSeries" function to return a true or false or boolean value. Parameters of the "ArraySetAsSeries" are:
- An array[]
- Flag
ArraySetAsSeries(StdDevArray,true);
- Creating an integer variable of StdDevDef to define the Standard Deviation by using the "iStdDev" function which returns the handle of the Standard Deviation indicator. Parameters of this function are:
- symbol, to set the symbol name, we will specify "_Symbol" to be applied on the current chart.
- period, to set the time frame, we will specify "_Period" to be applied to the current time frames.
- ma_period, to set the moving average length, we will set 20 as a default.
- ma_shift, to set the horizontal shift if you want, we will set 0.
- ma_method, to determine the type of moving average, we will use the simple moving average(MODE_SMA).
- applied_price, to determine the price type to be used, we will use the closing price (PRICE_CLOSE).
int StdDevDef = iStdDev(_Symbol,_Period,20,0,MODE_SMA,PRICE_CLOSE);
- Copying price data to the array of StdDev by using the "CopyBuffer" function to return the copied data count or -1 if there is an error. Parameters of this function are:
- indicator_handle, we will specify the indicator Definition "StdDevDef".
- buffer_num, to set the indicator buffer number, we will set 0.
- start_pos, to set the start position, we will set 0.
- count, to set the amount to copy, we will set 3.
- buffer[], to determine the target array to copy, we will determine "StdDevArray".
CopyBuffer(StdDevDef,0,0,3,StdDevArray);
- Getting the StdDev value by using the "NormalizeDouble" function a double type after creating a double variable of "StdDevVal". Parameters of the "Normalizedouble" are:
- value, to determine the normalized number, we will specify "StdDevArray[0]"
- digits, to determine the number of digits after the decimal point, we will determine 6.
double StdDevVal = NormalizeDouble(StdDevArray[0],6);
- Appearing a comment on the chart with the current StdDev value by using the "Comment" function, there is no return value but it will output a defined comment.
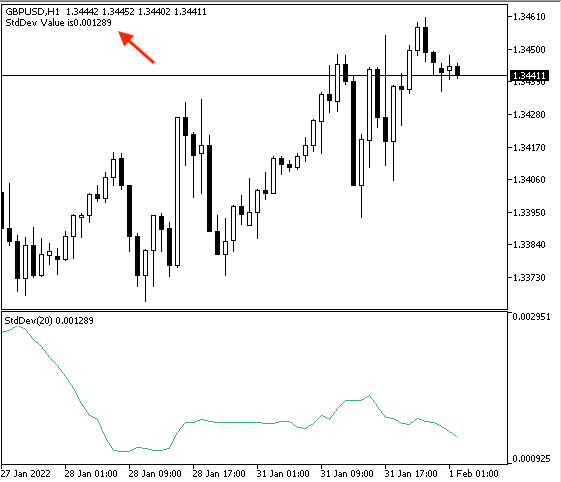
Comment("StdDev Value is",StdDevVal);
After compiling this code, we will find that there are no errors or warnings. Then we will find the expert of this trading system in the navigator window the same as the following:
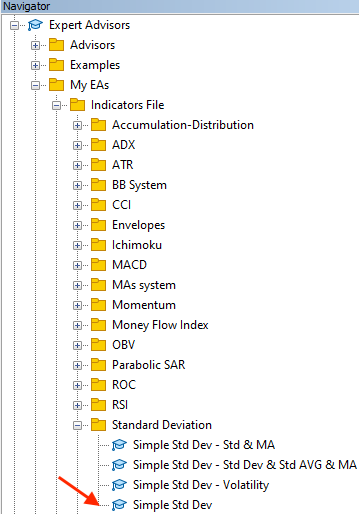
By dragging and dropping it on the desired chart, the following window of the trading system will appear:
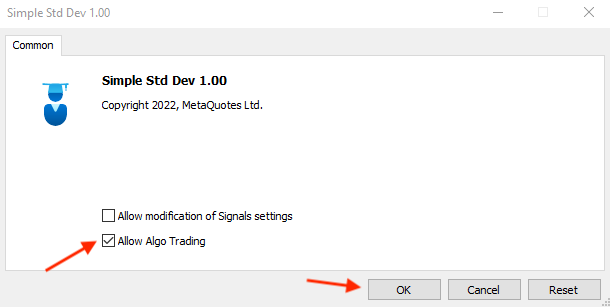
After ticking next to the "Allow Algo trading" and pressing "OK", we will find that the expert of this trading system will be attached to the chart the same as the following:
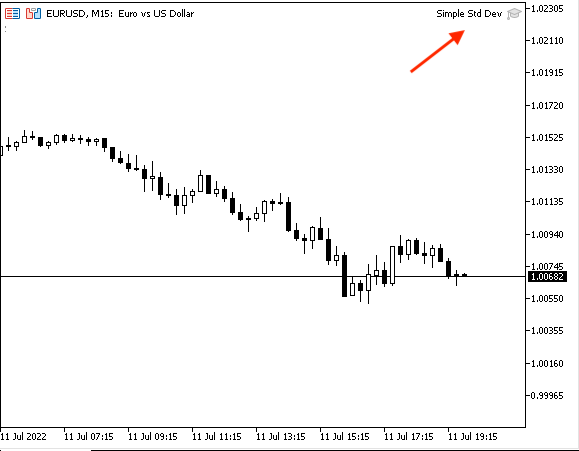
As we can see in the right corner of the previous picture that the expert is attached to the chart.
The following picture is an example from testing that is appearing the generated signal according to this trading system.
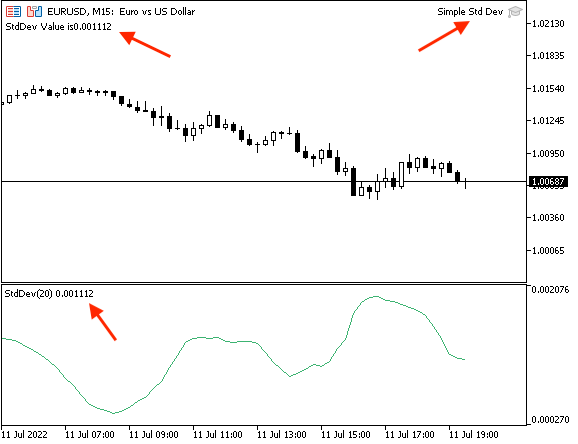
The following picture is another example after attaching the expert of this trading system to generate signals automatically and at the same time, we will insert the built-in Standard Deviation indicator to make sure that both StdDev values are the same.
- Strategy one: Simple Std Dev - Volatility:
Now, we will create a trading system for the simple Std Dev - Volatility strategy and the following is for the full code to create a trading system based on this strategy.
//+------------------------------------------------------------------+
//|                                  Simple Std Dev - Volatility.mq5 |
//|                                  Copyright 2022, MetaQuotes Ltd. |
//|                                             https://www.mql5.com |
//+------------------------------------------------------------------+
#property copyright "Copyright 2022, MetaQuotes Ltd."
#property link      "https://www.mql5.com"
#property version   "1.00"
//+------------------------------------------------------------------+
void OnTick()
  {
   double StdDevArray[];

   ArraySetAsSeries(StdDevArray,true);

   int StdDevDef = iStdDev(_Symbol,_Period,20,0,MODE_SMA,PRICE_CLOSE);

   CopyBuffer(StdDevDef,0,0,6,StdDevArray);

   double StdDevVal = NormalizeDouble(StdDevArray[0],6);
   double StdDevVal1 = NormalizeDouble(StdDevArray[1],6);
   double StdDevVal2 = NormalizeDouble(StdDevArray[2],6);
   double StdDevVal3 = NormalizeDouble(StdDevArray[3],6);
   double StdDevVal4 = NormalizeDouble(StdDevArray[4],6);
   double StdDevVal5 = NormalizeDouble(StdDevArray[5],6);
   double StdDevAVGVal = ((StdDevVal1+StdDevVal2+StdDevVal3+StdDevVal4+StdDevVal5)/5);

   if(StdDevVal>StdDevAVGVal)
     {
      Comment("High volatility","\n",
              "Current Std Dev value is ",StdDevVal,"\n",
              "Std Dev Avg value is ",StdDevAVGVal);
     }

   if(StdDevVal<StdDevAVGVal)
     {
      Comment("Low volatility","\n",
              "Current Std Dev value is ",StdDevVal,"\n",
              "Std Dev Avg value is ",StdDevAVGVal);
     }

  }
//+------------------------------------------------------------------+
Differences in this code are the same as the below:
Defining not only the current Std Dev value but we will define the previous five values by using the same function of defining the current value but we will use a different number in the normalized number to provide the desired value.
double StdDevVal1 = NormalizeDouble(StdDevArray[1],6);
double StdDevVal2 = NormalizeDouble(StdDevArray[2],6);
double StdDevVal3 = NormalizeDouble(StdDevArray[3],6);
double StdDevVal4 = NormalizeDouble(StdDevArray[4],6);
double StdDevVal5 = NormalizeDouble(StdDevArray[5],6);
Calculating the average of the previous five values.
double StdDevAVGVal = ((StdDevVal1+StdDevVal2+StdDevVal3+StdDevVal4+StdDevVal5)/5);
Conditions of the strategy:
In case of high volatility,
   if(StdDevVal>StdDevAVGVal)
     {
      Comment("High volatility","\n",
              "Current Std Dev value is ",StdDevVal,"\n",
              "Std Dev Avg value is ",StdDevAVGVal);
     }
In case of low volatility,
   if(StdDevVal<StdDevAVGVal)
     {
      Comment("Low volatility","\n",
              "Current Std Dev value is ",StdDevVal,"\n",
              "Std Dev Avg value is ",StdDevAVGVal);
     }
After compiling this code, we will find it in the navigator the same as the following:
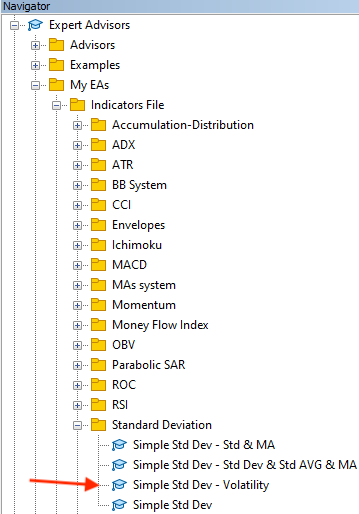
By dragging and dropping it on the desired chart, we can find the window of this trading system the same as the following:

After pressing "OK", we will find the expert attached on the chart the same as the following to start generating signals according to this strategy:
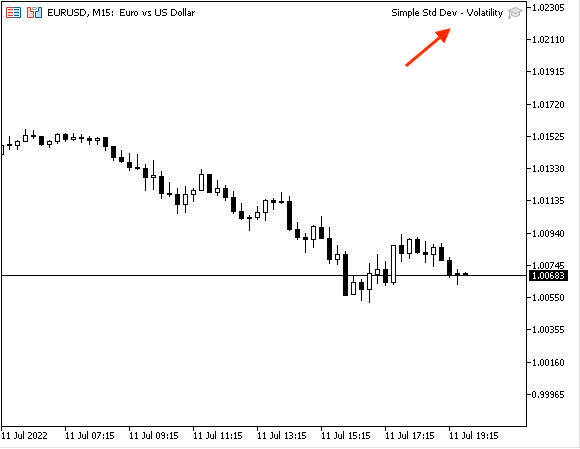
As we can see that the expert of the simple Std Dev - Volatility trading system is attached the same as we can see in the top right corner of the previous picture.
We can see examples of generated signals according to this trading system from testing the same as the following pictures:
In case of high volatility according to this strategy,
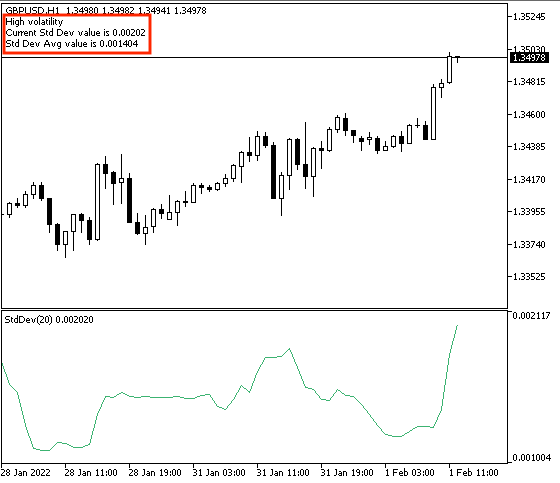
As we can see in the previous picture, we find in the top left corner of the chart three lines of comments:
- High volatility statement.
- Current Std Dev value.
- Avg of the previous five Std Dev values.
In case of low volatility according to this strategy,
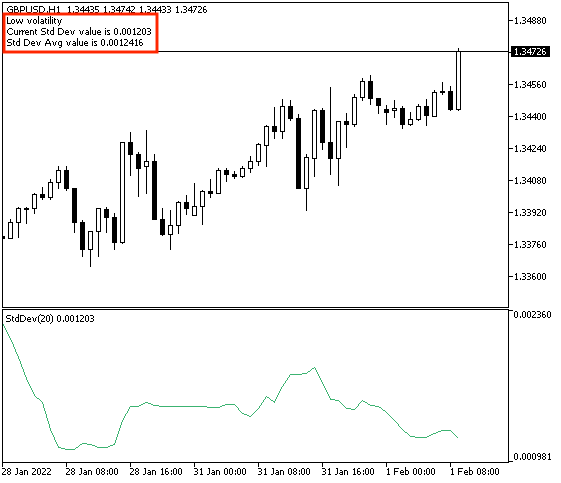
As we can find in the previous picture, in the top left corner of the chart another three lines of comments to inform us:
- The volatility is low.
- The current Std Dev value.
- The Avg of the previous five Std Dev values.
- Strategy two: Simple Std Dev - Std and MA:
The following code is for how to create a trading system for this simple Std Dev - Std and MA strategy:
//+------------------------------------------------------------------+
//|                                    Simple Std Dev - Std & MA.mq5 |
//|                                  Copyright 2022, MetaQuotes Ltd. |
//|                                             https://www.mql5.com |
//+------------------------------------------------------------------+
#property copyright "Copyright 2022, MetaQuotes Ltd."
#property link      "https://www.mql5.com"
#property version   "1.00"
//+------------------------------------------------------------------+
void OnTick()
  {
   double Ask = NormalizeDouble(SymbolInfoDouble(_Symbol,SYMBOL_ASK),_Digits);
   double Bid = NormalizeDouble(SymbolInfoDouble(_Symbol,SYMBOL_BID),_Digits);

   double StdDevArray[];
   double PArray[];

   ArraySetAsSeries(StdDevArray,true);
   ArraySetAsSeries(PArray,true);

   int StdDevDef = iStdDev(_Symbol,_Period,20,0,MODE_SMA,PRICE_CLOSE);
   int MADef = iMA(_Symbol,_Period,10,0,MODE_SMA,PRICE_CLOSE);

   CopyBuffer(StdDevDef,0,0,3,StdDevArray);
   CopyBuffer(MADef,0,0,10,PArray);

   double StdDevVal = NormalizeDouble(StdDevArray[0],6);
   double StdDevVal1 = NormalizeDouble(StdDevArray[1],6);

   double MAValue = NormalizeDouble(PArray[0],6);


   if(StdDevVal>StdDevVal1&&Ask>MAValue)
     {
      Comment("Buy signal","\n",
              "Current Std Dev value is ",StdDevVal,"\n",
              "Previous Std Dev value is ",StdDevVal1,"\n",
              "Ask value is ",Ask,"\n",
              "MA value is ",MAValue);
     }

   if(StdDevVal>StdDevVal1&&Bid<MAValue)
     {
      Comment("Sell signal","\n",
              "Current Std Dev value is ",StdDevVal,"\n",
              "Previous Std Dev value is ",StdDevVal1,"\n",
              "Bid value is ",Bid,"\n",
              "MA value is ",MAValue);
     }

  }

//+------------------------------------------------------------------+
Differences in this code are the same as the following:
Defining Ask, and Bid values by creating double variables for everyone, using the "NormalizeDouble" function to return a double type value, then using the "SymbolInfoDouble" as a normalized number to return the corresponding property of a specific symbol. Parameters of the "SymbolInfoDouble" are:
- name of the symbol, we will use the "_Symbol" to be applied on the current symbol chart.
- prop_id, to define the property, which is "SYMBOL_ASK" here.
double Ask = NormalizeDouble(SymbolInfoDouble(_Symbol,SYMBOL_ASK),_Digits);
double Bid = NormalizeDouble(SymbolInfoDouble(_Symbol,SYMBOL_BID),_Digits);
Creating one more array of prices.
double PArray[]; Sorting this array from the current data.
ArraySetAsSeries(PArray,true);
Defining the moving average by using the "iMA" function after creating an integer variable of the MADef.
int MADef = iMA(_Symbol,_Period,10,0,MODE_SMA,PRICE_CLOSE);
Copying price data to this created array.
CopyBuffer(MADef,0,0,10,PArray);
Defining the previous value of Std Dev.
double StdDevVal1 = NormalizeDouble(StdDevArray[1],6);
Defining the value of the moving average.
double MAValue = NormalizeDouble(PArray[0],6);
Conditions of the strategy:
In case of buy signal,
   if(StdDevVal>StdDevVal1&&Ask>MAValue)
     {
      Comment("Buy signal","\n",
              "Current Std Dev value is ",StdDevVal,"\n",
              "Previous Std Dev value is ",StdDevVal1,"\n",
              "Ask value is ",Ask,"\n",
              "MA value is ",MAValue);
     }
In case of sell signal,
   if(StdDevVal>StdDevVal1&&Bid<MAValue)
     {
      Comment("Sell signal","\n",
              "Current Std Dev value is ",StdDevVal,"\n",
              "Previous Std Dev value is ",StdDevVal1,"\n",
              "Bid value is ",Bid,"\n",
              "MA value is ",MAValue);
     }
After compiling this code, we will find it in the navigator window the same as the following picture:
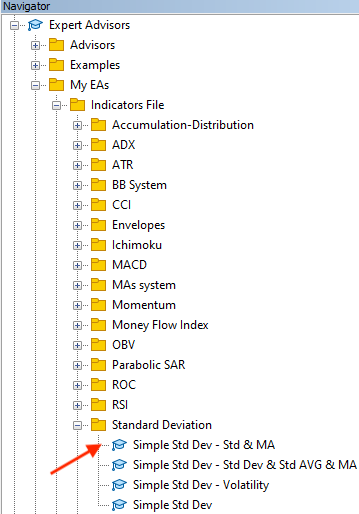
By double-clicking we can find the following window of this expert advisor the same as the following picture:
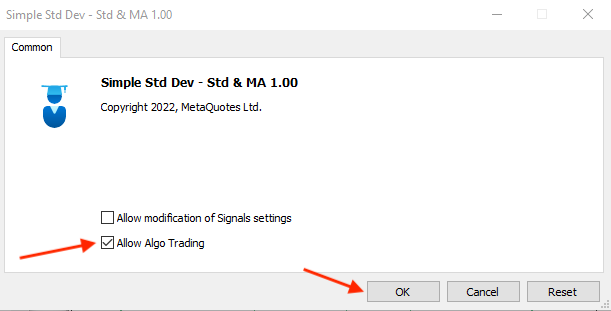
After ticking next to "Allow Algo Trading" then pressing "OK", we will find that the expert will be attached to the chart the same as the below picture:
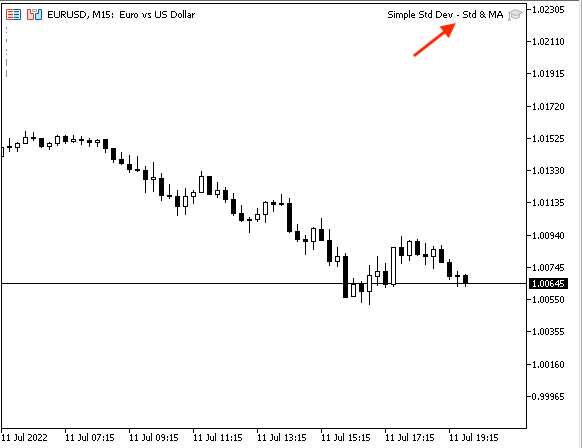
As we can see in the top right of the chart that the expert advisor is attached then we can see examples from testing according to this strategy the same as the following examples.
In case of the buy signal,
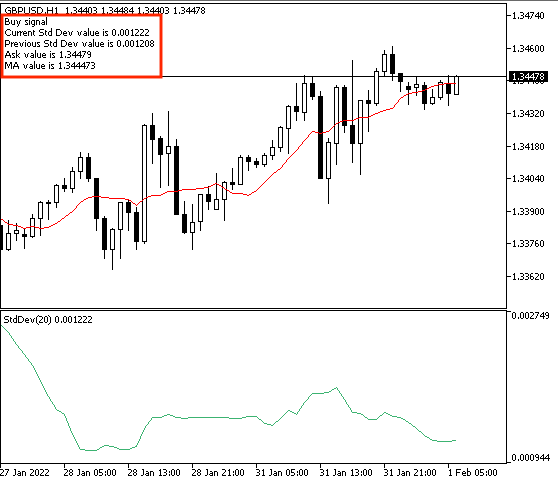
As we can find through the previous example of the buy signal we have five lines of comments on the top left corner of the chart:
- Buy signal
- Current Std Dev value
- Previous Std Dev value
- Ask value
- Ma Value
In case of sell signal,
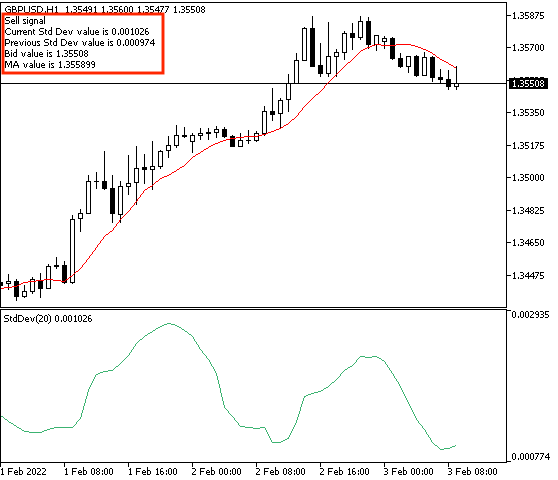
As we can find through the previous example of the sell signal we have five lines of comments in the top left corner of the chart:
- Sell signal
- Current Std Dev value
- Previous Std Dev value
- Bid value
- Ma Value
Through the previous, we learned how to create a trading system that can be used to generate buy or sell signals based on the standard deviation and the moving average.
- Strategy three: Simple Std Dev - Std Dev, Std AVG, and MA:
The following is for the full code to create a trading system based on this strategy:
//+------------------------------------------------------------------+
//|                  Simple Std Dev - Std Dev & AVG Std Dev & MA.mq5 |
//|                                  Copyright 2022, MetaQuotes Ltd. |
//|                                             https://www.mql5.com |
//+------------------------------------------------------------------+
#property copyright "Copyright 2022, MetaQuotes Ltd."
#property link      "https://www.mql5.com"
#property version   "1.00"
//+------------------------------------------------------------------+
void OnTick()
  {
   double Ask = NormalizeDouble(SymbolInfoDouble(_Symbol,SYMBOL_ASK),_Digits);
   double Bid = NormalizeDouble(SymbolInfoDouble(_Symbol,SYMBOL_BID),_Digits);

   double StdDevArray[];
   double PArray[];

   ArraySetAsSeries(StdDevArray,true);
   ArraySetAsSeries(PArray,true);

   int StdDevDef = iStdDev(_Symbol,_Period,20,0,MODE_SMA,PRICE_CLOSE);
   int MADef = iMA(_Symbol,_Period,10,0,MODE_SMA,PRICE_CLOSE);

   CopyBuffer(StdDevDef,0,0,6,StdDevArray);
   CopyBuffer(MADef,0,0,10,PArray);

   double StdDevVal = NormalizeDouble(StdDevArray[0],6);
   double StdDevVal1 = NormalizeDouble(StdDevArray[1],6);
   double StdDevVal2 = NormalizeDouble(StdDevArray[2],6);
   double StdDevVal3 = NormalizeDouble(StdDevArray[3],6);
   double StdDevVal4 = NormalizeDouble(StdDevArray[4],6);
   double StdDevVal5 = NormalizeDouble(StdDevArray[5],6);
   double StdDevAVGVal = ((StdDevVal1+StdDevVal2+StdDevVal3+StdDevVal4+StdDevVal5)/5);
   double MAValue = NormalizeDouble(PArray[0],6);

   if(StdDevVal>StdDevAVGVal&&Ask>MAValue)
     {
      Comment("Buy signal","\n",
              "Current Std Dev value is ",StdDevVal,"\n",
              "Std Dev Avg value is ",StdDevAVGVal,"\n",
              "Ask value is ",Ask,"\n",
              "MA value is ",MAValue);
     }

   if(StdDevVal>StdDevAVGVal&&Bid<MAValue)
     {
      Comment("Sell signal","\n",
              "Current Std Dev value is ",StdDevVal,"\n",
              "Std Dev Avg value is ",StdDevAVGVal,"\n",
              "Bid value is ",Bid,"\n",
              "MA value is ",MAValue);
     }

  }

//+------------------------------------------------------------------+
Differences in this code are:
Conditions of strategy,
In case of the buy signal,
   if(StdDevVal>StdDevAVGVal&&Ask>MAValue)
     {
      Comment("Buy signal","\n",
              "Current Std Dev value is ",StdDevVal,"\n",
              "Std Dev Avg value is ",StdDevAVGVal,"\n",
              "Ask value is ",Ask,"\n",
              "MA value is ",MAValue);
     }
In case of the sell signal,
   if(StdDevVal>StdDevAVGVal&&Bid<MAValue)
     {
      Comment("Sell signal","\n",
              "Current Std Dev value is ",StdDevVal,"\n",
              "Std Dev Avg value is ",StdDevAVGVal,"\n",
              "Bid value is ",Bid,"\n",
              "MA value is ",MAValue);
     }
After compiling this code, we can find the expert in the navigator window the same as the following:
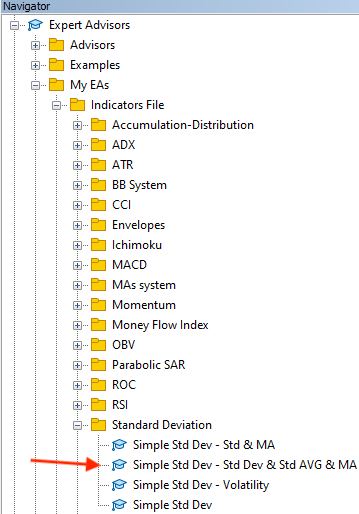
After double-clicking or dragging and dropping it on the chart, we can find the window of it the same as the following:
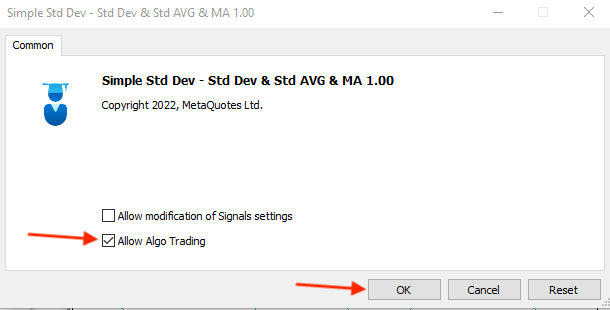
After pressing "OK", we will find that the expert is attached to the chart the same as the below picture.
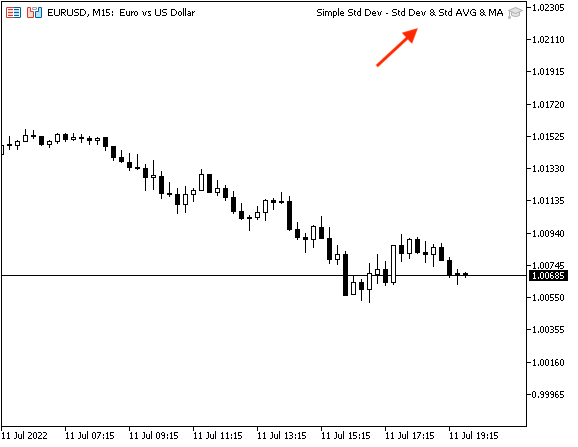
As we can see on the top right corner of the chart, we can find the expert is attached.
Now, we need to see examples of generated signals based on this trading system and we can see that through the following examples:
In case of the buy signal,
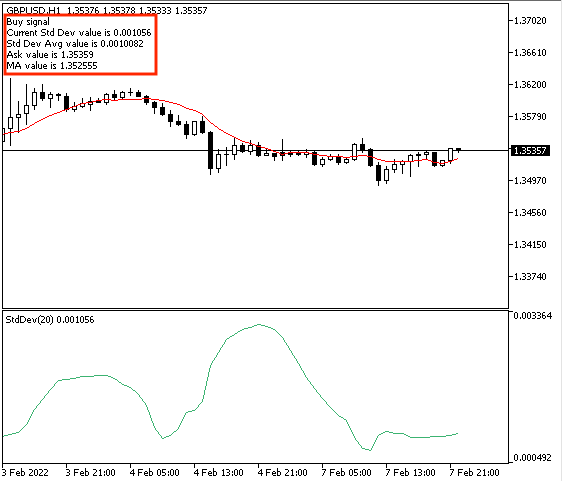
As we can see through the previous example in the top left corner of the chart that this trading system generated five lines of comment:
- Buy signal
- Current Std Dev value
- Std Dev Avg value
- Ask value
- Ma value
In case of the sell signal,
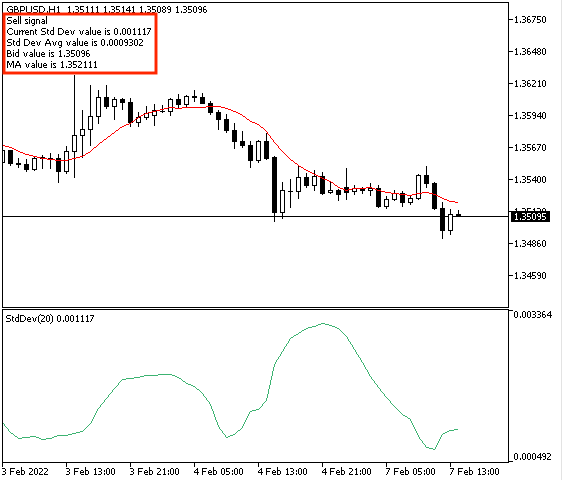
As we can find through the previous example of sell signal there are five lines of comment based on this trading system:
- Sell signal
- Current Std Dev value
- Std Dev Avg value
- Bid value
- Ma value
Through the previous, we learned how to create a trading system based on each mentioned strategy that can be used to generate automatic signals.
Conclusion
Now and after the previous topics, we considered that we learned more about the Standard Deviation indicator as we learned what is it, what it informs us or what it measures, and how we can calculate manually to deepen our understanding of the indicator through the application to an example. After understanding this indicator very well, we learned how we can use it through simple strategies based on the basic concept of the indicator. As we learn how to use it as a volatility measurement through the simple Std Dev - volatility strategy. how to use it to get buy or sell signals based on two different conditions through the simple Std Dev - Std and MA strategy and the Std, Std AVG, MA strategy. After that, we learned to design a step-by-step blueprint for each strategy to help us to create a trading system for each of them smoothly and easily. After that, we created a trading system by MQL5 based on each mentioned strategy to be used by the MetaTrader 5 to generate signals automatically to help us save our time, get accurate signals based on specific conditions, avoid harmful emotions and subjectivity by getting clear signals and these are from programming benefits.
It will be useful if you try to accompany this indicator with other technical indicators to get more insights to see more than one perspective as this is one of the features of technical analysis as you design a trading system that can be used to give you clear insights about the most important factors of the financial instrument.
I need to confirm again that you must test any strategy by yourself before using it as the main objective here is education only to make sure that it will be useful or suitable for you. I hope that you find this article useful for you by understanding the topic of it, and getting new ideas that can be useful to enhance your trading.
If you found this article useful and you want to read more similar articles to learn how to design a trading system by the most popular technical indicator you can find my other articles in this series.