Learn how to design a trading system by Ichimoku
Mohamed Abdelmaaboud | 24 June, 2022
Introduction
Welcome to a new article in our series which can learn through it how to design a trading system by the most common technical indicators. In this article, we will learn a new technical tool in detail that can be used in our favor to learn how to create a simple trading system based on simple strategies based on the main concept or idea of this indicator.
We will cover this indicator through the following topics:
- Ichimoku definition
- Ichimoku strategy
- Ichimoku strategy blueprint
- Ichimoku trading system
- Conclusion
Throughout the topic of Ichimoku definition, we will learn what is Ichimoku, what is the construction of the indicator, how we can calculate it, and what it measures. So, we will learn the indicator in detail to learn the main concept behind it to be able to use it effectively. Ichimoku strategy will be the topic that we will learn through it, simple strategies based on the basic concept behind the indicator. Then, we will design a step-by-step strategy blueprint for each mentioned strategy to help us to create a trading system for them and we will learn that through the topic of Ichimoku strategy blueprint. In addition to that, we will learn the most interesting part in this article and the core of it is how we can create a trading system by MQL5 to execute it in the MetaTrader 5 trading platform for each mentioned strategy as we will learn that through the topic of Ichimoku trading system.
We will use the MetaQuotes Language (MQL5) which is a built-in editor in the MetaTrader 5. If you want to learn how to download the MetaTrader 5 to use the MetaEditor, you can read the Writing MQL5 code in MetaEditor topic from a previous article.
I advise you to test everything and practice what you read as this will be very helpful to deepen your understanding or open your eyes to new ideas.
Disclaimer: All content of this article is made for the purpose of education only not for anything else. So, you will be responsible for any action you take based on the content of this article, as the content of this article does not guarantee any kind of results.
Now, let us start our learning journey through this new article and its topics.
Ichimoku definition
In this part, we will learn the Ichimoku indicator in detail by identifying what is it, what it measures, its construction, and how we can calculate it. So, we can understand all that we need deeply about the indicator for effective use after that.
The Ichimoku indicator was developed by Goichi Hosoda. It is one of the Japanese school tools that can be used to get more insights into the financial instrument as we can identify the trend direction, support and resistance, momentum, and trading signals. If you want to know more about how to identify the trend, you can read the topic of trend definition from a previous article.
It has five plots:
- Tenkan-Sen (Conversion Line)
- Kijun-Sen (Base Line)
- Senkou Span A (Leading Span A)
- Senkou Span B (Leading Span B)
- Chikou Span (Lagging Span)
Now, we need to learn how we can calculate the Ichimoku indicator manually to know the concept behind this indicator or use the indicator effectively. So, we will learn that by calculating every element from the Ichimoku.
Tenkan-Sen (Conversion Line)= (High of 9 periods + Low of 9 periods)/2
Kijun-Sen (Base Line)= (High of 26 periods + Low of 26 periods)/2
Senkou Span A (Leading Span A) = (Tenkan-Sen + Kijun-Sen)/2 but it will be plotted 26 periods in the future
Senkou Span B (Leading Span B)= (High of 52 periods + Low of 52 periods)/2 but it will be plotted 26 periods in the future also
Chikou Span (Lagging Span)= Close of today but it will be plotted 26 periods in the past
Nowadays, we do not need to calculate it manually but we learn it now to identify the concept behind the indicator. We have trading platforms that include this indicator and all we need is to select the Ichimoku among available indicators to be plotted on the chart without any calculation. Here, we need to insert the Ichimoku indicator to the chart in the MetaTrader5, we will press the Insert tab --> Indicators --> Ichimoku Kinko Hyo
By the way, Ichimoku called Ichimoku Kinko Hyo also.
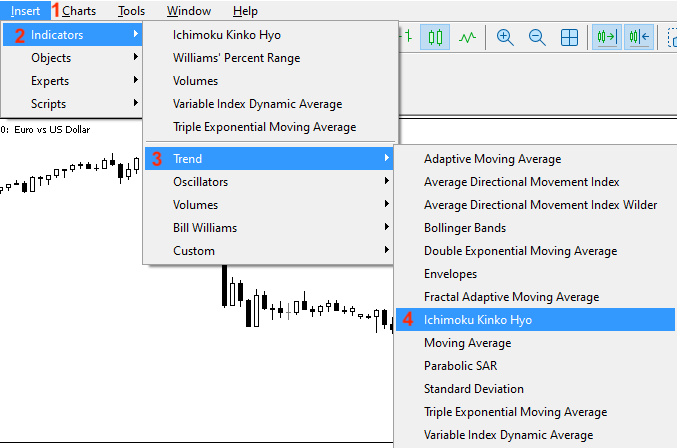
After that, we will find the window of the indicator appear the same as the following:
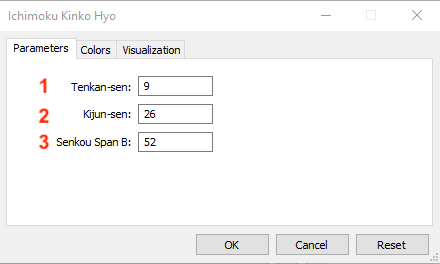
The previous picture is to set the desired parameters of the indicator:
1- To set the period of Tenkan-sen
2- To set the period of Kijun-sen
3- To set the period of Senkou Span B
We can also set the desired style and appearance of the indicator from the colors tab:
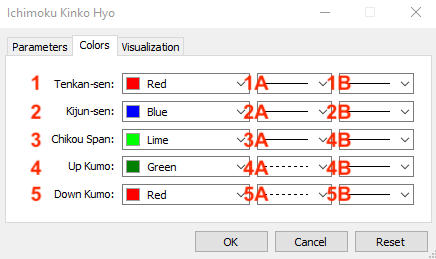
1- To select the color of Tenkan-sen
1A- To select the style of Tenkan-sen line
1B- To select the thickness of Tenkan-sen line
2- To select the color of the Kijun-sen
2A- To select the style of the Kijun line
2B- To select the thickness of the Kijun line
3- To select the color of the Chikou Span
3A- To select the style of the Chikou Span
3B- To select the thickness of the Chikou Span
4- To select the color of the cloud in case of upward movement (Up Kumo)
4A- To select the style of the cloud in case of upward movement (Up Kumo)
4B- To select the thickness of the cloud in case of upward movement (Up Kumo)
5- To select the color of the cloud in case of downward (Down Kumo)
5A- To select the style of the cloud in case of downward (Down Kumo)
5B- To select the thickness of the cloud in case of downward (Down Kumo)
After setting our preferences, we can find the indicator on the chart the same as the following.
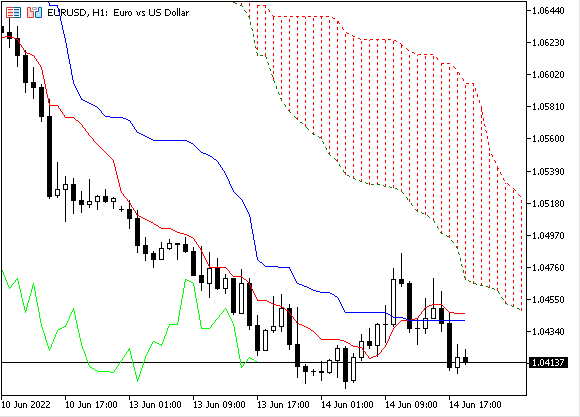
As we can see from the indicator on the chart in the previous picture, the blue and red lines are for Tenkan-Sen and Kijun-Sen, and the green line is for Chikou Span which is the close price plotted 26 hours in the past according to the timeframe, in addition to the cloud (Senkou Span A and Senkou Span B) that is plotted 26 hours in the future and it is red which means that it is moving to down.
Ichimoku strategy
In this topic, we will learn how to use the Ichimoku indicator based on simple strategies based on the basic concept of the indicator. We will see a strategy that can be used to identify the trend through the Ichimoku trend identifier. We will learn a strategy that can be used to inform us about the strength of the trend through the strategy of the Ichimoku strength, then we will learn a strategy that can be used to alert us in case of a bullish or bearish signal based on two different methods of crossover the same as what we will see through the strategy of Ichimoku price-Ki signal and the strategy of Ichimoku ten-ki signal.
I need to confirm here before starting to mention strategies that you must test any strategy before using it even if it was tested as there is nothing suitable for everyone. Every one of us has a personality in trading or personal trading style based on his characteristics. So, what might be suitable for me, does not mean it will be suitable for you.
In addition to that, even if you find the strategy is suitable for you as an idea or concept, you may find that you need optimization to be useful for you. So, it is very important that you do not use any strategy on your real account before testing and finding it will be useful for you.
- Strategy one: Ichimoku trend identifier:
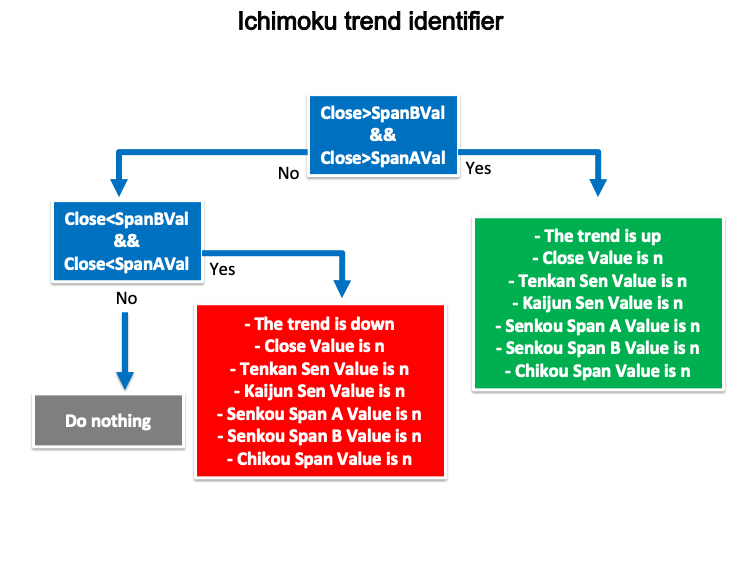
According to this strategy, we need a trigger that can be used to inform us about the trend type, if it is an uptrend or downtrend. We will check three values to do that and these values are the closing price, Senkou Span A, and Senkou Span B. If the closing price is greater than the Senkou Span B and at the same time the closing price is greater than Senkou Span A, this will be the trigger to know that the trend is up. Vice versa, if the closing price is lower than the Senkou Span B and at the same time the closing price is lower than the Senkou Span A, this will be the trigger to the downtrend.
Closing price > Senkou Span B and closing price > Senkou Span A --> Uptrend
Closing price < Senkou Span B and closing price < Senkou Span A --> Downtrend
- Strategy two: Ichimoku trend strength:
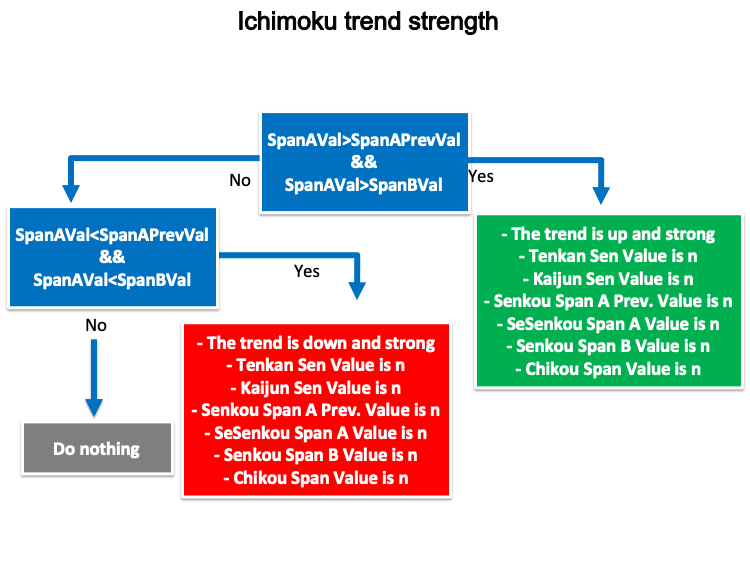
Based on this strategy, we need a trigger that can inform us the current trend is strong. We will check three values to do that and these values are the current Senkou Span A, the previous Senkou Span A, and the Senkou Span B. If the current Senkou Span A is greater than the previous Senkous Span A and at the same time the current Senkou Span A is greater than the Senkou Span B, this is a trigger that the trend is up and strong. Vice versa, if the current Senkou Span A is lower than the previous Senkou Span A and at the same time, the current Senkou Span A is lower than the Senkou Span B, this will be a signal that the trend is down and strong.
Current Senkou Span A > previous Senkou Span A and current Senkou Span A > Senkou Span B --> the uptrend is strong
Current Senkou Span A < previous Senkou Span A and current Senkou Span A < Senkou Span B --> the downtrend is strong
- Strategy three: Ichimoku price-Ki signal:
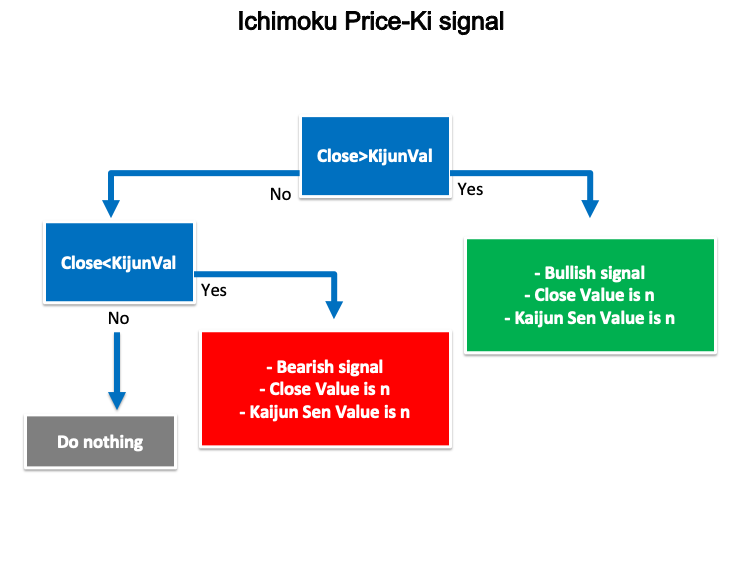
According to this strategy, during the uptrend, we need a trigger that can alert us about the bullish signal, and during the downtrend, we need a trigger than can alert us about the bearish signal. We will check based on this strategy two values, closing price, and Kijun-Sen. If the closing price is greater than the Kijun-sen value, this will be a trigger to a bullish signal. Vice versa, if the closing price is lower than the Kijun-sen value, this will be a bearish signal.
During uptrend, closing price > Kijun -sen --> bullish signal
Duuring downtrend, closing price < Kijun -sen --> bearish signal
- Strategy four: Ichimoku ten-ki signal:
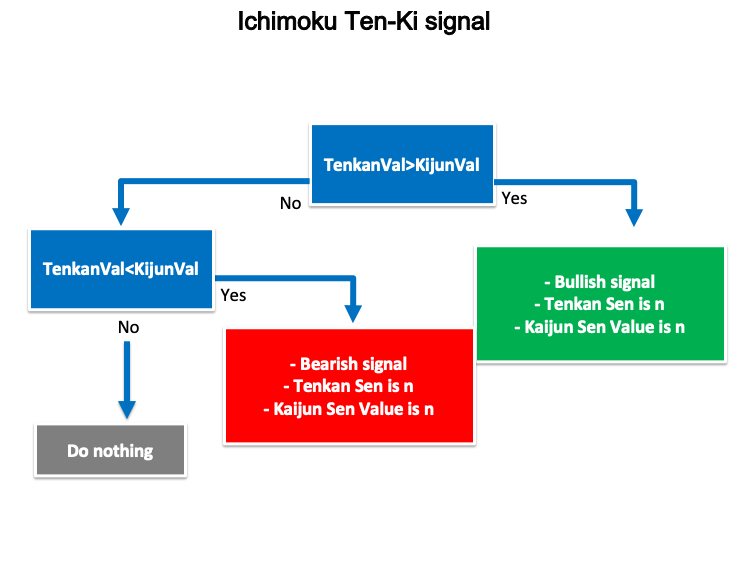
According to this strategy, during the uptrend, we need another trigger or method to alert us when there is a bullish signal or during the downtrend, we need a signal of bearishness. We will check based on this strategy two values, Tenkan-sen and Kijum-sen. If the Tenkan-sen value is greater than the Kijun-sen, this will be a signal of bullishness. Vice versa, if the Tenkan-sen is lower than the Kijun-sen, this will be a signal of bearishness.
Tenkan-sen > Kijun-sen --> bullish signal
Tenkan-sen < Kijun-sen --> bearish signal
Ichimoku strategy blueprint
In this part, we will create a blueprint for each strategy, I consider this step the most important step in our mission to create a trading system as it will help us to design a step-by-step blueprint that will help us to understand what we want to do exactly.
- Strategy one: Ichimoku trend identifier:
Based on this strategy, we need to create a trading system that is able to check the values of closing prices, Senkou Span A, and Senkou span B continuously. We need the trading system to make a comparison between these values to decide which one is bigger or smaller to decide if there is an uptrend or downtrend and appear as a comment on the chart with values of the closing price and Ichimoku lines. If the closing price is greater than span B and the closing price is greater than span A, then the trend is up. If the closing price is lower than span B and the closing price is lower than span A, then the trend is down.
- Strategy two: Ichimoku trend strength:
Based on this strategy, we need to create a trading system to alert us to the strength of the current trend. So, we need the trading system to check the values of current Senkou span A, previous senkou span A, and senkou span B continuously. We need the trading system to make a comparison between these values to decide which one is bigger or smaller to return the strength of the current trend based on that. If the current span A is greater than the previous span A and the current span A is greater than span B, then the trend is up and strong and appears as a comment on the chart with values of Ichimoku lines.
- Strategy three: Ichimoku price - Ki signal:
According to this strategy, we need to create a trading system to appear a comment on the chart with the bullish or bearish signal and values of closing prices and the Kijun sen line. So, we need the trading system to check the values of the closing price and the Kijun sen line continuously to make a comparison to decide which one is bigger or smaller. If the closing price is greater than Kijun sen, appear bullish signal, closing price, and Kijun sen values as comments on the chart. If the closing price is lower than the Kijun sen, appear bearish signal, closing price, and Kijun sen values as comments on the chart.
- Strategy four: Ichimoku ten-Ki signal:
According to this strategy, we need to create a trading system to appear a comment on the chart with a bullish or bearish signal based on a comparison between Tenkan sen and Kijun values to decide which one is bigger or smaller. So, we need the trading system to check these two values continuously to return a bullish signal, the Tenkan Sen value, and the Kijun Sen value if the Tenkan Sen value is greater than the Kijun Sen value to return a bearish signal, the Tenkan Sen value, Kijun Sen value if the Tenkan Sen value is lower than Kijun Sen value.
Ichimoku trading system
In this part, we will learn how to design a trading system by Ichimoku indicator based on mentioned strategies. So, we will learn how to design a trading system based on Ichimoku trend identifier strategy, trend strength strategy, price, and Kijun-sen strategy, in addition to Tenken-sen and Kijun-sen strategy.
Now, we will design the simple Ichimoku system that shows us all Ichimoku values as a comment on the chart to use as a base for the mentioned strategies.
We will place the #include command to the file name Indicators/Trend.mqh then use CiIchimoku class to use the data of the Ichimoku indicator.
#include <Indicators/Trend.mqh>
CiIchimoku*Ichimoku;
Through the void OnInit(), we will call the indicator and then create double variables values of Tenkan-sen, Kijun-sen, Senkou span A, Senkou span B, and Chikou span.
   Ichimoku.Refresh(-1);
   double TenkanVal= Ichimoku.TenkanSen(0);
   double KijunVal= Ichimoku.KijunSen(0);
   double SpanAVal= Ichimoku.SenkouSpanA(-26);
   double SpanBVal= Ichimoku.SenkouSpanB(-26);
   double ChikouVal= Ichimoku.ChinkouSpan(26);
Comment these values on the chart and each value in a separate line.
   Comment("Tenkan Sen Value is: ",TenkanVal,"\n",
           "Kijun Sen Value is: ",KijunVal,"\n",
           "Senkou Span A Value is: ", SpanAVal,"\n",
           "Senkou Span B Value is: ",SpanBVal,"\n",
           "Chikou Span Value is: ",ChikouVal);
So, the full code will be the same as the following:
//+------------------------------------------------------------------+
//|                                       Simple Ichimoku system.mq5 |
//|                                  Copyright 2022, MetaQuotes Ltd. |
//|                                             https://www.mql5.com |
//+------------------------------------------------------------------+
#property copyright "Copyright 2022, MetaQuotes Ltd."
#property link      "https://www.mql5.com"
#property version   "1.00"
#include <Indicators/Trend.mqh>
CiIchimoku*Ichimoku;
//+------------------------------------------------------------------+
void OnInit()
  {
   Ichimoku = new CiIchimoku();
   Ichimoku.Create(_Symbol,PERIOD_CURRENT,9,26,52);
  }

//+------------------------------------------------------------------+
//|                                                                  |
//+------------------------------------------------------------------+
void OnTick()
  {
   Ichimoku.Refresh(-1);
   double TenkanVal= Ichimoku.TenkanSen(0);
   double KijunVal= Ichimoku.KijunSen(0);
   double SpanAVal= Ichimoku.SenkouSpanA(-26);
   double SpanBVal= Ichimoku.SenkouSpanB(-26);
   double ChikouVal= Ichimoku.ChinkouSpan(26);

   Comment("Tenkan Sen Value is: ",TenkanVal,"\n",
           "Kijun Sen Value is: ",KijunVal,"\n",
           "Senkou Span A Value is: ", SpanAVal,"\n",
           "Senkou Span B Value is: ",SpanBVal,"\n",
           "Chikou Span Value is: ",ChikouVal);
  }
//+------------------------------------------------------------------+
After compiling this code, we will find it in the navigator window.
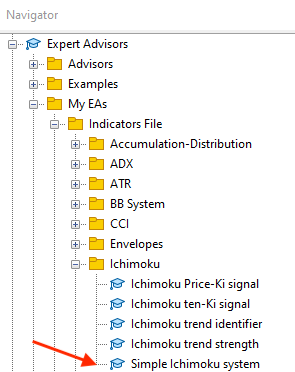
To execute it, we will double-click it or drag and drop it on the chart and the window of the Ichimoku system will appear.
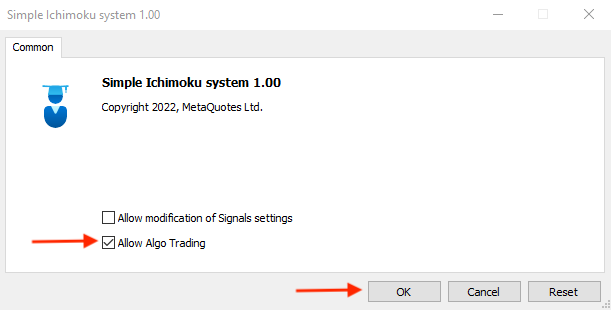
After pressing Ok, it will be attached to the chart.
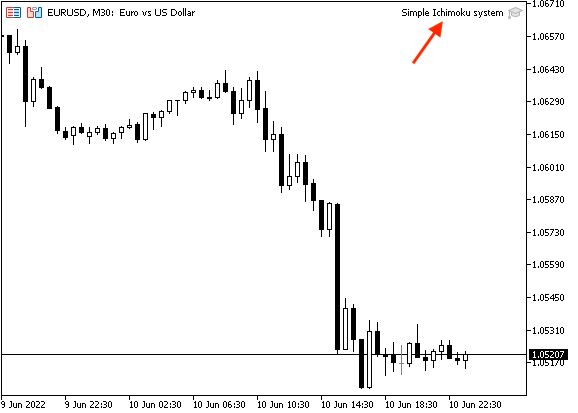
The following is an example of generated signals of this system.
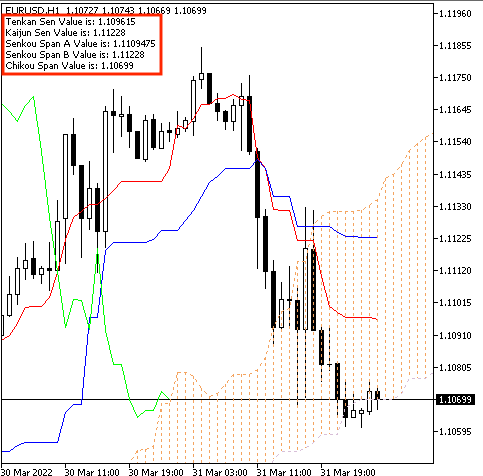
As we can see from the previous picture, we find that there is a comment on the chart with the following values:
- Tenkan Sen Value
- Kijun Sen Value
- Senkou Span A Value
- Senkou Span B Value
- Chikou Span Value
- Strategy one: Ichimoku trend identifier:
Now, we need to design a trading system that gives me a comment with the current trend definition based on this strategy and the following is the full code to write this kind of strategy.
//+------------------------------------------------------------------+
//|                                    Ichimoku trend identifier.mq5 |
//|                                  Copyright 2022, MetaQuotes Ltd. |
//|                                             https://www.mql5.com |
//+------------------------------------------------------------------+
#property copyright "Copyright 2022, MetaQuotes Ltd."
#property link      "https://www.mql5.com"
#property version   "1.00"
#include <Indicators/Trend.mqh>
CiIchimoku*Ichimoku;
//+------------------------------------------------------------------+
void OnInit()
  {
   Ichimoku = new CiIchimoku();
   Ichimoku.Create(_Symbol,PERIOD_CURRENT,9,26,52);
  }

//+------------------------------------------------------------------+
//|                                                                  |
//+------------------------------------------------------------------+
void OnTick()
  {
   MqlRates PArray[];
   int Data=CopyRates(_Symbol,_Period,0,1,PArray);

   Ichimoku.Refresh(-1);
   double TenkanVal= Ichimoku.TenkanSen(0);
   double KijunVal= Ichimoku.KijunSen(0);
   double SpanAVal= Ichimoku.SenkouSpanA(-26);
   double SpanBVal= Ichimoku.SenkouSpanB(-26);
   double ChikouVal= Ichimoku.ChinkouSpan(26);


   if(PArray[0].close>SpanBVal&&PArray[0].close>SpanAVal)
     {
      Comment("The trend is up","\n",
              "Close Value is: ",PArray[0].close,"\n",
              "Tenkan Sen Value is: ",TenkanVal,"\n",
              "Kijun Sen Value is: ",KijunVal,"\n",
              "Senkou Span A Value is: ", SpanAVal,"\n",
              "Senkou Span B Value is: ",SpanBVal,"\n",
              "Chikou Span Value is: ",ChikouVal);
     }

   if(PArray[0].close<SpanBVal&&PArray[0].close<SpanAVal)
     {
      Comment("The trend is down","\n",
              "Close Value is: ",PArray[0].close,"\n",
              "Tenkan Sen Value is: ",TenkanVal,"\n",
              "Kijun Sen Value is: ",KijunVal,"\n",
              "Senkou Span A Value is: ", SpanAVal,"\n",
              "Senkou Span B Value is: ",SpanBVal,"\n",
              "Chikou Span Value is: ",ChikouVal);
     }
  }
//+------------------------------------------------------------------+
Differences in this code will be the same as the following:
Creating a price array by using the MqlRates function that stores price information.
MqlRates PArray[]; Filling the price array by using the CopyRates function after creating an integer variable for Data. CopyRates function gets historical data of MqlRates.
int Data=CopyRates(_Symbol,_Period,0,1,PArray);
Conditions of the Ichimoku trend identifier strategy based on the type of the trend,
In case of the uptrend:
   if(PArray[0].close>SpanBVal&&PArray[0].close>SpanAVal)
     {
      Comment("The trend is up","\n",
              "Close Value is: ",PArray[0].close,"\n",
              "Tenkan Sen Value is: ",TenkanVal,"\n",
              "Kijun Sen Value is: ",KijunVal,"\n",
              "Senkou Span A Value is: ", SpanAVal,"\n",
              "Senkou Span B Value is: ",SpanBVal,"\n",
              "Chikou Span Value is: ",ChikouVal);
     }
In case of the downtrend:
   if(PArray[0].close<SpanBVal&&PArray[0].close<SpanAVal)
     {
      Comment("The trend is down","\n",
              "Close Value is: ",PArray[0].close,"\n",
              "Tenkan Sen Value is: ",TenkanVal,"\n",
              "Kijun Sen Value is: ",KijunVal,"\n",
              "Senkou Span A Value is: ", SpanAVal,"\n",
              "Senkou Span B Value is: ",SpanBVal,"\n",
              "Chikou Span Value is: ",ChikouVal);
     }
After compiling this code, we can find it in the navigator window in the Expert Advisors folder and the following is a picture that shows it.
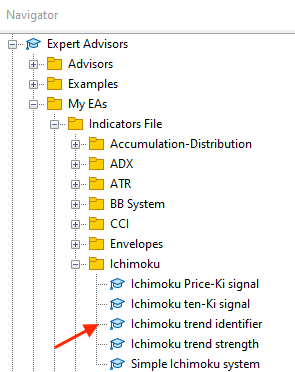
By double-clicking or dragging and dropping it on the chart the Ichimoku trend identifier window will appear the same as the following:
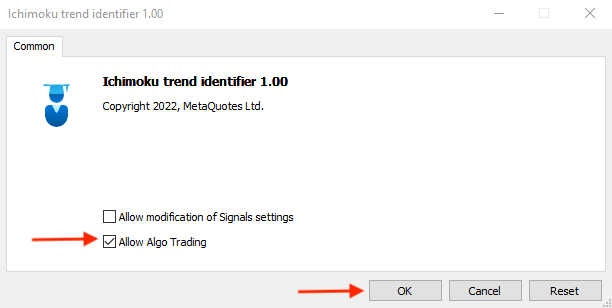
After pressing "Ok", it will be attached to the chart.
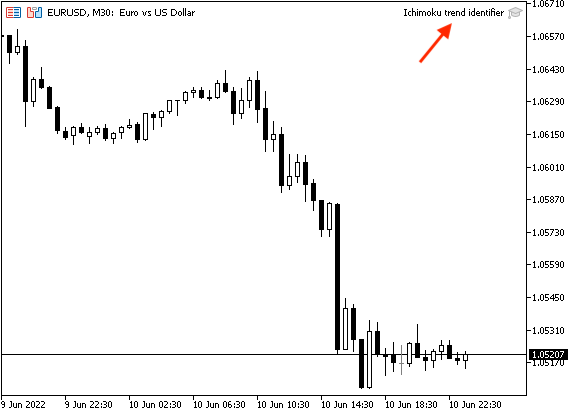
The following is an example of generating signals for uptrend and downtrend based on the strategy conditions.
Uptrend signal:
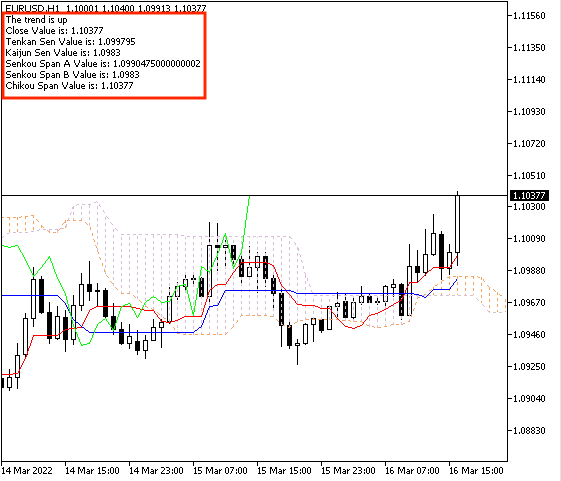
As we can see in the previous picture, there are comments on the charts with the following:
- The trend is up
- Close price Value
- Tenkan Sen Value
- Kijun Sen Value
- Senkou Span A Value
- Senkou Span B Value
- Chikou Span Value
This strategy provides the uptrend type with different values of price and Ichimoku elements.
Downtrend signal:
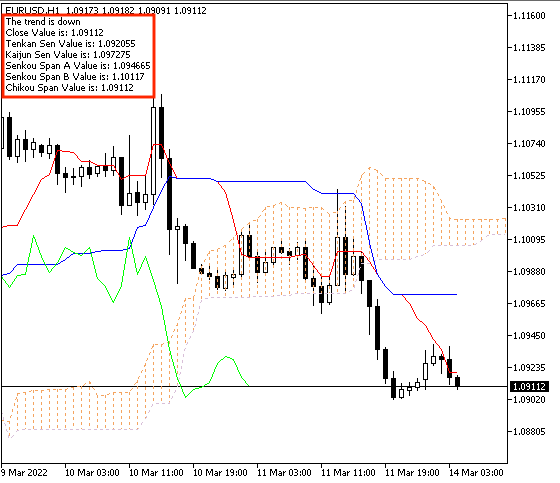
As we can see in the previous picture, there are comments on the charts with the following:
- The trend is down
- Close price Value
- Tenkan Sen Value
- Kijun Sen Value
- Senkou Span A Value
- Senkou Span B Value
- Chikou Span Value
This strategy provides the uptrend type with different values of price and Ichimoku elements.
- Strategy two: Ichimoku trend strength:
According to this strategy, we need to create a trading system that appears as a comment on the chart with the trend strength if it is strong as an uptrend or downtrend. The following code is for writing this trading system on MQL5 that can do that:
//+------------------------------------------------------------------+
//|                                      Ichimoku trend strength.mq5 |
//|                                  Copyright 2022, MetaQuotes Ltd. |
//|                                             https://www.mql5.com |
//+------------------------------------------------------------------+
#property copyright "Copyright 2022, MetaQuotes Ltd."
#property link      "https://www.mql5.com"
#property version   "1.00"
#include <Indicators/Trend.mqh>
CiIchimoku*Ichimoku;
//+------------------------------------------------------------------+
void OnInit()
  {
   Ichimoku = new CiIchimoku();
   Ichimoku.Create(_Symbol,PERIOD_CURRENT,9,26,52);
  }

//+------------------------------------------------------------------+
//|                                                                  |
//+------------------------------------------------------------------+
void OnTick()
  {
   Ichimoku.Refresh(-1);
   double TenkanVal= Ichimoku.TenkanSen(0);
   double KijunVal= Ichimoku.KijunSen(0);
   double SpanAVal= Ichimoku.SenkouSpanA(-26);
   double SpanAPrevVal= Ichimoku.SenkouSpanA(-25);
   double SpanBVal= Ichimoku.SenkouSpanB(-26);
   double ChikouVal= Ichimoku.ChinkouSpan(26);

   if(SpanAVal>SpanAPrevVal&&SpanAVal>SpanBVal)
     {
      Comment("The trend is up and strong","\n",
              "Tenkan Sen Value is: ",TenkanVal,"\n",
              "Kijun Sen Value is: ",KijunVal,"\n",
              "Senkou Span A Prev. Value is: ", SpanAPrevVal,"\n",
              "Senkou Span A Value is: ", SpanAVal,"\n",
              "Senkou Span B Value is: ",SpanBVal,"\n",
              "Chikou Span Value is: ",ChikouVal);
     }

   if(SpanAVal<SpanAPrevVal&&SpanAVal<SpanBVal)
     {
      Comment("The trend is down and strong","\n",
              "Tenkan Sen Value is: ",TenkanVal,"\n",
              "Kijun Sen Value is: ",KijunVal,"\n",
              "Senkou Span A Prev. Value is: ", SpanAPrevVal,"\n",
              "Senkou Span A Value is: ", SpanAVal,"\n",
              "Senkou Span B Value is: ",SpanBVal,"\n",
              "Chikou Span Value is: ",ChikouVal);
     }
  }
//+------------------------------------------------------------------+
Differences in this code are conditions of the strategy,
In case of a strong uptrend:
   if(SpanAVal>SpanAPrevVal&&SpanAVal>SpanBVal)
     {
      Comment("The trend is up and strong","\n",
              "Tenkan Sen Value is: ",TenkanVal,"\n",
              "Kijun Sen Value is: ",KijunVal,"\n",
              "Senkou Span A Prev. Value is: ", SpanAPrevVal,"\n",
              "Senkou Span A Value is: ", SpanAVal,"\n",
              "Senkou Span B Value is: ",SpanBVal,"\n",
              "Chikou Span Value is: ",ChikouVal);
     }
In case of a strong downtrend:
   if(SpanAVal<SpanAPrevVal&&SpanAVal<SpanBVal)
     {
      Comment("The trend is down and strong","\n",
              "Tenkan Sen Value is: ",TenkanVal,"\n",
              "Kijun Sen Value is: ",KijunVal,"\n",
              "Senkou Span A Prev. Value is: ", SpanAPrevVal,"\n",
              "Senkou Span A Value is: ", SpanAVal,"\n",
              "Senkou Span B Value is: ",SpanBVal,"\n",
              "Chikou Span Value is: ",ChikouVal);
     }
After compiling this code, we will find it in the navigator window.
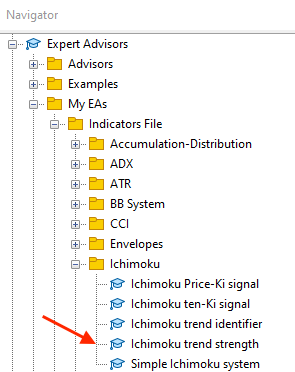
By double-clicking to execute it, we will find the window of the expert the same as the following one:
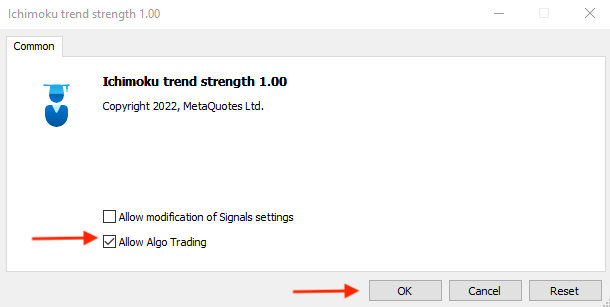
After pressing "OK", the expert will be attached to the chart.
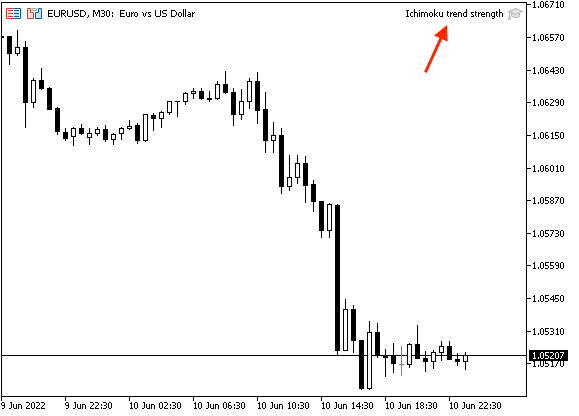
The following is an example of generated signals from testing, in case of a strong uptrend:
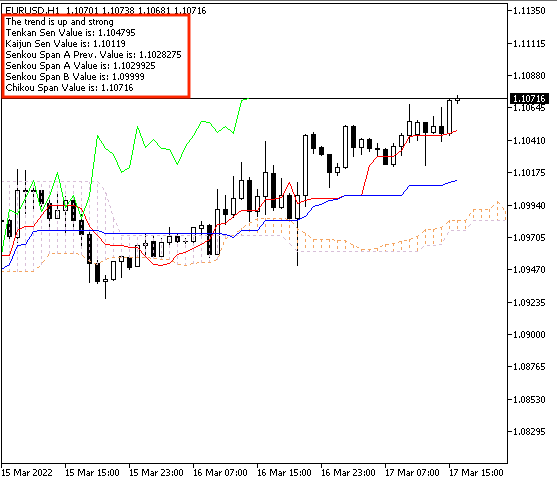
As we can see in the previous picture, we can find comments on the chart with the following values:
- The trend is up and strong
- Tenkan Sen Value
- Kijun Sen Value
- Senkou Span A previous Value
- Senkou Span A Value
- Senkou Span B Value
- Chikou Span Value
Here we can find that the comment informs us that the uptrend is strong. The following is an example of generated signals from testing, in case of a strong downtrend:
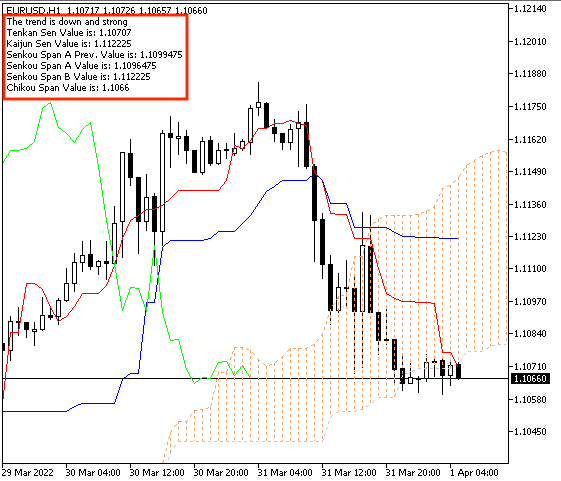
As we can see in the previous picture, we can find comments on the chart with the following values:
- The trend is down and strong
- Tenkan Sen Value
- Kijun Sen Value
- Senkou Span A previous Value
- Senkou Span A Value
- Senkou Span B Value
- Chikou Span Value
On the opposite, we can find that the comment informs us that the downtrend is strong.
- Strategy three: Ichimoku Price-Ki signal:
According to this strategy, we need to create a trading system to generate a comment on the chart with bullish or bearish signals based on the crossover between price and Kijun-sen, the following is the full code to do that.
//+------------------------------------------------------------------+
//|                                     Ichimoku Price-Ki signal.mq5 |
//|                                  Copyright 2022, MetaQuotes Ltd. |
//|                                             https://www.mql5.com |
//+------------------------------------------------------------------+
#property copyright "Copyright 2022, MetaQuotes Ltd."
#property link      "https://www.mql5.com"
#property version   "1.00"
#include <Indicators/Trend.mqh>
CiIchimoku*Ichimoku;
//+------------------------------------------------------------------+
void OnInit()
  {
   Ichimoku = new CiIchimoku();
   Ichimoku.Create(_Symbol,PERIOD_CURRENT,9,26,52);
  }

//+------------------------------------------------------------------+
//|                                                                  |
//+------------------------------------------------------------------+
void OnTick()
  {
   MqlRates PArray[];

   int Data=CopyRates(_Symbol,_Period,0,1,PArray);

   Ichimoku.Refresh(-1);
   double TenkanVal= Ichimoku.TenkanSen(0);
   double KijunVal= Ichimoku.KijunSen(0);
   double SpanAVal= Ichimoku.SenkouSpanA(-26);
   double SpanBVal= Ichimoku.SenkouSpanB(-26);
   double ChikouVal= Ichimoku.ChinkouSpan(26);

   if(PArray[0].close>KijunVal)
     {
      Comment("Bullish signal","\n",
              "Close Value is: ",PArray[0].close,"\n",
              "Kijun Sen Value is: ",KijunVal,"\n");
     }

   if(PArray[0].close<KijunVal)
     {
      Comment("Bearish signal","\n",
              "Close Value is: ",PArray[0].close,"\n",
              "Kijun Sen Value is: ",KijunVal,"\n");
     }
  }
//+------------------------------------------------------------------+
Differences in this code:
Creating and filling the price array,
   MqlRates PArray[];

   int Data=CopyRates(_Symbol,_Period,0,1,PArray);
Condition of the Ichimoku Price-Ki strategy, in case of a bullish signal,
   if(PArray[0].close>KijunVal)
     {
      Comment("Bullish signal","\n",
              "Close Value is: ",PArray[0].close,"\n",
              "Kijun Sen Value is: ",KijunVal,"\n");
     }
Condition of the Ichimoku Price-Ki strategy, in case of a bearish signal,
   if(PArray[0].close<KijunVal)
     {
      Comment("Bearish signal","\n",
              "Close Value is: ",PArray[0].close,"\n",
              "Kijun Sen Value is: ",KijunVal,"\n");
     }
After compiling this code, we can find it in the navigator window.
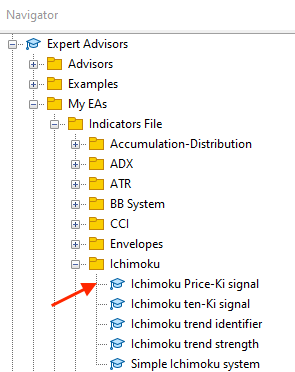
By dragging and dropping it on the chart to execute the expert, the window of the expert will appear.
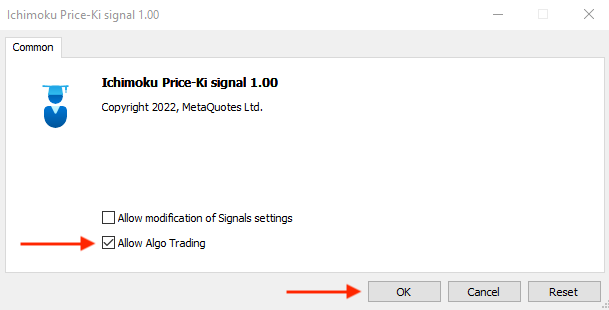
After pressing "OK", it will be attached to the chart.
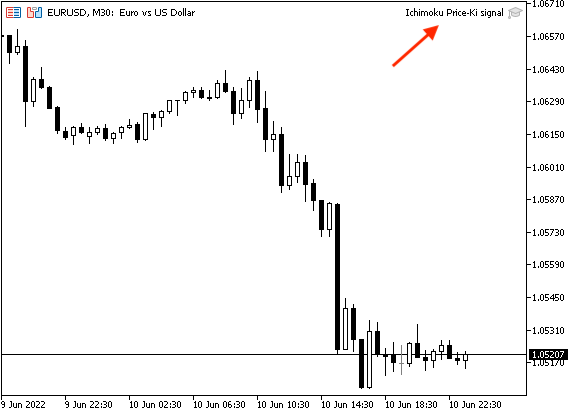
The following is an example of the generated bullish signal from testing.
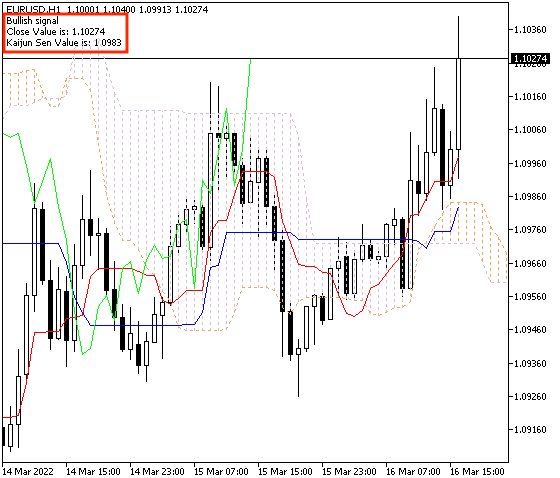
As we can see in the previous example, there is a comment on the chart with:
- Bullish signal
- Closing price value
- Kijun-sen value
This bullish signal is generated based on the crossover between price and Kijun-sen. The following is an example of the generated bearish signal from testing.
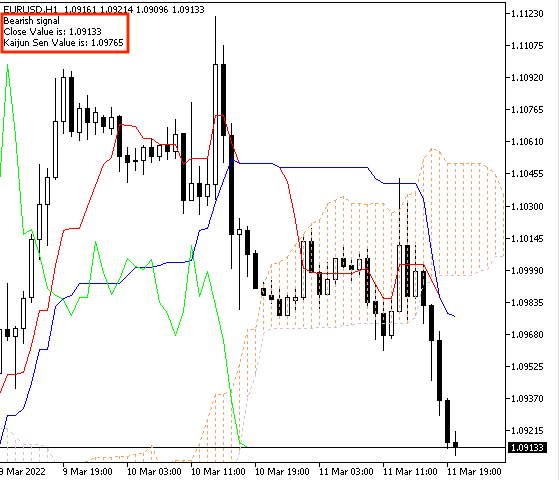
As we can see in the previous example, there is a comment on the chart with:
- Bearish signal
- Closing price value
- Kijun-sen value
This bearish signal is generated based on the crossover between price and Kijun-sen.
- Strategy four: Ichimoku ten-ki strategy:
According to this strategy, we need to create a trading system to generate a comment on the chart with bullish or bearish signals based on the crossover between Tenkan-sen and Kijun-sen, the following is the full code to do that.
//+------------------------------------------------------------------+
//|                                       Ichimoku ten-Ki signal.mq5 |
//|                                  Copyright 2022, MetaQuotes Ltd. |
//|                                             https://www.mql5.com |
//+------------------------------------------------------------------+
#property copyright "Copyright 2022, MetaQuotes Ltd."
#property link      "https://www.mql5.com"
#property version   "1.00"
#include <Indicators/Trend.mqh>
CiIchimoku*Ichimoku;
//+------------------------------------------------------------------+
void OnInit()
  {
   Ichimoku = new CiIchimoku();
   Ichimoku.Create(_Symbol,PERIOD_CURRENT,9,26,52);
  }

//+------------------------------------------------------------------+
//|                                                                  |
//+------------------------------------------------------------------+
void OnTick()
  {
   Ichimoku.Refresh(-1);
   double TenkanVal= Ichimoku.TenkanSen(0);
   double KijunVal= Ichimoku.KijunSen(0);
   double SpanAVal= Ichimoku.SenkouSpanA(-26);
   double SpanBVal= Ichimoku.SenkouSpanB(-26);
   double ChikouVal= Ichimoku.ChinkouSpan(26);

   if(TenkanVal>KijunVal)
     {
      Comment("Bullish signal","\n",
              "Tenkan Sen Value is: ",TenkanVal,"\n",
              "Kijun Sen Value is: ",KijunVal,"\n");
     }

   if(TenkanVal<KijunVal)
     {
      Comment("Bearish signal","\n",
              "Tenkan Sen Value is: ",TenkanVal,"\n",
              "Kijun Sen Value is: ",KijunVal,"\n");
     }
  }
//+------------------------------------------------------------------+
Differences in this code are conditions of the Ichimoku ten-Ki strategy,
In case of a bullish signal:
   if(TenkanVal>KijunVal)
     {
      Comment("Bullish signal","\n",
              "Tenkan Sen Value is: ",TenkanVal,"\n",
              "Kijun Sen Value is: ",KijunVal,"\n");
     }
In case of a bearish signal:
   if(TenkanVal<KijunVal)
     {
      Comment("Bearish signal","\n",
              "Tenkan Sen Value is: ",TenkanVal,"\n",
              "Kijun Sen Value is: ",KijunVal,"\n");
     }
After compiling this code, we will find the expert in the navigator.
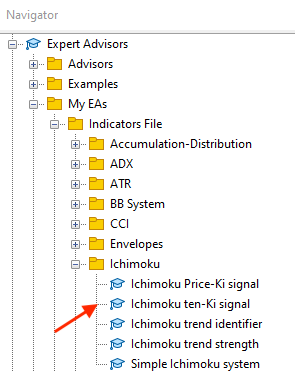
By double-clicking, its window will appear.
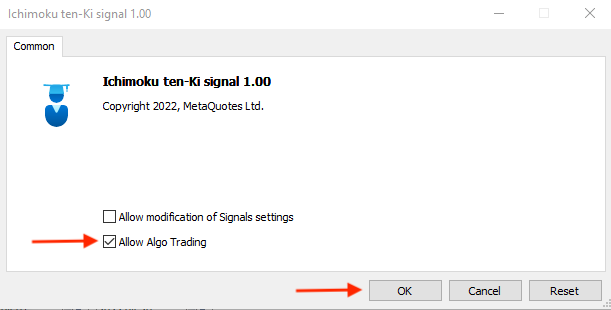
After pressing "OK", the expert will be attached to the chart.
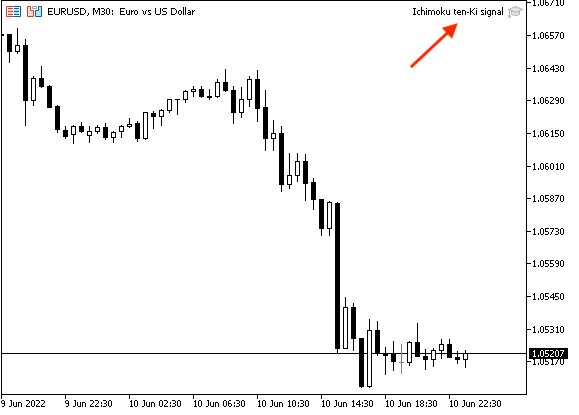
The following is an example of generated bullish signal from testing based on this strategy:
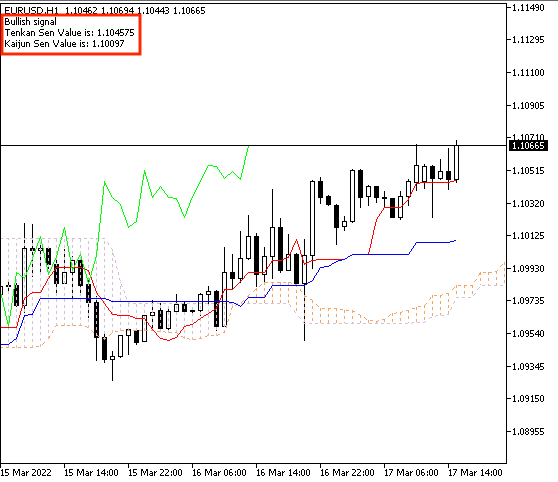
As we can see in the previous example, there is a comment on the chart with:
- Bullish signal
- Tenkan-sen value
- Kijun-sen value
This bullish signal is generated based on the crossover between tenkan-sen and Kijun-sen. The following is an example of generated bearish signal from testing based on this strategy:
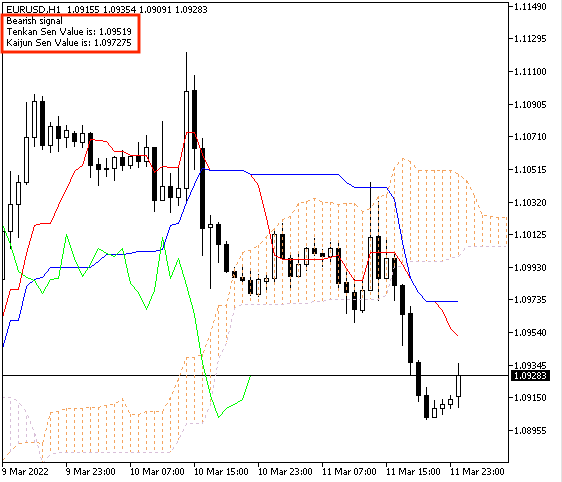
As we can see in the previous example, there is a comment on the chart with:
- Bearish signal
- Tenkan-sen value
- Kijun-sen value
This bearish signal is generated based on the crossover between tenkan-sen and Kijun-sen.
Conclusion
The Ichimoku indicator can be used as a complete system to let you identify more than one perspective on the chart as we learned in this article as you can identify the trend, the strength of the trend, and get trading bullishness or bearishness signals. So, it is very useful in trading and it can enhance our results by taking better decisions by identifying many perspectives by one indicator.
I think that we learned many topics about this indicator to cover it as much as we can but for sure, you may find yourself needing to read more about this indicator and this is normal as we provided basics about it and I encourage you to do that.
We covered many topics in this article about Ichimoku, we learned what is it, what it measures, its construction, and how we can calculate it through the topic of Ichimoku definition. We learn how we can use it through simple strategies based on the basic concept behind it as we learned the following strategies:
- Ichimoku trend identifier: to inform us of the trend type, if it is an uptrend or a downtrend.
- Ichimoku trend strength: to inform us when the trend is strong.
- Ichimoku price-ki signal: to inform us when there is a bullish or bearish signal.
- Ichimoku ten-ki signal: to inform us when there is a bullish or bearish signal based on another method.
We created also a step-by-step blueprint to help us create our trading system based on mentioned strategies. We created a trading system for every mentioned strategy by MQL5 to be used in the MetaTrader 5. I hope that you applied what you learned in this article by yourself as the practice is a very important factor in any educational process. I confirm again to test any strategy before using it on your real account as there is nothing suitable for everyone.
Algorithmic trading is an incredible tool that can help us to trade very well as it helps us to avoid human emotions that can be harmful to our trading because you have to know that emotions play a big role in our trading and it will be a reason for losses. So, when we find a tool that can execute our trades based on our winning strategy automatically, this will be a treasure literally. In addition to that, the time that can be available for us to do other useful things at the same time that our trading system is working for us.
At the end of this article, I hope that you find it useful for you to enhance your trading. If you want to read more similar articles, you can read my other articles in this series about how to design a trading system by the most popular technical indicator.