Experiments with neural networks (Part 1): Revisiting geometry
Roman Poshtar | 5 August, 2022
Introduction
In this article, I would like to share my experiments with neural networks. After reading a large amount of information available on MQL5, I came to the conclusion that the theory is sufficient. There are plenty of good articles, libraries and source codes. Unfortunately, all this data does not lead to a logical conclusion – a profitable trading system. Let's try to fix this.
I am not an expert in this field, much less a writer or a journalist, but I will try to express my thoughts in an accessible way to share my experience.
The material is primarily designed for beginners, like myself.
My understanding. The basics
It is generally believed that neural networks are good at recognizing patterns, while the data passed to the neural network for training is of utmost importance. I will start with this assumption. Let's use geometry. I will transfer geometric shapes to a neural network. To begin with, let's take a regular perceptron, whose specimen I found here (МTC Сombo - expert for MetaTrader 4). While performing tests, I decided to abandon the oscillators and use MA. Tests involving oscillators did not yield good results. I believe, everyone knows about the so-called divergence when the price moves up and the oscillator goes down. MA parameters are closer to the price itself.
Shapes and lines
The basis will consist of two Moving Average indicators with the parameters 1 and 24, the Simple method is applied to Close. In other words, the idea is to pass not only the current indicator locations but also the states, in which they were before the current one. In many examples that I have seen, the price is passed directly to the neural network, which I consider to be fundamentally wrong.
I pass all values in points, which is very important since these values have a certain range beyond which they cannot go. Passing a price to a neural network has no sense since it may oscillate in different ranges for, say, 10 years. Also, keep in mind that we can use different number of indicator parameters when building shapes. Shapes can be complex or simple. A few possible options are provided below. Of course, you can come up with your own ones.
The distances in points on the closed candle 1, 4, 7 and 10 between MA 1 and MA 24.
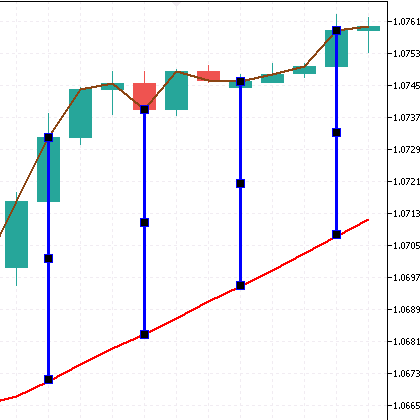
double perceptron1()
  {
   double w1 = x1 - 100.0;
   double w2 = x2 - 100.0;
   double w3 = x3 - 100.0;
   double w4 = x4 - 100.0;

   double a1 = (ind_In1[1]-ind_In2[1])/Point();
   double a2 = (ind_In1[4]-ind_In2[4])/Point();
   double a3 = (ind_In1[7]-ind_In2[7])/Point();
   double a4 = (ind_In1[10]-ind_In2[10])/Point();

   return (w1 * a1 + w2 * a2 + w3 * a3 + w4 * a4);
  }
Shape 2: Simple lines
Distances in points between the closed candle 1-4, 4-7 and 7-10 of MA 1.
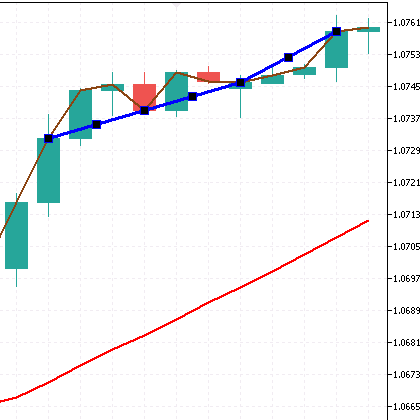
double perceptron2()
  {
   double w1 = y1 - 100.0;
   double w2 = y2 - 100.0;
   double w3 = y3 - 100.0;

   double a1 = (ind_In1[1]-ind_In1[4])/Point();
   double a2 = (ind_In1[4]-ind_In1[7])/Point();
   double a3 = (ind_In1[7]-ind_In1[10])/Point();

   return (w1 * a1 + w2 * a2 + w3 * a3);
  }
Shape 3: Simple lines
Distances in points between the closed candle 1-4, 4-7 and 7-10 of MA 24.
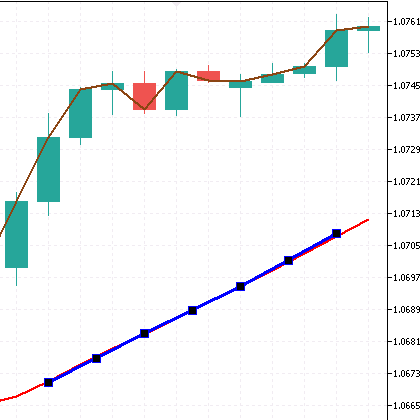
double perceptron3()
  {
   double w1 = z1 - 100.0;
   double w2 = z2 - 100.0;
   double w3 = z3 - 100.0;

   double a1 = (ind_In2[1]-ind_In2[4])/Point();
   double a2 = (ind_In2[4]-ind_In2[7])/Point();
   double a3 = (ind_In2[7]-ind_In2[10])/Point();

   return (w1 * a1 + w2 * a2 + w3 * a3);
  }
Shape 4: Butterfly (envelope)
Distances in points between the closed candle 1-10 of MA 1. And the distance in points between the closed candle 1-10 of MA 24. The distance in points between the candle 1 of MA 1 and the candle 10 of MA 24. The distance in points between the candle 1 of MA 24 and the candle 10 of MA 1. The result is a butterfly.
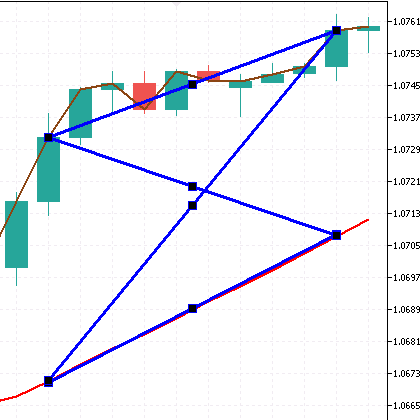
double perceptron4()
  {
   double w1 = f1 - 100.0;
   double w2 = f2 - 100.0;
   double w3 = f3 - 100.0;
   double w4 = f4 - 100.0;

   double a1 = (ind_In1[1]-ind_In1[10])/Point();
   double a2 = (ind_In2[1]-ind_In2[10])/Point();
   double a3 = (ind_In1[1]-ind_In2[10])/Point();
   double a4 = (ind_In2[1]-ind_In1[10])/Point();

   return (w1 * a1 + w2 * a2 + w3 * a3 + w4 * a4);
  }
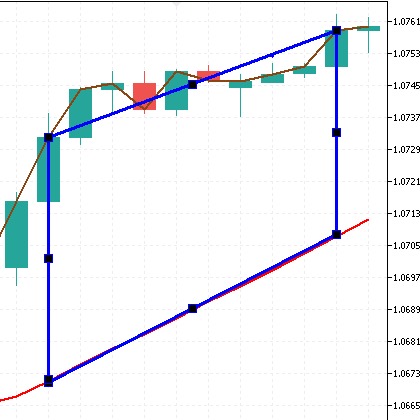
Shape 5: Quadrilateral
The distances in points between the closed candle 1-1, 10-10 between the indicators. And the distance in points between 1-10 of MA 1 and the distance in points between 1-10 of the indicator MA 24. The result is a quadrilateral.
double perceptron5()
  {
   double w1 = c1 - 100.0;
   double w2 = c2 - 100.0;
   double w3 = c3 - 100.0;
   double w4 = c4 - 100.0;

   double a1 = (ind_In1[1]-ind_In1[10])/Point();
   double a2 = (ind_In2[1]-ind_In2[10])/Point();
   double a3 = (ind_In1[1]-ind_In2[1])/Point();
   double a4 = (ind_In1[10]-ind_In2[10])/Point();

   return (w1 * a1 + w2 * a2 + w3 * a3 + w4 * a4);
  }
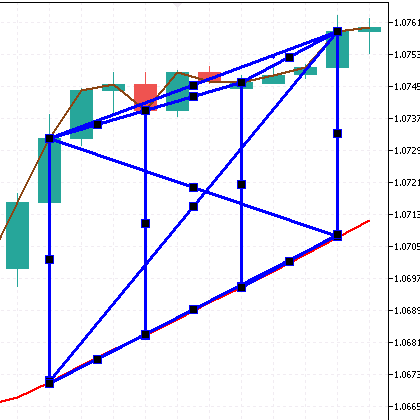
Shape 6: Complex
Here I will combine all the above shapes into a complex one.
double perceptron6()
  {
   double w1 = x1 - 100.0;
   double w2 = x2 - 100.0;
   double w3 = x3 - 100.0;
   double w4 = x4 - 100.0;

   double w5 = y1 - 100.0;
   double w6 = y2 - 100.0;
   double w7 = y3 - 100.0;

   double w8 = z1 - 100.0;
   double w9 = z2 - 100.0;
   double w10 = z3 - 100.0;

   double w11 = f1 - 100.0;
   double w12 = f2 - 100.0;
   double w13 = f3 - 100.0;
   double w14 = f4 - 100.0;

   double a1 = (ind_In1[1]-ind_In2[1])/Point();
   double a2 = (ind_In1[4]-ind_In2[4])/Point();
   double a3 = (ind_In1[7]-ind_In2[7])/Point();
   double a4 = (ind_In1[10]-ind_In2[10])/Point();

   double a5 = (ind_In1[1]-ind_In1[4])/Point();
   double a6 = (ind_In1[4]-ind_In1[7])/Point();
   double a7 = (ind_In1[7]-ind_In1[10])/Point();

   double a8 = (ind_In2[1]-ind_In2[4])/Point();
   double a9 = (ind_In2[4]-ind_In2[7])/Point();
   double a10 = (ind_In2[7]-ind_In2[10])/Point();

   double a11 = (ind_In1[1]-ind_In1[10])/Point();
   double a12 = (ind_In2[1]-ind_In2[10])/Point();
   double a13 = (ind_In1[1]-ind_In2[10])/Point();
   double a14 = (ind_In2[1]-ind_In1[10])/Point();

   return (w1 * a1 + w2 * a2 + w3 * a3 + w4 * a4   +   w5 * a5 + w6 * a6 + w7 * a7   +   w8 * a8 + w9 * a9 + w10 * a10   +   w11 * a11 + w12 * a12 + w13 * a13 + w14 * a14);
  }
Angles
Let's consider another interesting method of passing price data to a perceptron - indicator slope angles. This data also cannot go beyond a certain range, which is quite suitable for us since we want to pass a certain template, just like in the previous case with shapes and lines.
I have come across a lot of methods for defining angles, but many of them depend on the scale of the price chart, which is not suitable for me. So rather than calculating the angle, I am going to calculate the angle tangent using the ratio of the number of points to the number of bars. tg(α) angle tangent is a ratio of the opposite leg a to the adjacent leg b.
![]()
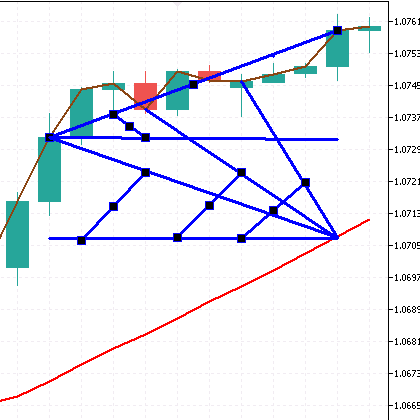
It is also possible to use a different number of indicators, handle complex structures and use a different number of candles for analysis. The slope angles are displayed as unfixed lines on the screenshots. Let's consider several examples.
MA 1 slope angle between candles 1-4, between candles 1-7, between candles 1-10.

double perceptront1()
  {
   double w1 = x1 - 100.0;
   double w2 = x2 - 100.0;
   double w3 = x3 - 100.0;

   double a1 = (ind_In1[1]-ind_In1[4])/4;
   double a2 = (ind_In1[1]-ind_In1[7])/7;
   double a3 = (ind_In1[1]-ind_In1[10])/10;

   return (w1 * a1 + w2 * a2 + w3 * a3);
  }
MA 1 slope between the candles 1-5, between the candles 1-10. MA 24 slope between the candles 1-5, between the candles 1-10.

double perceptront2()
  {
   double w1 = x1 - 100.0;
   double w2 = x2 - 100.0;
   double w3 = x3 - 100.0;
   double w4 = x4 - 100.0;

   double a1 = (ind_In1[1]-ind_In1[5])/5;
   double a2 = (ind_In1[1]-ind_In1[10])/10;
   double a3 = (ind_In2[1]-ind_In2[5])/5;
   double a4 = (ind_In2[1]-ind_In2[10])/10;

   return (w1 * a1 + w2 * a2 + w3 * a3 + w4 * a4);
  }
Perceptront3. 4 slope angles of MA 1 and MA 24 (more or less complex design used as an example)
The angles are tied with a slope between MA 1 and MA 24.
double perceptront3()
  {
   double w1 = x1 - 100.0;
   double w2 = x2 - 100.0;
   double w3 = x3 - 100.0;
   double w4 = x4 - 100.0;

   double a1 = (ind_In1[1]-ind_In1[10])/10;
   double a2 = (ind_In2[1]-ind_In1[4])/4;
   double a3 = (ind_In2[1]-ind_In1[7])/7;
   double a4 = (ind_In2[1]-ind_In1[10])/10;

   return (w1 * a1 + w2 * a2 + w3 * a3 + w4 * a4);
  }
Perceptront4. 4 slope angles of MA 1 and MA 24 (more or less complex design used as an example)
The angles are tied with a slope between MA 1 and MA 24.

double perceptront4()
  {
   double w1 = x1 - 100.0;
   double w2 = x2 - 100.0;
   double w3 = x3 - 100.0;
   double w4 = x4 - 100.0;

   double a1 = (ind_In1[1]-ind_In1[10])/10;
   double a2 = (ind_In2[1]-ind_In1[10])/10;
   double a3 = (ind_In1[1]-ind_In1[10])/10;
   double a4 = (ind_In2[1]-ind_In2[10])/10;

   return (w1 * a1 + w2 * a2 + w3 * a3 + w4 * a4);
  }
Strategy
I decided to use a counter-trend strategy for training by explicitly specifying in the code below. For selling, MA 1 on the first candle is above MA 24. The case is reversed for buying. This is necessary for a clear separation of buying and selling. You, on the other hand, can do the opposite - use a trend.
You can also use other indicators or their values, such as the TEMA indicator. It is impossible to forecast the price movement on 400 points on a five-digit symbol. No one knows where the market will go. Therefore, in order to perform a test, I have set a fixed stop loss of 600 points and a take profit of 60 points for a five-digit symbol. You can download the ready-made EAs below. Let's have a look at the results.
//SELL++++++++++++++++++++++++++++++++++++++++++++++++

if ((CalculatePositions(symbolS1.Name(), Magic, POSITION_TYPE_SELL, EAComment)==0) && (ind_In1[1]>ind_In2[1]) && (perceptron1()<0) &&(SpreadS1<=MaxSpread)){//v1
  OpenSell(symbolS1.Name(), LotsXSell, TakeProfit, StopLoss, EAComment);
}

//BUY++++++++++++++++++++++++++++++++++++++++++++++++

if ((CalculatePositions(symbolS1.Name(), Magic, POSITION_TYPE_BUY, EAComment)==0) && (ind_In1[1]<ind_In2[1]) && (perceptron1()>0) && (SpreadS1<=MaxSpread)){//v1
  OpenBuy(symbolS1.Name(), LotsXBuy, TakeProfit, StopLoss, EAComment);
}
Optimization, testing and resources
As we know, optimization of neural networks requires considerable computing resources. So, while using the strategy tester for optimization, I recommend the "Open prices only" mode with the explicit indication of close prices in the code itself. Otherwise, this is not a feasible task with my rather modest capacities. But even with this optimization mode, I recommend using the Cloud Network service. The goal of optimization is finding certain profitable patterns. The occurrences of such patterns (the number of profitable trades) should be much higher than the unprofitable ones. All depends on the StopLoss/TakeProfit ratio.
Looking ahead, I should say that I performed 10 optimizations of each EA continuously. There are a lot of optimization values, which leads to results of about 10,000-15,000 per pass in the Genetic Algorithm mode. Accordingly, the more passes, the higher the chance to find the desired values of the weight ratios. This issue should be solved by means of MQL5. I really do not want to give up the strategy tester.
In contrast to the article referenced above (where the step is equal to 1), the step of 5 optimization values was not chosen by chance. During the experiments, I noticed that this leads to more scattered results of the perceptron weight ratios, which has a better effect on the results.
- Optimization date from 2010.05.31 to 2021.05.31.
- Modes (Open prices only), (Genetic algorithm), (Maximum profit).
- Initial deposit 10,000.
- TakeProfit = 60, StopLoss = 600.
- Period H1.
- Fixed lot 0.01.
- Optimized parameters x1, x2, x3, x4 - perceptron weight ratios. Optimized by values from 0 to 200 in increments of 5.
Optimization and forward test results.

As you can see, the results are far from promising. The best result is 0.87. There is no point in running a forward test.
- Optimization date from 2010.05.31 to 2021.05.31.
- Modes (Open prices only), (Genetic algorithm), (Maximum profit).
- Initial deposit 10,000.
- TakeProfit = 60, StopLoss = 600.
- Period H1.
- Fixed lot 0.01.
- Optimized parameters x1, x2, x3, x4, y1, y2, y3, z1, z2, z3, f1, f2, f3, f4 - perceptron weight ratios. Optimized by values from 0 to 200 in increments of 5.
Optimization and forward test results.

The result is very similar to the previous one. The best result is 0.94.
Optimizing EA 4 perceptron 4 figure. (Four perceptrons with four different shapes).
The main code looks as follows:
//SELL++++++++++++++++++++++++++++++++++++++++++++++++

if ((CalculatePositions(symbolS1.Name(), Magic, POSITION_TYPE_SELL, EAComment)==0) && (ind_In1[1]>ind_In2[1]) && (perceptron1()<0) && (perceptron2()<0) && (perceptron3()<0) && (perceptron4()<0) && (SpreadS1<=MaxSpread)){//v1
  OpenSell(symbolS1.Name(), LotsXSell, TakeProfit, StopLoss, EAComment);
}

//BUY++++++++++++++++++++++++++++++++++++++++++++++++

if ((CalculatePositions(symbolS1.Name(), Magic, POSITION_TYPE_BUY, EAComment)==0) && (ind_In1[1]<ind_In2[1]) && (perceptron1()>0) && (perceptron2()>0) && (perceptron3()>0) && (perceptron4()>0) && (SpreadS1<=MaxSpread)){//v1
  OpenBuy(symbolS1.Name(), LotsXBuy, TakeProfit, StopLoss, EAComment);
}
- Optimization date from 2010.05.31 to 2021.05.31.
- Modes (Open prices only), (Genetic algorithm), (Maximum of the complex criterion).
- Initial deposit 10,000.
- TakeProfit = 200, StopLoss = 200.
- Period H1.
- Fixed lot 0.01.
- Optimized parameters x1, x2, x3, x4, y1, y2, y3, z1, z2, z3, f1, f2, f3, f4 - perceptron weight ratios. Optimized by values from 0 to 200 in increments of 5.
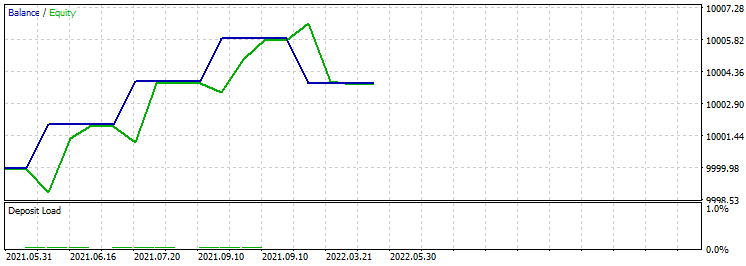
Optimization and forward test results.

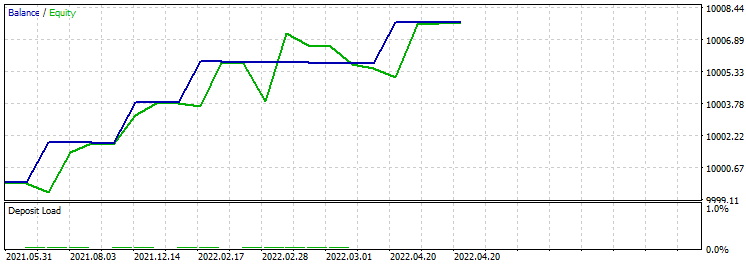
Forward test date from 2021.05.31 to 2022.05.31.Out of all the results, we should choose the one featuring the largest profit factor with the maximum of the complex criterion exceeding 40-50.
- Optimization date from 2010.05.31 to 2021.05.31.
- Modes (Open prices only), (Genetic algorithm), (Maximum profit).
- Initial deposit 10,000.
- TakeProfit = 60, StopLoss = 600
- Period H1.
- Fixed lot 0.01.
- Optimized parameters x1, x2, x3, x4, y1, y2, y3, z1, z2, z3, f1, f2, f3, f4 - perceptron weight ratios. Optimized by values from 0 to 200 in increments of 5.
Optimization and forward test results.

The result has been obtained. The best result is 32. Change the date from 2021.05.31 to 2022.05.31 and run a forward test. Out of all the results, we should choose the one featuring the largest profit factor with the minimum number of deals not less than 10-20.
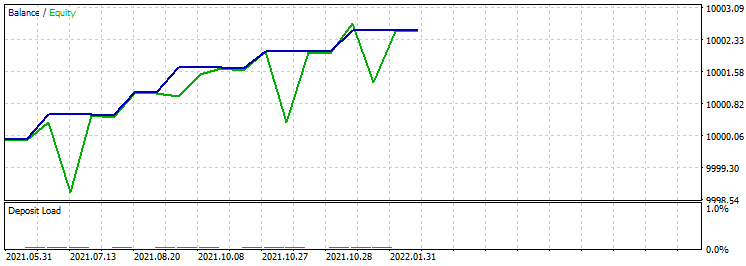
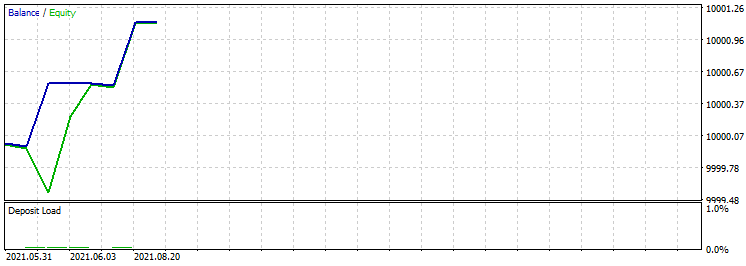
Optimizing EA 4 perceptron 4 tangent. (Four perceptrons with four different angles).
- Optimization date from 2010.05.31 to 2021.05.31.
- Modes (Open prices only), (Genetic algorithm), (Maximum of the complex criterion).
- Initial deposit 10,000.
- TakeProfit = 200, StopLoss = 200.
- Period H1.
- Fixed lot 0.01.
- Optimized parameters x1, x2, x3, x4, y1, y2, y3, z1, z2, z3, f1, f2, f3, f4 - perceptron weight ratios. Optimized by values from 0 to 200 in increments of 5.
Optimization and forward test results.

Forward test date from 2021.05.31 to 2022.05.31. Out of all the results, we should choose the one featuring the largest profit factor with the maximum of the complex criterion exceeding 20-40.
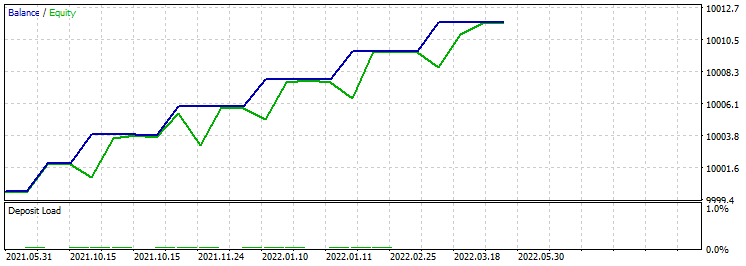
- Optimization date from 2010.05.31 to 2021.05.31.
- Modes (Open prices only), (Genetic algorithm), (Maximum profit).
- Initial deposit 10,000.
- TakeProfit = 60, StopLoss = 600.
- Period H1.
- Fixed lot 0.01.
- Optimized parameters x1, x2, x3, x4, y1, y2, y3, z1, z2, z3, f1, f2, f3, f4 - perceptron weight ratios. Optimized by values from 0 to 200 in increments of 5.
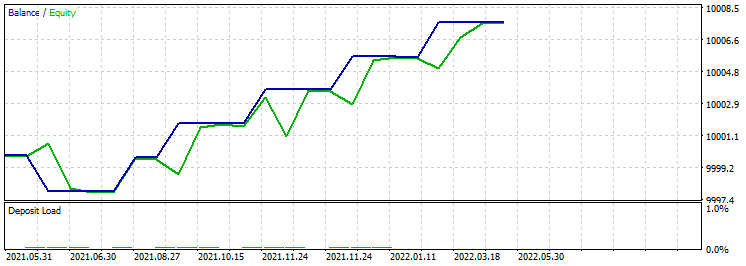
Optimization and forward test results.

The result has been obtained. The best result is 32. I will leave a forward test as a homework. I think, it will be more interesting this way. In addition, it should be noted that the number of trades in relation to the profit factor has increased.
Over the course of my experiments, I have encountered several issues that should be solved.
- First. Due to the complexity of optimizing multiple weight ratio parameters, it is necessary to move them inside the EA code.
- Second. We should have a database for all optimized parameters and then use them in the EA for trading at the same time. I think, it will be possible to use files of .CSV type.
Conclusion
I really hope that my experiments will lead you to new discoveries and, eventually, success. My objective was to obtain a ready-made profitable strategy. I have partially achieved it by getting good forward test results. However, there is still a lot of work ahead. It is time to move on to more complex systems while benefiting from the experience gained. Besides, we should make more use of what we have. Let's discuss this and much more in the second part of our experiments. Do not miss it! Things are about to get more exciting.